ISSN Online: 2333-9721 ISSN Print: 2333-9705
DOI: 10.4236/oalib.1103192 Nov. 27, 2017 1 Open Access Library Journal
Genotype × Environmental Interaction on Seed
Cotton Yield and Yield Components
Nhamo Mudada
1*, James Chitamba
2,
Tinotenda Obriel Macheke
2, Pepukai Manjeru
21Plant Quarantine Services Institute, Mazowe, Zimbabwe
2Agronomy Department, Midlands State University, Gweru, Zimbabwe
Abstract
Cotton yield and fibre quality parameters are dependent on the environment in which the crop is grown. A major challenge in crop genotype recommenda-tions is genotype × environment interaction. The identification of cultivars with high adaptability and stability is one of the best ways to address this chal-lenge. Genotype × Environmental interaction on Gosypium hirsutum was inves-tigated. Ten genotypes were planted in a randomised complete block design with three replications. Collected data were subjected to Analysis of Variance (ANOVA) with genotype and location as factors. Additive Main Effect and Mul-tiplicative Interaction model which combines standard analysis of variance with principal component analysis was used to investigate the genotype main effects, environment main effects and the GE interactions. Significant genotype × en-vironment interactions existed for lint yield, boll weights, staple length, and fuzzy seed grade. There were no significant cultivar × site interactions on total seed cotton yield. Cotton cultivars respond differently to different growing condi-tions implying that, correct choice of varieties by growers for specific produc-tion condiproduc-tions, must be a must to avoid losses due to genotype × environment interactions.
Subject Areas
Plant Science
Keywords
Genotypes, GE, Principal Component Analysis
1. Introduction
Cotton is grown in Zimbabwe in diverse environments by smallholder farmers
How to cite this paper: Mudada, N., Chitamba, J., Macheke, T.O. and Manjeru, P. (2017) Genotype × Environmental Interaction on Seed Cotton Yield and Yield Components. Open Access Library Journal, 4: e3192. https://doi.org/10.4236/oalib.1103192
Received: November 2, 2017 Accepted: November 24, 2017 Published: November 27, 2017
Copyright © 2017 by authors and Open Access Library Inc.
This work is licensed under the Creative Commons Attribution International License (CC BY 4.0).
DOI: 10.4236/oalib.1103192 2 Open Access Library Journal in marginal soils using few inputs and contributing about 99% of the total pro-duction in Zimbabwe [1]. Expression of the genetic potential of newly released varieties is affected by the environmental factors or production conditions. High yielding genotype with quality fibre is of economic importance. Genotype × En-vironmental interaction (GE) of the cotton genotypes is important. Though cot-ton is adapted to harsh growing conditions, it is sensitive to environmental vari-ations like any other [2] [3] [4].
In Zimbabwe, cotton varieties that are commercialised have been generally claimed to be adapted to all cotton growing regions of the country [5]. [6] reported that potential yield in excess of 4000 kg per ha as prescribed by the cotton breeders and agronomists has not really been achieved by the farmers. The national aver-age production currently stands at 800 kg per ha [7] [8] [9]. Although [6] pointed out a failure to use fully production package as the cause of lower cotton yields in communal farms, it is interesting to note the effect of environment on the per-formance of the existing varieties.
Plant breeders claim a wider adaptability of the varieties they recommend to farmers, whilst [10] showed that individual varieties may have limited adaptation because of variety sensitivity to G × E interaction. [11] defined this G × E interac-tion as the failure of genotypes to achieve the same relative performance in differ-ent environmdiffer-ents. GE interactions are considered a hindrance to crop improvemdiffer-ent in target regions, causing instability in crop yields which have a negative effect on farmers’ income. In cases of staple crops failure, it causes food insecurity at na-tional and household levels [12] [13] [14]. According to [14] G × E interactions offer opportunities for selection of adapted genotypes whilst poor yielders are not exploited.
Productivity of a particular genotype is maximised when it is grown in the adapt-able environment. The yield and quality of crops is environmentally dependant, causing specific genotypes to exhibit different phenotypic characteristics under different growing conditions [15]. GE is of great interest when evaluating the sta-bility of genotypes under different environmental conditions [4].
[16] noted that giving farmers the correct advice on choice of varieties in terms of local stability and adaptability is inevitable where GE studies are done. In this context, evaluating the current and promising genotypes under two major agro- ecological regions to determine the stable and adaptable ones specifically to the major growing districts of the country is very important. The best genotypes have high mean yield and are well adapted and stable (IPCA-1 score closer to 0), [17]
[18] [19] [20]. Even though some GE studies have been reported on a number of
crops in the whole world [9] [16] [21] [22] almost none has been reported for cotton production in Zimbabwe.
DOI: 10.4236/oalib.1103192 3 Open Access Library Journal
2. Materials and Methods
2.1. Study Site
The two sites used in this project were Kadoma and Chitekete, which represent the mega and major environments where cotton is being grown in Zimbabwe (Table 1 and Table 2).
2.2. Experimental Design and Germplasm Used
[image:3.595.209.540.258.431.2]The experiment was laid down in a Randomised complete block design with ten treatments replicated three times. The treatments were cotton genotypes at ten levels. The genotypes consisted of four promising and six released Gossypium
Table 1. Climatic characteristics and conditions of Chitekete and Kadoma locations.
Characteristic Study Site
Chitekete Kadoma Latitude
Longitude Altitude Average annual rainfall Average maximum daily temperature
Maximum temperatures recorded Soil properties Natural farming region
Vegetation type
17˚25' south 16˚28' east
914 m 450 - 650 30˚C - 35˚C
45˚C Black vertisols 4 Savannah grasslands 18˚19' south 29˚53' east 1156 m 750 - 100 mm
28˚C - 33˚C 38˚C (MG/SCL)
2b Mopani woodlands
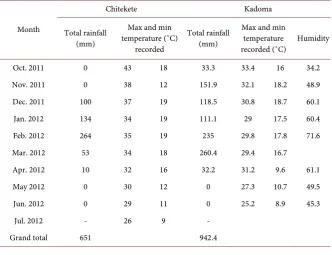
Table 2. Average rainfall data and temperature at Chitekete and Kadoma in 2011-12 cotton growing season in Zimbabwe.
Month
Chitekete Kadoma
Total rainfall (mm)
Max and min temperature (˚C)
recorded
Total rainfall (mm)
Max and min temperature
recorded (˚C) Humidity Oct. 2011 0 43 18 33.3 33.4 16 34.2 Nov. 2011 0 38 12 151.9 32.1 18.2 48.9 Dec. 2011 100 37 19 118.5 30.8 18.7 60.1 Jan. 2012 134 34 19 111.1 29 17.5 60.4 Feb. 2012 264 35 19 235 29.8 17.8 71.6 Mar. 2012 53 34 18 260.4 29.4 16.7 Apr. 2012 10 32 16 32.2 31.2 9.6 61.1 May 2012 0 30 12 0 27.3 10.7 49.5 Jun. 2012 0 29 11 0 25.2 8.9 45.3
Jul. 2012 - 26 9 -
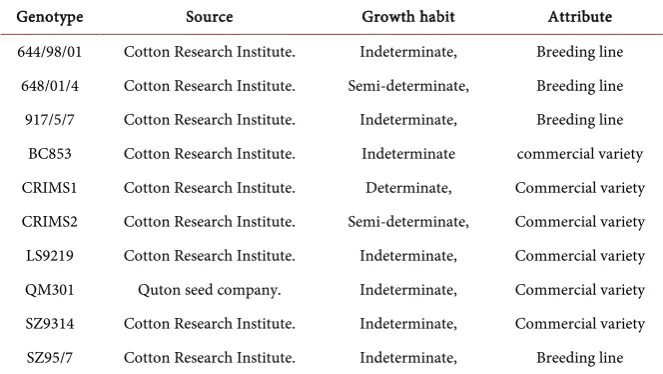
[image:3.595.207.540.474.729.2]DOI: 10.4236/oalib.1103192 4 Open Access Library Journal Table 3. The list of variety codes and sources of germplasm used in this project.
Genotype Source Growth habit Attribute 644/98/01 Cotton Research Institute. Indeterminate, Breeding line
648/01/4 Cotton Research Institute. Semi-determinate, Breeding line 917/5/7 Cotton Research Institute. Indeterminate, Breeding line
BC853 Cotton Research Institute. Indeterminate commercial variety CRIMS1 Cotton Research Institute. Determinate, Commercial variety CRIMS2 Cotton Research Institute. Semi-determinate, Commercial variety LS9219 Cotton Research Institute. Indeterminate, Commercial variety QM301 Quton seed company. Indeterminate, Commercial variety SZ9314 Cotton Research Institute. Indeterminate, Commercial variety SZ95/7 Cotton Research Institute. Indeterminate, Breeding line
hirsutum varieties. These varieties were sourced from the public managed Cot-ton Research Institute and with one commercial variety coming from a privately managed Quton Seed Company. The list of the variety codes are shown in (Table 3). The sources and phenotypic characteristics of the germplasm used (Table 3).
2.3. Experimental Procedure
DOI: 10.4236/oalib.1103192 5 Open Access Library Journal control various pests. Pests were kept at below the economic thresholds levels fol-lowing weekly scouting. No irrigation was applied at both sites. The experiments relied on natural rainfall for crop growth.
2.4. Data Collection and Analysis
The total seed cotton yield was weighed using a digital scale after picking. The total yield per plot was the sum total of split cotton bolls picked as bolls samples, cotton picked at pick one, two three and so on. The total lint yield per plot meas-ured in kg per hectares was estimated using the gin out turn percentages. The lint yield was calculated as the ratio of total seed cotton determined by the gin out turn percentage. Total lint yield per plot = GOT (%) × Total seed cotton harvested per plot (kg/ha) [8].
The total plant population was determined by counting the total plant har-vested in each plot and then calculating the ratio of the plants per plot expressed in hectares.
Each plot had an expected maximum plant population of 200 plants. A total of 20 plants were randomly selected and their height was measured using a 2 m ru-ler. The mean plant height from the 20 plants was considered as the plant height for each genotype in each plot.
The grade of the fuzzy seed was determined using a protocol developed by CRI and edited in 1998 (Table 4).
Seed weight was determined by weighing a total of 100 kennels of ginned seed. The average weight of the 100 seeds was considered as the weight of a single seed in milligrams.
[image:5.595.203.536.535.750.2]The average weight of each split cotton boll was determined using the same procedure as in the weight of a single seed. A total of 100 boll were picked at random from each plot. All the bolls were weighed using a balance scale supplied by Nicholas Scale Company with an accuracy of 0.01 g. the weight of each boll was estimated as the average boll weight obtained from the 100 boll samples
Table 4. Grading of fuzzy cotton seeds [5].
Grade of fuzzy seed Description of seed
1 Clear seed
2 Seed with slight fibre attached 3 Seed with medium fibre attached 4 Whole seed has fibre
5 Fibre hairy
6 Fibre fairly hairy
7 Fibre very hairy
DOI: 10.4236/oalib.1103192 6 Open Access Library Journal picked from each plot.
Gin out turn percentage was estimated using the 100 bolls from each plot. The percentage of lint from each sample was then calculated using simple proportion to determine the gin out turn percentage. GOT = (total seed cotton sample − to-tal ginned seed weights) × 100%/(toto-tal weight of ginned sample).
The total number of bolls per plant was estimated by counting the total num-bers of husks left on the cotton plant after all the bolls were harvested.
The earliness indices were determined by calculating the ratio of early harvests (pick 1) to the total yield harvested at the end of the picking season.
Data were analysed using Genstat 8.1 for windows release 16 March 2005 [23]. Where significance difference was noted, treatments means were separated using the Fischer’s (1930) Least Significant Difference at P ≤ 0.05. Selections of supe-rior varieties were done using the AMMI-1 analysis with Gernstat 8.1 for windows [24]. The interaction effect of genotypes was analysed using additive main effect and multiplicative interaction (AMMI-1) model [25] whilst GE interaction was analysed by a principal component analysis [25]. Principal Component Analysis (PCA) was used to explain patterns in the GE interaction. It was also used to es-timate adaptability or stability of the genotypes across the sites.
3. Results
3.1. GE Effects on Seed Cotton Yield and Yield Components
There were no significant interactions (P > 0.05) of GE on total seed cotton yield (kg/ha). However, the performance of the individual genotypes and sites was highly significant (P < 0.01). Table 5 shows the mean yields of the ten genotypes grown in the two environments, the environment means and the first PCA. Mean yields ranged from 2649 kg/ha for QM301 to 4095 for 644/98/01.
The AMMI-1 analysis model revealed that differences between the environ-ments accounted for (57.6%) of the treatment sum of squares (SS) (Table 6). The genotypes significantly accounted for 34.5% of the total sums of squares whilst GE interaction accounted for 7.9% of the treatment SS. The first interac-tion PCA was not significant (P > 0.05), (Table 6). It captured 100% of the total variation in the GE interaction SS and 100% of the interaction degrees of free-dom.
Figure 1 is a GE biplot of the genotypes across the two sites. LS9219 had the
largest positive interaction with the environment with a first PCA score of 17.69. CRIMS2 and QM301 appeared to have similar interaction with the environment but differ significantly in yield (Table 5) and (Figure 1).
DOI: 10.4236/oalib.1103192 7 Open Access Library Journal had a mean yield of 3852 kg/ha which was above the grand mean whilst Chite-kete had a mean yield of 2804 kg/ha which was below the grand mean of 3328 kg/ha. Results at Kadoma indicated that there were no significant differences on yield. At Chitekete, significant differences were noted with 644/98/01 having the highest yield (Table 5). The test varieties ranked 1, 2, 3 and 7 (644/98/01; SZ95/17; 648/01/04; 917/5/7) at Kadoma whilst the same varieties ranked 1, 2, 5 and 9
Table 5. Mean values and rankings of total seed cotton yield (kg/ha) and first PCA scores for two locations in 2011/2012.
Genotype
Environments
Kadoma Chitekete Combined analysis Mean Rank Mean Rank Genotype mean IPCAg(1)ns
644/98/01 4736 1 3454ab 2 4095a −5.62997 648/01/4 4173 3 3626ab 1 3900ab 12.01445 917/5/7 3657 7 2316c 9 2987de −7.02221 BC853 3481 8 2679bc 7 3080cde 5.89767 CRIMS1 4096 4 2457c 8 3277cd −14.1694 CRIMS2 3926 5 2949abc 4 3437bc 1.69418
LS9219 3283 9 2973abc 3 3128cde 17.68926 QM301 3128 10 2169c 10 2649e 2.11369 SZ9314 3852 6 2682bc 6 3240cde −4.23188 SZ95/7 4185 2 2789bc 5 3487bc −8.35781 Site means 3852.0 2804.0 3328.0
LSD5% Ns 836.0 596.1
CV% 2.3 1.8 15.3
*, ** = Significant at P < 0.05 and P < 0.01 respectively; NS = Not Significant; LSD: Least Significant Differ-ence; Means with different letters are significantly different.
Table 6. AMMI-1 Analysis of variance and decomposition of degrees of freedom for total seed cotton yields of cotton genotypes at two sites in 2011-12.
Source Degrees of freedom Sums of squares Means squares
Total 59 38,582,932
Treatments 19 28,590,093 1,504,742** Genotypes 9 9,856,870 1,095,208** Environments 1 16,468,452 16,468,452**
Block 4 212,766 53,191ns
Interactions (G × E) 9 2,264,771 251,641ns
IPCA(1) 9 2,264,771 251,641ns
Residual 0 0 *
Error 36 9,780,074
[image:7.595.211.540.545.707.2]DOI: 10.4236/oalib.1103192 8 Open Access Library Journal Figure 1. AMMI-1 model for seed cotton yield (kg/ha) showing the means of genotypes and environments against their respective IPCA-1 scores for Kadoma and Chitekete and pat-terns of stability and adaptation.
Figure 2. Genotype total seed cotton mean yields modelled by joint regression for two environments showing environmental sensitivity of different genotypes in 2011/2012.
respectively at Chitekete on total seed cotton yield.
[image:8.595.208.543.421.596.2]DOI: 10.4236/oalib.1103192 9 Open Access Library Journal The yield rankings of the genotypes were not stable across the two environ-ments. Though significant differences were at Kadoma than Chitekete, average seed cotton yields were quite high. The higher yield in Kadoma is attributed to higher rainfall that was received by the crop. The average rainfall requirements for cotton production are 650 mm per season. In Chitekete, the rainfall was just below the minimum average requirements for cotton production. Yield rankings were changing over the two sites.
The varieties were more adapted to Kadoma than Chitekete. All genotypes noted were more adaptable to Kadoma. This study reported differences on yield performance amongst genotypes supporting [26] observations. [27] indicated that GE interactions minimize the usefulness of genotypes by confounding their yield performance subjecting breeders to scrutinise in depth the yield levels, in mul-tiplication trials to reliability and heritability of important traits [28]. The yields obtained from this study were in agreement with yields obtained from trials by cotton agronomists [5]. Poor yield performance of BC853 was noted in this study. This variety was reported to have performed dismally during a stability and adap-tability study of commercial cotton cultivars in Mozambique.
The yields were also lower than those reported in Turkey by Unay et al., 2004 where average total seed cotton yield ranged between 4.13 - 4.9 tonnes per ha in contrary to [19] who recorded lower average yield of 1982 - 3025 kg/ha. More adaptability of 644/98/01 and 648/01/04 to both sites is attributed to the mor-phology of the crop. 644/98/01 has an indeterminate growth habit whilst 648/01/04 displayed a semi-determinate growth habit. The most stable cultivar was CRIMS2 and 644/98/01. Though 644/98/01 was more adapted to Kadoma, its stability and yield performance was excellent. The other test cultivar 648/01/04 had a higher score and was more adapted to Kadoma than Chitekete. BC853 was poorly adapted to environments in this study. IPCA scores of BC853 were very far away from the origin showing its poor stability across the two sites. Manuelgot equivalent results on BC853 from the study on stability and adaptability of commercial cotton cul-tivars in Mozambique. CRIMS2 can be considered an average and stable geno-type for total seed cotton yield. It had IPCA scores closest to zero and with a mean yield above the grand mean. QM301 was also a stable genotype but with a very low average yield. The environments were also variable in both main effects and interaction. The AMMI model identified 648/01/4 and CRIMS2 as good per-formers of positive interaction on total seed cotton yield. SZ95/7 and 644/98/01 were identified as good performers on total seed cotton yield but with negative interaction as revealed by the IPCA scores. SZ9314 which was reported as rela-tively stable in Mozambique, did not perform above the other genotypes in this study.
DOI: 10.4236/oalib.1103192 10 Open Access Library Journal a cross over type of environmental interaction which depicted a complex environ-mental interaction. CRIMS1 and 917/5/7 displayed a divergent type of interaction. CRIMS1 and CRIMS2 showed a convergence type of interaction which [18], de-scried as simple interaction behaviour.
CRIMS2 showed close to zero IPCA score on the mean seed cotton yield. This genotype had a positive interaction IPCA score with the environment. 644/98/01 had the highest yield and had an interaction PCA score of −5.63. The first four selections based on mean yield as explained by [26] [29], indicated that CRIMS2, a commercial cultivar, had the best adaptability scores for it had the smallest PCA score and was closer to the origin as explained by [14] [17] [18] [20] [30]. CRIMS2 was stable across both environments. 644/98/01, a promising variety must be con-sidered for its consistence in yield performance. Though it had a relatively high-er score of −5.63, it had high yield phigh-erformance at both environments. 648/01/04 had a very high positive score of 12.01. The results obtained showed that it lacks a broad adaptation [31] to the environments. The results from this study also re-vealed difficultness in simultaneously selection for yield and stability or adapta-tion. The varieties with higher yield were less stable. In situations where environ-mental conditions differ in different localities, specific adaptation must be con-sidered where varieties are selected specifically for a certain mega environment. Farmers are most interested in variety that produces consistent yields under their growing conditions [30]. Hence, information on G × E interaction and stability is very important for breeders and farmers under a set of environments. In this context, 644/98/01 is better considered a variety for production in areas resem-bling Chitekete conditions whilst 648/01/4 for areas of similar conditions with Kadoma. On the same hand, CRIMS1 can be considered for production at both en-vironments though it has lower mean yield but it was found to be more stable across the two environments on seed cotton yields. Differences amongst genotypes as reported by [26], on yield stability and adaptability were also noted in this present study. The stability scores, mean yield and variance improve the quality of selec-tion [20].
3.2. GE Effects on Stability and Adaptation of Cotton Genotypes for
Boll Weight and Number of Bolls per Plant
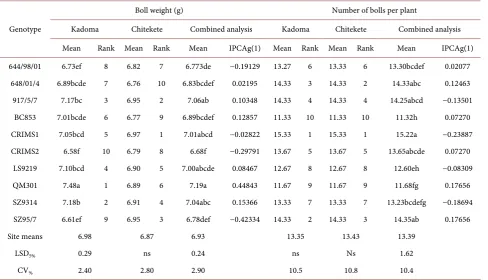
The results obtained from AMMI-1 showed highly significant interactions (P < 0.01) on the weight of cotton bolls. The IPCA scores and the genotypes were also highly significant (p < 0.01) for both. There were no significant differences (P > 0.05) on the weight of the bolls harvested across the environments. Mean boll weight ranged from 6.69 g for CRIMS2 to 7.19 for QM301 (Table 7).
DOI: 10.4236/oalib.1103192 11 Open Access Library Journal Table 7. Means of cotton boll weights, rankings and numbers bolls per plant of ten cotton genotypes and first PCA scores grown in 2 environments in 2011-12.
Genotype
Boll weight (g) Number of bolls per plant
Kadoma Chitekete Combined analysis Kadoma Chitekete Combined analysis Mean Rank Mean Rank Mean IPCAg(1) Mean Rank Mean Rank Mean IPCAg(1) 644/98/01 6.73ef 8 6.82 7 6.773de −0.19129 13.27 6 13.33 6 13.30bcdef 0.02077
648/01/4 6.89bcde 7 6.76 10 6.83bcdef 0.02195 14.33 3 14.33 2 14.33abc 0.12463 917/5/7 7.17bc 3 6.95 2 7.06ab 0.10348 14.33 4 14.33 4 14.25abcd −0.13501
BC853 7.01bcde 6 6.77 9 6.89bcdef 0.12857 11.33 10 11.33 10 11.32h 0.07270 CRIMS1 7.05bcd 5 6.97 1 7.01abcd −0.02822 15.33 1 15.33 1 15.22a −0.23887 CRIMS2 6.58f 10 6.79 8 6.68f −0.29791 13.67 5 13.67 5 13.65abcde 0.07270
LS9219 7.10bcd 4 6.90 5 7.00abcde 0.08467 12.67 8 12.67 8 12.60eh −0.08309 QM301 7.48a 1 6.89 6 7.19a 0.44843 11.67 9 11.67 9 11.68fg 0.17656 SZ9314 7.18b 2 6.91 4 7.04abc 0.15366 13.33 7 13.33 7 13.23bcdefg −0.18694 SZ95/7 6.61ef 9 6.95 3 6.78def −0.42334 14.33 2 14.33 3 14.35ab 0.17656 Site means 6.98 6.87 6.93 13.35 13.43 13.39
LSD5% 0.29 ns 0.24 ns Ns 1.62
CV% 2.40 2.80 2.90 10.5 10.8 10.4
**Significant (P < 0.01), Means with different letters are significantly different.
There were also no significant interactions (P > 0.05) on the total number of bolls harvested per each plant for each genotype. There was no significant dif-ference (P > 0.05) on the bolls harvested per plant. The largest number of bolls was harvested from CRIMS1 (15.22 bolls per plant) whilst BC853 had the least number of bolls per plant of 11.32.IPCA scores were also not significant. The rank-ings indicated in (Table 7), shows more stability of genotypes on their rankings. The test varieties ranked 2, 3, 4 and 6 for both sites. 644/98/01 had the IPCA score closest to zero. It was more stable adapted than the other cultivars. The ge-notypes had the highest mean boll weight at Kadoma and highest number of har-vested bolls at Chitekete, (Table 7).
expe-DOI: 10.4236/oalib.1103192 12 Open Access Library Journal rienced in January and February contributed to the lower number of harvested bolls per each plant because of a tremendous fruit shedding that occurred during this time.
The average boll weights of the elite cultivars were bigger than the old world varieties with average boll mass that ranges below 5 g per boll. The varieties were changing rankings across the two environments. Genotype QM301 was more adapted to Kadoma and yet very unstable across the two sites. CRIMS1 was more adapted to Chitekete.
Generally, the boll weight was not a stable character. Combined analysis of variance on number of harvested bolls per plant indicated that this trait was sta-ble amongst genotypes. The IPCA scores were very close to zero. This character was not affected by the different environmental conditions. The test genotypes though not more adapted maintained their relative rankings across the two sites and is considered more stable on boll weights and number of harvested bolls per plant.
Higher boll weights and boll numbers are considered the basics for higher yielding. Genotypes with improved boll weights and numbers are candidates for higher yields. CRIMS2 showed good and average stability levels. 644/98/01 was more stable in terms of boll numbers whilst 648/01/4 was more stable on the boll weight.
DOI: 10.4236/oalib.1103192 13 Open Access Library Journal
3.3. GE Effects on Stability and Adaptation of Cotton Genotypes for
Seed Weight
There were no significant interactions (P > 0.05) of genotype × environment on the weights of seed of cotton genotypes planted at two sites. However, significant differences (P < 0.05) were noted on genotypes main effects only. Table 8 shows the results of the effect of genotype × environment on the performance of cotton genotypes on seed weight at Chitekete and Kadoma. The IPCA scores were all below 0.50 and were also not significant (P > 0.05). Mean seed weights ranged from 11.60 mg (917/5/7) to 13.12 mg (QM301) per seed. The mean seed weight was 12.61 mg. QM301 ranked 1 on both sites. The test variety SZ95/7 ranked 4 on both sites in terms of seed weight whilst the other test varieties ranked 9:9; 8:7 and 10:10 for seed index (Table 8).
3.4. GE Effects on Stability and Adaptation of Genotypes for Plant
Height
There were no significant GE interactions (P > 0.05) on the performance of cot-ton genotypes on plant height. There were also no significant differences (P > 0.05) on the environment and genotype main effects on the final plant height of cotton genotypes. Chitekete had taller plants of mean 128.1 cm whilst Kadoma had mean average plant heights of 123.6 cm (Table 9).
[image:13.595.207.539.448.710.2]The genotypes changed ranks across the environments. QM301 with ranks 2 and 3 for both sites had the smallest IPCA score and was more stable at the two sites.
Table 8. Mean seed weight (mg) of ten cotton genotypes grown in 2 environments means and first PCA scores in 2011/2012.
Genotype
Environments
Chitekete Kadoma Combined analysis Mean Rank Mean Rank Mean IPCAg(1) 644/98/01 11.93bc 9 12.27de 9 12.10d 0.11037
648/01/4 12.50ab 8 12.67abcd 7 12.58bc −0.05194 917/5/7 11.33c 10 11.87e 10 11.60d 0.30513
BC853 12.63ab 5 13.03abc 3 12.83abc 0.17529 CRIMS1 12.53ab 7 12.80abcd 6 12.68abc 0.04544 CRIMS2 12.68ab 3 12.37ce 8 12.57abc −0.60376
LS9219 12.57ab 6 12.87abcd 5 12.72abc 0.07790 QM301 13.03a 1 13.20a 1 13.12a −0.05194 SZ9314 13.03a 2 13.17ab 2 13.10ab −0.08440 SZ95/7 12.67ab 4 12.97abcd 4 12.82abc 0.07790 Site means 12.50 12.72 12.61
LSD5% 0.90* 0.7433* 0.56*
CV% 4.20 3.40 3.80
DOI: 10.4236/oalib.1103192 14 Open Access Library Journal Table 9. Mean plant height (cm) of ten cotton genotypes grown in 2 environments and first PCA scores in 2011/2012.
Genotype
Environments
Chitekete Kadoma Average of two sites Mean Rank Mean Rank Mean IPCAg(1)ns
644/98/01 122.0 9 119.7 8 120.8 0.45785 648/01/4 125.4 6 116.7 9 121.0 −0.90217
917/5/7 120.8 10 125.7 6 123.2 1.99589 BC853 131.4 5 130.3 1 130.9 0.72843 CRIMS1 123.6 8 112.0 10 117.8 −1.50742 CRIMS2 132.1 4 123.0 7 127.6 −0.98762 LS9219 124.9 7 126.0 4 125.4 1.20551 QM301 133.7 3 129.3 2 131.5 0.03062 SZ9314 132.8 2 127.3 3 130.1 −0.19724 SZ95/7 134.4 1 126.0 5 130.2 −0.82385 Site means 128.1 123.6 125.9
LSD5% ns Ns ns
CV% 9.6 5.8 8
nsnon-significant (P > 0.05) Means with different letters are significantly different.
The results obtained in this study revealed no significant differences amongst genotypes at all sites and on the combined analysis of variance. Changes in rank-ings of the genotypes over the two sites were not very high. 644/98/01 maintained its relative rank across the two sites. QM301 had a PCA score of 0.03062 and was more stable on plant height. All other genotypes showed IPCA values far away from zero depicting instability. Amongst the test cultivars, SZ95/7 was more adapted to Chitekete with the other test genotypes ranked least in terms of adaptation and stability. The study by [32] indicated an average plant height of 143.3 cm to 180.00 cm, values that are higher than those obtained in this study of 116.7 - 134.4 cm.
3.5. GE Effects on Stability and Adaptation of Genotypes for Crop
Earliness Index
The firsts PCA scores and the interactions were not significant, (P > 0.05). The environments had highly significant differences (P < 0.01) between them. Chi-tekete had the highest maturity index of 78.59% whilst Kadoma had the lowest maturity index of 69.15% (Table 10).
DOI: 10.4236/oalib.1103192 15 Open Access Library Journal Table 10. Maturity index means (%) and rankings of ten cotton genotypes grown in 2 environments and first PCA scores 2011/2012.
Genotype
Environments
Chitekete Kadoma Average of two sites Mean Rank Mean Rank Mean IPCAg(1)ns
644/98/01 88.11a 1 61.24 10 74.67 2.65074 648/01/4 82.02a 3 68.49 6 75.25 0.62217 917/5/7 83.20a 2 73.37 3 78.29 0.05961 BC853 80.79a 5 70.33 5 75.56 0.15630 CRIMS1 80.32ab 6 62.43 8 71.38 1.28583 CRIMS2 71.26bc 9 61.57 9 66.41 0.03989 LS9219 76.65bc 7 80.17 1 78.41 −1.97047 QM301 66.98c 10 73.23 4 70.10 −2.38538 SZ9314 81.30a 4 65.50 7 73.40 0.96763 SZ95/7 75.25bc 8 75.20 2 75.23 −1.42633 Site means 78.59 69.15 73.87
LSD5% 10.47 ns ns
CV% 7.80 16.20 12.00
*Significant (P < 0.05) Means with different letters are significantly different.
(P > 0.05) on the genotypes. LS9219 showed the earliest maturity index of 78.41% whilst CRIMS2 had the lowest maturity index of 66.41% (Table 10). 917/5/7 had the least score and was found to be generally more stable across the two sites.
More cotton yield was harvested at Chitekete than Kadoma in the first picking of mature seed cotton. LS9219 showed the earliest maturity index of 78.41% whilst CRIMS2 had the lowest maturity index if 66.41%. Maturity index values from this study are closely related to those by [32] who reported values of 71.0 to 83.0 percent. The temperature ranges of Chitekete as shown in Table 3, indi-cated that there was more heat units for the crops per day in Chitekete than in Kadoma. Chitekete, though more drier had higher average daily temperatures than Kadoma. This depicted a more closely higher degree days per day as indi-cated. Kadoma had lower maximum temperatures as compared to Chitekete. Test cultivars 644/98/01 and 648/01/04 ranked 1, and 3 at Chitekete yet 10 and 6 at Kadoma. The results indicated poor stability of these two varieties across the two sites. Adaptation of the test varieties was more inclined to Chitekete than Kadoma. CRIMS2 was more stable for this trait over the two sites. In terms of ranks, it ranked 9 for both sites and its maturity values were rated second on the mean separation.
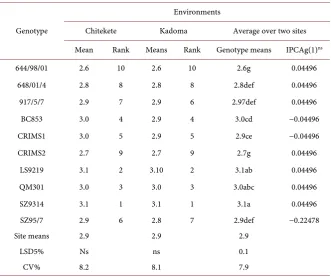
3.6. GE Effects on Stability and Adaptation of Genotypes
for Vegetative Branch Development
interac-DOI: 10.4236/oalib.1103192 16 Open Access Library Journal tions (P > 0.05) between the environment and the genotype. The environment had no influence on the number of monopodia branches developed (P > 0.05). For the genotypes, the mean differences of the number of vegetative branches developing were highly significant (P < 0.01). Table 11 show the mean mono-podia numbers developed on each plant and the first IPCA scores from AMMI-1 of the cotton genotypes planted in two different environments. The largest pop-ulation of vegetative branches developed on SZ9314 (3.1 branches) and the least was found on 644/98/01 with a mean of 2.6 branches per plant. The test varieties ranked poorest at both sites, i.e. 6, 7, 8 and 10 rankings for both sites (Table 11).
[image:16.595.208.540.426.703.2]The largest population of vegetative branches developed on SZ9314 (3.13 branches) and the least was found on 644/98/01 with a mean of 2.6 branches per plant. SZ9314 is a determinate variety which grows very big branches. [32] found the mean monopodia branches to range between 3.13 and 4.13 as well. The geno-type with highest mean seed cotton yield, 644/98/01 (2.6 branches) and 648/01/4 (2.833 branches) did not show higher records of vegetative branches. The total numbers of sympodial for the highest yielding genotypes across the sites were significantly lower than that of SZ9314 (3.133 braches). The genotypes produced between two and four monopodia branches agreeing very well with literature on the number of branches developing on G. hirsutum varieties [8]. The number of the vegetative branches affects the reproduction potential of cotton cultivars. Cotton cultivars with less vegetative braches and more of fruiting symbodial
Table 11. Number and rankings of monopodia branches developed on cotton genotypes grown in 2 environments means and first PCA scores in 2011/2012.
Genotype
Environments
Chitekete Kadoma Average over two sites Mean Rank Means Rank Genotype means IPCAg(1)ns
644/98/01 2.6 10 2.6 10 2.6g 0.04496 648/01/4 2.8 8 2.8 8 2.8def 0.04496 917/5/7 2.9 7 2.9 6 2.97def 0.04496 BC853 3.0 4 2.9 4 3.0cd −0.04496 CRIMS1 3.0 5 2.9 5 2.9ce −0.04496 CRIMS2 2.7 9 2.7 9 2.7g 0.04496
LS9219 3.1 2 3.10 2 3.1ab 0.04496 QM301 3.0 3 3.0 3 3.0abc 0.04496 SZ9314 3.1 1 3.1 1 3.1a 0.04496 SZ95/7 2.9 6 2.8 7 2.9def −0.22478
Site means 2.9 2.9 2.9
LSD5% Ns ns 0.1
CV% 8.2 8.1 7.9
DOI: 10.4236/oalib.1103192 17 Open Access Library Journal branches are the most ideal for a cultivated variety. More photosythates were chan-nelled to vegetative growth at the expense of reproduction. It is most ideal to have fewer non fruiting monopodia vegetative branches on cotton. These results are in agreement with [33] about GE interactions.
3.7. GE Effects on Stability and Adaptation of Genotypes
for Number of Locules per Mature Cotton Boll
[image:17.595.207.541.441.716.2]The number of locules per each boll was never influenced by environment or ge-notype, (P > 0.05), (Table 12). The genotype and environment main effects were also not significant (P > 0.05). Locule number per boll ranged from 4.7 to 5.0. There were also no significant differences (P > 0.05) at individual sites on the number of locules per each boll. Stability and adaptation IPCA scores were rela-tively lower indicating it as stable character on cotton genotypes. The number of locules per boll on each plant is normally affected by height at which the boll develops. Bolls developing earlier in the season normally have five locules whilst those developing late in the season have four to three locules and are normally found on the upper parts of the stem. The results were contradicting those ob-tained by [32] who noted an average locule number of 3 - 4 per boll. 917/5/7 maintained rankings over the sites and was more adaptable and stable. The ge-notypes showed relative stability over the two sites. Test gege-notypes compared the same with commercial cultivars. Number of locules does not directly influence yield, it indicates the time of development of the harvested bolls. They also indicate
Table 12. Number and rankings of locules developed on cotton genotypes grown in 2 en-vironments means and first PCA scores from2011/2012.
Genotype
Environments
Chitekete Kadoma Combined over two sites Mean Rank Mean AMMI Rank Genotype means IPCAg(1) 644/98/01 5.0 8 4.7 4 4.8 0.32951
648/01/4 5.0 9 4.7 5 4.8 0.32951 917/5/7 5.0 1 5.0 1 5.0 0.02996 BC853 5.0 2 5.0 2 5.0 0.02996 CRIMS1 4.7 3 5.0 7 4.8 −0.26960 CRIMS2 4.7 4 5.0 8 4.8 −0.26960 LS9219 4.7 5 5.0 9 4.8 −0.26960 QM301 5.0 6 5.0 3 5.0 0.02966 SZ9314 4.7 7 5.0 10 4.8 −0.26960 SZ95/7 5.0 10 4.7 6 4.8 0.32951
Site means 4.9 4.9 4.9
LSD5% Ns ns ns
CV% 6.1 6.5 7.0
DOI: 10.4236/oalib.1103192 18 Open Access Library Journal the sizes of the bolls. Indeterminate varieties have more bolls with fewer locules than determinate varieties as the later only develops fruits and stops producing more flowers. The results obtained showed that all the varieties used in this study had a mean locule number close to five or five.
3.8. GE Effects on Stability and Adaptation of Genotypes
for Number of Fruiting Branches per Plant
There were no significant GE interactions (P > 0.05) on the number of sympodi-al branches produced by the genotypes. The principsympodi-al components were sympodi-also not significant (P > 0.05). There were also no significant differences (P > 0.05) brought by different environments on the number of sympodial developing on each plant. Combined analysis on genotypes, however, showed significant differences (P < 0.05) on the number of sympodial branches produced on them. Analysis of variance at individual sites revealed no significant differences (P > 0.05) amongst genotypes. SZ9314 had the largest mean number of fruiting branches of 7.3 whilst LS9219 had the least mean number of reproductive branches of 5.9 of all the test cultivars, on-ly 644/98/01 had number of branches similar to the best cultivar SZ9314 (Table 13).
[image:18.595.208.540.440.710.2]SZ9314 had the largest mean number of fruiting branches of 7.3 whilst LS9219 had the least mean number of reproductive branches of 5.9. [32] found that the average number of monopodia per plant ranged between 25 and 30, contradict-ing with those from this study. The second highest yieldcontradict-ing genotype on seed
Table 13. Number and rankings of reproductive branches developed on cotton genotypes grown in 2 environments means and first PCA scores in 2011-12.
Genotype
Environments
Chitekete Kadoma Average over two sites Mean Rank Mean Rank Genotype means IPCAg(1) 644/98/01 6.9 3 6.77 3 6.77abc −0.11848 648/01/4 6.1 7 5.93 9 6.00c 0.14480
917/5/7 6.0 9 5.97 8 5.97c −0.11848 BC853 6.6 4 6.53 4 6.58bc 0.07898 CRIMS1 6.4 5 6.33 5 6.37bc 0.01316 CRIMS2 7.1 2 7.08 2 7.08ab −0.05266
LS9219 5.9 10 5.90 10 5.90c −0.11848 QM301 6.3 6 6.77 6 6.23bc 0.14480 SZ9314 7.4 1 7.23 1 7.30a 0.14480 SZ95/7 6.1 8 6.07 7 6.07c −0.11848
Site means 6.5 6.4 6.4
LSD5% Ns Ns 0.9
CV 13.0 12.0 12.2
DOI: 10.4236/oalib.1103192 19 Open Access Library Journal cotton, 648/01/4 had significantly lower fruiting branches than SZ9314. For the highest yielding variety 644/98/01, the mean number of fruiting branches was comparable to that of SZ9314. The number of reproductive branches developing on each plant was a stable character. IPCA scores were all close to zero. CRIMS2 combined the best was the most stable and adaptable.
4. Conclusions
There was no significant GE interaction on total cotton yield of cotton genotypes grown under the two different environments. There were also no significant GE interactions on seed weight, number of bolls per plant, plant height number of symbodial branches and number of monopodia branches on cotton genotypes. The genotypes showed near to or above average performance across all the environ-ments. Combined analysis revealed that varieties 644/98/01 (4095 kg/ha of seed cotton yield), 648/01/4 (3900 kg/ha), SZ95/7 (3487 kg/ha) and CRIMS2 (3437 kg/ha) were the best varieties on total seed cotton yield across the sites respectively. The best lint yielders were 644/98/01 (1563 k/ha per lint yield), 648/01/4 (1455 kg/a), CRIMS1 (1324 kg/ha) and CRIMS2 (1278 kg/ha). No single genotype exhibited all the best agronomic performance rankings for all the variants tested. The ge-notype CRIMS2 could be ranked between 1 and 4 for the four most important aspects of total seed cotton yield.
The most adapted genotypes that could be put to future use for Chitekete on seed cotton yield were 648/01/0, 644/98/01, LS9219 and CRIMS2.
Boll weights, plant height, numbers of monopodia developing on cotton plants, number of locules per boll, number of reproductive branches and number of bolls per plant were relatively stable characteristics of cotton genotypes across the two sites. The seed cotton yields, seed weights and maturity index were less stable cha-racteristics across the two environments. On both sites, cultivar CRIMS2 was ranked more stable over a number of characteristics including total seed cotton yield but with lower mean yield of 3437 kg/ha. CRIMS2 can be cultivated in both Chite-kete and Kadoma with a realisation of a stable yield performance.
The study also showed that genotype agronomic performance was significantly affected by GE interaction on lint yield, boll weights, and fuzzy seed grade. There were no significant GE interactions on gin outturn percentages on cotton geno-types. The cultivar 648/98/01 ranked best on fibre yield and was a very stable cul-tivar on this variant.
Recommendation
Current varieties can be grown across Kadoma and Chitekete areas with minimum losses of GE interactions being incurred on total seed cotton yields if the seasons remain relatively the same. Agro-ecological regions 4 and 2a need to be regarded as separate environments when breeding for seed cotton.
DOI: 10.4236/oalib.1103192 20 Open Access Library Journal the areas used in this study.
The study of GE interaction in the country need to be further carried out over several sites and seasons to come up with a much defined trend of the GE interac-tion pattern of cotton genotypes. Though the Additive Main effect and Multip-licative Interaction models used produced yielding results on analysing Genotype × environment interaction, genotype main effects and environment main effects, there is the need to use other statistical methods like regression [34] [35] to fur-ther evaluate the stability and adaptability trend of cotton genotypes.
Acknowledgements
The Cotton Research Institute of Department of Research and Specialist Services for providing resources. The Principal Director of DR & SS.
References
[1] Gono, L.T. (2005) Cotton Research Institute: An Overview of Research Highlights, Current Status and Future Strategies. CRI, Bag 765, Kadoma.
[2] Bacusmo, J.L., Collins, W.W. and Jones, A. (1988) Comparison of Methods of De-termining Stability and Adaptation of Sweet Potato. Theoretical and Applied Ge-netics, 75, 492-497.https://doi.org/10.1007/BF00276755
[3] Ngeve, J.M. (1993) Regression Analysis of Genotype × Environment Interaction in Sweet Potato. Euphytica, 71, 231-238.https://doi.org/10.1007/BF00040412
[4] Manrique, K. and Hermann, M. (2000) Effect of G × E Interaction on Root Yield and Betacarotene Content of Selected Sweetpotato (Ipomoeabatatas (L) Lam.) Va-rieties and Breeding Clones. CIP Program Report 1999-2000-287.
[5] Anonymous (2007) Cotton Research Institute Annual Reports. Department of Re-search and Specialist Services, Kadoma, Zimbabwe. R & SS Information Services, Harare.
[6] Mudada, N., Jarachara, M. and Gono, L.T. (2007) Participatory Plant Breeding through Variety Selection and Farmer Training in Cotton Production: A Case Study for Zimbabwe. Agricultural Scientific Symposium, Agricultural Research and Ex-tension, Harare, 22-24 October 2007.
[7] I.C.A.C. (2004) Cotton Review of the World Situation. Volume 57 No. 6 July-August 2004.
[8] ICAC (2006) Cotton World Statistics, Bulletin of the International Cotton Advisory Committee. Published by International Cotton Advisory Committee, Washington
DC. http://www.icac.org
[9] Akparobi, S.O. (2009) Evaluation of Six Cultivars of Soybean under the Soil of Rainforest AgroEcological Zones of Nigeria. Middle-East Journal of Scientific Re-search, 4, 6-9.
[10] Dixon, A.G.O., Asiedu, R. and Hahn, S.K. (1991) Genotypic Stability and Adapta-bility: Analytical Methods and Implications for Cassava Breeding for Low Input Agriculture. Proceedings of the 9th Symposium of the International Society for Tropical Root Crops, Accra, 20-26 October 1991, 130-137.
[11] Baker, R.J. (1998) Tests for Cross over Genotype-Environment Interactions. Cana-dian Journal of Plant Science, 68, 405-410.https://doi.org/10.4141/cjps88-051
Pro-DOI: 10.4236/oalib.1103192 21 Open Access Library Journal gramme. Theoretical and Applied Genetics, 82, 363-367.
https://doi.org/10.1007/BF02190624
[13] Ceccarelli, S. (1989) Wide Adaptations, How Wide? Euphytica, 40, 197-205. [14] Annichiarico, P. (2002) Genotype × Environmental Interactions: Challenges and
Opportunities for Plant Breeding and Cultivar Recommendations. FAO Plant Pro-duction and Protection Paper 174. Instituo Sperimentale per le Colture Foraggere, Lody, Italy. Food and Agriculture Organisation of the United Nations, Rome. [15] Kang, M.S. (1998) Using Genotype-by-Enviromnetal Interaction for Crop Cultivar
Development. Advances in Agronomy, 62, 199-252.
https://doi.org/10.1016/S0065-2113(08)60569-6
[16] Thanki, H.P., Sawargaonkar, S.L. and Hudge, B.V. (2010) Genotype × Environment Interaction for Biometrical Traits in Pigeon Pea (Cajanuscajan L. Millsp.) under Varying Spacings. Electronic Journal of Plant Breeding, 1, 925-928.
[17] Yan, W., Hant, L.A., Qinglai, S. and Szalvinics, Z. (2000) Cultivar Evaluation and Mega-Environment Investigation Based on the GGE Biplot. Crop Science, 40, 597-605.https://doi.org/10.2135/cropsci2000.403597x
[18] Ferreira, D.F., Demetrio, C.G.B., Bryan, F.J.M., Amauri De Almeida, M. and Re-lond, V. (2006) Statistical Models in Agriculture: Biometrical l Methods for Analys-ing Phenotypic Stability in Plant BreedAnalys-ing. Cerene Lavras, 12, 373-388.
[19] Naveed, M., Nadeem, M. and Islam, N. (2007) AMMI Analysis of Some Upland Cotton Genotypes for Yield Stability in Different Mileus. World Journal of Agricul-tural Sciences, 3, 39-44.
[20] Nassir, A.L. and Ariyo Omolayo, J. (2011) Genotype × Environmental Interaction and Yield Stability Analysis of Rice Grown in Tropical Inland Swamp. Notulae Bo-tanicae Horti Agrobotanici Cluj-Napoca, 39, 220-229.
[21] Ngeve, J.M. (1994) Yield Stability Parameters for Comparing Cassava Varieties. Proceedings of the 9th Symposium of the International Society for Tropical Root Crops, Accra, 20-26 October 1991, 138-145.
https://doi.org/10.17660/ActaHortic.1994.380.21
[22] Dixon, A.G.O. and Nukenine, E.N. (2000) Genotype × Environmental Interaction and Optimum Resources Allocation for Yield and Yields Components of Cassava. African Crop Science Journal, 8, 1-10.https://doi.org/10.4314/acsj.v8i1.27711
[23] Hempstead, H. (2005) Developers of GernStat Analytical Software, GernStat for Windows 8th Edition. Rothampstead Research, VSN, International Limited. [24] Van Fred, E., Martin, B. and Marcos, M. (2011) Modeling G × E and Its Genetic
Ba-sis: QTLxE. Wageningen.
[25] Gauc, H.G. (1992) Statistical Analysis of Regional Yield Trials: AMMI Analysis of Factorial Designs. Elsevier, Amsterdam.
[26] Khan, N.G., Naveed, M. and Khan, N.I. (2008) Assessment of Some Novel Upland Cotton Genotypes for Yield Constancy and Malleability. International Journal of Agriculture and Biology, 10, 109-111. http://www.fspublishers.org
[27] Pham, H.N. and Kang, M.S. (1988) Inter-Relationships among Repeatability of Sev-eral Stability Statistics Estimated from International Maize Trials. Crop Science, 28, 925-928.https://doi.org/10.2135/cropsci1988.0011183X002800060010x
[28] Becker, H.C. and Leon, J. (1988) Stability Analysis in Plant Breeding. Plant Breed-ing, 101, 1-23.https://doi.org/10.1111/j.1439-0523.1988.tb00261.x
DOI: 10.4236/oalib.1103192 22 Open Access Library Journal Journal of Agriculture and Social Sciences, 2, 17-19.
[30] Mulusew, F., Tadesse, T. and Tesfaye, L. (2008) Genotype-Environment Interac-tions and Stability Parameters for Grain Yield of Faba Bean (Vaciafaba L.) Geno-types Grown in South Eastern Ethiopia. International Journal of Sustainable Crop Production, 3, 80-87.
[31] Sayyed, H.S., Farhang, R., Seyyed, F.D., Davood, T. and Asghar, E. (2012) Additive Effect and Multiplicative Interaction Analysis for Grain Yield of Chickpea (Cicer arietinum L.) in Iran. ISRN Agronomy Volume 2012.
https://doi.org/10.5402/2012/639381
[32] Vemanna, I.R. (2007) A Comparative Study on Heterosis and Combing Ability in Intra-Herbaceum and Interspecific Crosses (G. HerbaceumL. X G. ArboreumL.) of Desi Cotton. Master Thesis, Dharwad University of Agricultural Sciences, Dharwad. [33] Salaheldin, H.A. and Abdalla, A.H. (2006) Stability Analysis in Some Upland Cotton
(Gossypium hirsutum L.) Genotypes. The Journal of Agricultural Science, 14, 326-342. [34] Toler, J.E. and Burrows, P.M. (1998) Genotypic Performance over Environmental
Arrays: A Non-Linear Grouping Protocol. Journal of Applied Statistics, 25, 131-143.
https://doi.org/10.1080/02664769823368
[35] Eberhart, S.A. and Russel, W.A. (1966) Stability Parametrs for Comparing Varieties. Crop Science, 6, 36-40.
https://doi.org/10.2135/cropsci1966.0011183X000600010011x
Submit or recommend next manuscript to OALib Journal and we will pro-vide best service for you:
Publication frequency: Monthly
9 subject areas of science, technology and medicine
Fair and rigorous peer-review system
Fast publication process
Article promotion in various social networking sites (LinkedIn, Facebook, Twitter,
etc.)
Maximum dissemination of your research work
![Table 4. Grading of fuzzy cotton seeds [5].](https://thumb-us.123doks.com/thumbv2/123dok_us/50512.505256/5.595.203.536.535.750/table-grading-fuzzy-cotton-seeds.webp)