Munich Personal RePEc Archive
The Possible Tragedy of Quantitative
Easing: An IS-LM Approach
Kui-Wai, Li and Bharat R., Hazari
City University of Hong Kong
1 May 2015
Online at
https://mpra.ub.uni-muenchen.de/64652/
E-axes On Monetary Policy and Central Banking, Working Paper, May 1, 2015
The Possible Tragedy of Quantitative Easing: An IS-LM Approach
Kui-Wai Li† and Bharat R. Hazari*
Abstract
The object of this paper is to demonstrate the possible risks of quantitative easing in the long run. The analysis is conducted in the conventional framework of IS-LM curves in a sequential model, which assumes that the independence of supply and demand curves does not necessarily hold. It is established that this lack of independence coupled with a very flat (or kinked) IS curve may lead to falls in income in second period as a consequence of quantitative easing. Such easing may alter the behavior of investors who get encouraged to undertake very risky and leveraged investments. Thus, short term gains may be outweighed by long term losses from quantitative easing. In some cases such easing may create bubbles in the economy, for example, in the housing and stock markets which collapse at some point in time.
Keywords: interest rate, quantitative easing, IS-LM framework, non-independence of supply and
demand curves.
JEL classifications: E40, E50
___
† Corresponding author: Associate Professor, Department of Economics and Finance, City
University of Hong Kong, Tel.: 852 34428805; Fax: 852 34420195; E-mail:
* Adjunct Professor, Department of Economics, City University of Hong Kong. Email:
I Introduction
In an important lecture entitled “Phising for Phools” in 2013, Akerlof made the important
remark that “many economists believed that derivatives led to the current (2008) crisis”. He
further observed that economists could not express this idea in a form which could be published.
This paper attempts to capture the derivatives (or speculative investments) market by using the
conventional IS-LM framework. The paper is not in the tradition of modern macroeconomics
which is very much based on growth theory. In the traditional framework we attempt to show
that quantitative easing (henceforth called QE) encourages the growth of the high risk derivatives
market which may result in a financial crisis (Thornton, 2010; Mendoza and Vincenzo, 2010;
Casteknuovo, 2012;Coibion, 2012; Li, 2014).
This paper follows the non–neoclassical tradition of Sraffa (1926, 1960) who did not
believe in the independence of the supply and demand curves. Similarly Fuchs (1978) questioned
the assumption of the independence between supply and demand curves in the case of surgeons.
He argued that surgeons have the ability to push both the demand and supply curves – hence an
increase in the supply of surgeons may lead to an increase in the demand for surgeries. More
recently, Soros (1995) has also questioned the independence of these curves. We will also use
this lack of independence to argue that QE may result in possible economic disaster in the long
run.
Given these observations, this paper analyses the implications of the non-independence of
demand and supply curves in macroeconomics. The model is based on behavioral responses to
QE which affects the IS curve. The IS curve may become kinked with a very flat section
representing very speculative behavior or a continuous curve which becomes very flat at low
interest rates. A kinked IS curve is generated by extremely low interest rates which come into
play with QE. Alternatively, the IS curve becomes perfectly elastic at very low interest rates. In
this case the IS curve will have a “speculative trap” from the demand side. There would then be
two traps in the macro model: one in the IS curve and the other in the LM curve. QE allows the
interest rates to remain very low and also encourages leveraging and speculative investments.
We proceed to analyze the above situation in a two-period model. The lengths of these
periods are arbitrary. It is shown that in the first period QE may lower interest rates and produce
higher income. However, if the economy is in both the speculative trap IS curve and the liquidity
We assume that there is a one period lag in the response of the IS curve. It is as if Arrowian
learning by doing is taking place which causes people to switch from less speculative to more
speculative behavior thereby taking increasing risk in the hope of earning a higher return. This
may give rise to the possibility of lowering income in period 2 which represents a crash or the
bursting of the bubble. In some cases the bubble may be pricked by tightening the monetary
policy itself.
II A Kinked or Flat IS Curve
The market interest rate and the official interest rate are different entities. However, they
are related to each other - the market rate being some multiple of the official rate. A low official
rate implies that the market rate would also be low. Long periods of low interest rates may result
in a behavioral shift in the psychology of borrowers and investors. It may lead to heavy
leveraging, speculation and risky investments. This shift in psychology is reflected in our model
in either in a kinked or very flat IS curve. QE is being used by many countries to keep the
interest rate low and also to stimulate the economy from the monetary side rather than the fiscal
side.
The IS curve shows the relation between the rate of interest and income. It represents the
demand side of a macro model. The demand side relationship is modified in the following way.
At low interest rates there is a behavioral shift in the psychology of the investors, and it
represents itself in investment behavior characterized by highly speculative trading and
investments. Also in some cases a high degree of leveraging.
Figure 1(a) shows the traditional downward sloping IS curve. In Figure 1(b) we add a
speculative IS curve which comes into play at low interest rates. It starts at point “A” which is
the choking point for this speculative type of investment. An aggregate kinked IS curve is drawn
in Figure 1(c). It should be noted that the IS curve does not necessarily have to be kinked.
Alternatively, it could just become very flat at low interest rate as shown in Figure 1(d). This
flattening out could be dubbed as the “speculative trap”. Either one of these two IS curves can
Figure 1
III Sequential Analysis
It is appropriate now to introduce the supply side of this model, that is, the LM curve.
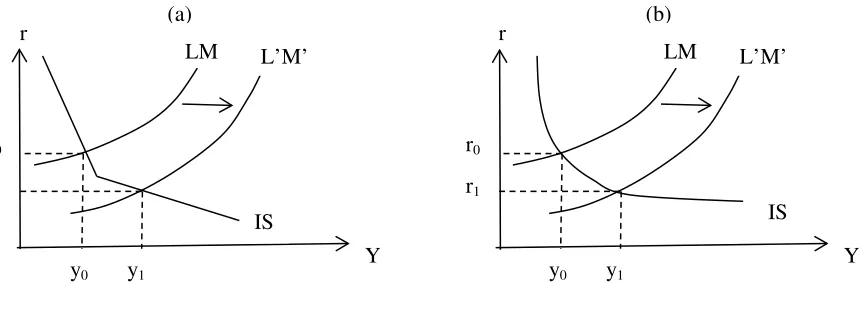
The analysis is undertaken in a two period model. QE shifts the LM curve rightwards as shown
in Figure 2(a) and 2(b). In the first period only the LM curve. The LM curve shifts to the right
raising income and reducing the interest rate. In both the kinked and the flattened out IS curve
income rises and market interest rate falls. Recall that the interest rate is fixed in the background.
Figure 2
Y r
IS
(a) r
Y A
IS Speculative (b)
r
Y (c)
Kinked IS
(d) r
Y Flat IS
r
Y IS
LM L’M’
r0
r1
y0 y1
r
Y IS
LM L’M’
r0
r1
y0 y1
[image:5.612.92.524.519.677.2]
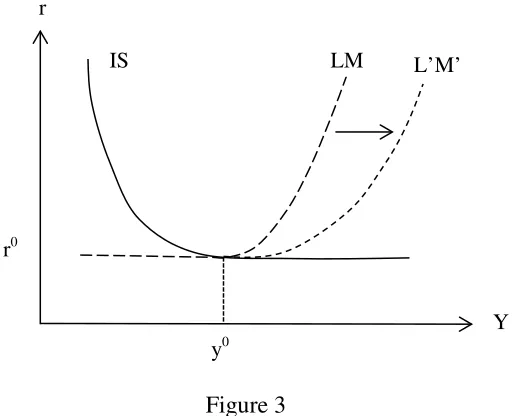
Next, we introduce the Keynesian liquidity trap. We consider the case where the flat
segments of both the IS and LM curves overlap with each other. In this portion there are multiple
equilibria. An interesting case is depicted in Figure 3 where both curves are flat and the solution
for QE ends up in picking one of these points. In this case nothing changes as both r and y are
completely trapped in the overlapping portions of the IS and LM curves. The movement in the
LM curve in fact allows for the fact that a unique equilibrium point is chosen. It removes the
[image:6.612.183.439.237.445.2]possibility of the system being indeterminate.
Figure 3
In period 1, the IS curve remains unchanged, while the QE led to the shift of the LM to
L’M’. The QE has two possible scenarios:
S1: The LM curve shifts to the right and with it the speculative market takes a life of its own.
Income rises and interest rate falls. This can be seen both in the case of a kinked IS curve or a
flat IS curve, as shown in Figure 2.
S2: There is a liquidity trap in both the IS and LM curves and the economy is trapped. QE fails
to move the economy out of this equilibrium position. QE leaves both r and y unchanged, as
shown in Figure 3.
In period 2, the IS curve shifts as a result of QE in period 1. There is interesting
symmetry in the two periods in terms of the shifts of the curves: in period 1 only the LM shifts
and IS remains the same while in period 2 the LM curve remains the same but the IS curve shifts.
The Sraffa lack of independence between the supply and demand curves is at work here. We
r
r0
y0
Y
assume that there is a one period lag in the movement of the IS curve. The two portions of the IS
curve behave in different ways. The relatively inelastic portion of the curve shifts leftwards and
the flatter portion shifts rightwards. The behavioral change implies that individuals move
investments out of the less risky part of the IS schedule to the relatively more risky segment of
the curve. There is substitution between less risky towards the more risky investments.
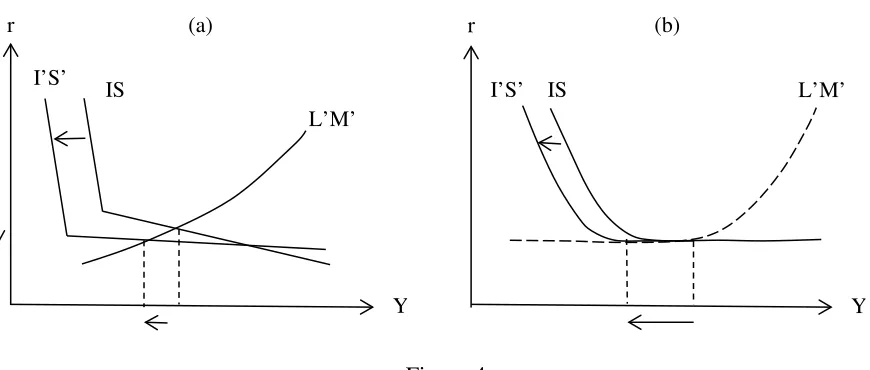
Consider the two situations in Figure 4. Figure 4(a) shows the case of the kinked IS curve.
When the IS curve shifts leftwards to I’S’, the dominance of the risky speculative derivatives
investment made the lower portion of the new I’S’ curve flatter. The QE policy represented by
L’M’ would now produce a lower interest rate and a lower level of output. Figure 4(b) shows the
extreme case where the two curves interact at the trap. As such, interest rate will not change but
[image:7.612.83.518.320.505.2]output can fall considerably.
Figure 4
The arguments made above and illustrated in Figures 4(a) and 4(b) clearly demonstrate
the possibility of a long term fall in income emanating from QE and low interest rate policies.
The way out of the trap is to think in terms of raising interest rates to a natural level (the term
natural is difficult to define but may be defined in the same way as natural rate of
unemployment).This could be accomplished in many ways including government interventions
in the speculative markets, not undertaking QE and not following the policy of very low interest
rates.
I’S’ IS
Y L’M’ r
I’S’ IS
(a) r (b)
IV Discussion
In the wake of the 2008 financial crisis, the monetarists warned that prolonged low
interest rate may result in serious and undesirable economic consequences, for example, eroding
the function of money as a store of value, and more importantly is the inability of the interest rate
in promoting output-oriented investment (Schwartz, 2009; Gomis-Porqueras and Sanches, 2011;
Wright, 2011; Schmidt, 2012; Mumtaz and Zanetti, 2012). However, empirical studies have
failed to resolve these issues as they have been inconclusive(Thornton, 2010; Hamilton and Wu,
2012; Gambacortia et al., 2014).
Low interest rates and QE encourage asset substitution away from money as its value
falls. The assumption of a segmented investment sector is important as the prolonged low
interest rate encourages speculators to undertake highly leveraged investments in high risk assets.
Eventually, out-put-oriented investment will fall.
Several countries have adopted the low interest rate policies to stimulate their economies.
Statistics show that there are co-movements in interest rates among OECD countries. For
example, empirical studies on both US and Japanese economies have confirmed that the prolong
use of ultra-low interest rate regime and the QE policy provide evidence to the possibility of a
segmented investment sector (Fujiki et al., 2001; Shirakawa, 2002; Kimura and Small, 2004; Li,
2013; 2014). A low interest rate regime creates a substitution effect between less risk and high
risk activities in, for example, leveraging and growth of derivatives market.
Similar to Friedman’s (1968) steady money supply argument, there should be a steady
and positive interest rate across countries. There is a distinction in policy terms as to whether the
interest rate should be used as a short term instrument to combat inflation or as a vehicle in
smoothing the business cycle (Judd and Rudebusch, 1998; Mehra and Minton, 2007; Taylor,
2012). Inflation is more of a short term phenomenon and the conventional instrument is demand
management through fiscal policy. Because of its indirect nature in influencing output, the
interest rate is more of a long term instrument in affecting output and growth. Hence using
interest rate to control inflation would mean the use of a long term instrument for a short term
goal. The unintended consequence will result in a number of economic phenomena. One is that
the business cycles may become a function of the interest rate policy. One the contrary, one
would have thought that the business cycle should reflect the investment activities in the private
and business cycle stability.
V Conclusion
This paper makes various theoretical improvements in the IS-LM framework by
introducing a kinky IS (or flat IS curve), sequential analysis and the lack of independence
between IS and LM curves. The main argument of this paper is that a policy of a prolonged low
interest rate regime, coupled with the QE policy, may eventually result in fall in income
(bursting of a bubble created by such policies). In the long run such policies may not promote
growth. The economy may be “trapped” in a “low interest rate - low growth” vicious economic
cycle.
References
Castelnuovo, E., 2012, “Estimating the evolution of money’s role in the U.S. monetary business cycle”. Journal of Money, Credit and Banking, 44, 1, February, 23-52.
Coibion, O., 2012, “Are the effects of monetary shocks big or small?”. American Economic Journal: Macroeconomics, 4, 2, 1-32.
Friedman, Milton, 1968, “The role of monetary policy”. American Economic Review, 58, March, 1-17.
Fuchs, Victor R., 1978, The Supply of Surgeons and the Demand for Operations, Working Paper No. 236, Center for Economic Analysis of Human Behavior and Social Institutions, Stanford: National Bureau of Economic Research, March.
Fujiki, H., Okina, K., and Shiratsuka, S., 2001, “Monetary policy under zero interest rate: Viewpoints of central bank economists”. Monetary and Economic Studies, February, 89-130.
Gambacortia, Leonardo, Hofmann, B. and Peersman, G., 2014, “The effectiveness of unconventional monetary policy at the zero lower bound: A cross-country analysis”.
Journal of Money, Credit and Banking, 46, 4, June, 615-642.
Gomis-Porqueras, P., and Sanches, D., 2013, “Optimal monetary policy in a model of money and credit”. Journal of Money, Credit and Banking, 45, 4, June, 701-730.
Hamilton, James D., and Wu, J. C., 2012, “The effectiveness of alternative monetary policy tools in a zero lower bound environment”. Journal of Money, Credit and Banking, 44, 1, February, 3-46.
Judd, John P. and Rudebusch, Glenn D., 1998, “Taylor’s rule and the Fed: 1970–1997”. Federal Reserve Bank of San Francisco Economic Review, 3, 3–16.
Kimura, T., and Small, D., 2004, Quantitative Monetary Easing and Risk and Financial Asset
D. C., September.
Li, K.-W., 2013, “The U.S. monetary performance prior to the 2008 crisis”. Applied Economics, 45, 24, August, 3449-3460.
Li, K.-W., 2014, “Could there be a "Sub-market Interest Rate" in the IS-LM Framework?”,
E-axes, Research Paper on Monetary Policy and Banking, New York, May.
Mehra, Yash P. and Minton, Brian D., 2007, “A Taylor rule and the Greenspan era”. Economic Quarterly, 93 (3), 229-250.
Mendoza, E. G., and Vincenzo, Q., 2010, “Financial globalization, financial crisis and contagion”. Journal of Monetary Economics, 57, 24-39.
Mumtaz, H., and Zanetti, F., 2012, “The impact of volatility of monetary policy shocks”.
Journal of Money, Credit and Banking, 45, 4, June, 535-558.
Schwartz, A. J., 2009, “Origins of the financial market crisis of 2008”. Cato Journal, 29, 1, 19-23.
Schmidt, S., 2013, “Optimal monetary and fiscal policy with a zero bound on nominal interest rates”. Journal of Money, Credit and Banking, 45, 7, October, 1335-1350.
Shirakawa, M. (2002). One Year Under “Quantitative Easing”, IMES Discussion Paper No.2002-E-3, Bank of Japan, Tokyo.
Soros, George, 1995, Soros on Soros: Staying Ahead of the Curve. New York: John Wiley and Sons.
Sraffa, Piero, 1926, “The Laws of Returns under Competitive Conditions”, Economic Journal, 36, 44, December, 535-550.
Sraffa, Piero, 1960, Production of Commodities by Means of Commodities, Cambridge: Cambridge University Press.
Taylor, J. B., 2012, First Principles: Five Keys to Restoring America’s Prosperity. New York: W. W. Norton & Company.
Thornton, D. L., 2010, “Would QE2 have a significant effect on economic growth,
employment, or inflation?”. Economic Synopses, Federal Reserve Bank of St. Louis, 29, 1-2.
Wright, J., 2011, What does Monetary Policy Do to Long-term Interest Rate at Zero Lower