http://go.warwick.ac.uk/lib-publications
Original citation:
Keeble, Dean Samuel, Benabdallah, Feres, Thomas, Pam A., Maglione, Mario and Kreisel, Jens. (2013) Revised structural phase diagram of (Ba0.7Ca0.3TiO3)-(BaZr0.2Ti0.8O3). Applied Physics Letters, Vol.102 (No.9). Article no. 092903.
Permanent WRAP url:
http://wrap.warwick.ac.uk/42394
Copyright and reuse:
The Warwick Research Archive Portal (WRAP) makes the work of researchers of the University of Warwick available open access under the following conditions. Copyright © and all moral rights to the version of the paper presented here belong to the individual author(s) and/or other copyright owners. To the extent reasonable and practicable the material made available in WRAP has been checked for eligibility before being made available.
Copies of full items can be used for personal research or study, educational, or not-for-profit purposes without prior permission or charge. Provided that the authors, title and full bibliographic details are credited, a hyperlink and/or URL is given for the original metadata page and the content is not changed in any way.
Publisher’s statement:
The following article has been accepted by Applied Physics Letters. After it is published, it will be found at http://apl.aip.org/?/apl/102/092903 or
http://dx.doi.org/10.1063/1.4793400
A note on versions:
The version presented here may differ from the published version or, version of record, if you wish to cite this item you are advised to consult the publisher’s version. Please see the ‘permanent WRAP url’ above for details on accessing the published version and note that access may require a subscription.
1
Revised structural phase diagram of
(Ba0.7Ca0.3TiO3)-(BaZr0.2Ti0.8O3)
Dean S. Keeble,a Feres Benabdallah,b Pam A. Thomas,a Mario Maglioneb and Jens Kreisel.a,c
a. Department of Physics, University of Warwick, Coventry CV4 7AL (UK).
b. ICMCB, Université de Bordeaux, CNRS,33600 Pessac (France)
c. Department Science and Analysis of Materials, CRP Gabriel Lippmann, Belvaux (Luxembourg)
The temperature-composition phase diagram of barium calcium titanate zirconate, (x(Ba0.7Ca0.3TiO3)
-(1-x)(BaZr0.2Ti0.8O3); BCTZ) has been reinvestigated using high-resolution synchrotron x-ray powder
diffraction. Contrary to previous reports of an unusual rhombohedral-tetragonal phase transition in
this system, we have observed an intermediate orthorhombic phase, isostructural to that present in
the parent phase, BaTiO3, and we identify the previously assigned T-R transition as a T-O transition.
We also observe the O-R transition coalescing with the previously observed triple point, forming a
phase convergence region. The implication of the orthorhombic phase in reconciling the exceptional
piezoelectric properties with the surrounding phase diagram is discussed.
Lead oxide based ferroelectric materials such as lead zirconate titanate (PbZr1-xTixO3, PZT) are the
most widely used piezoelectrics, because of their excellent properties. The microstructural origin of
the remarkable piezoelectric properties remained puzzling for several decades, it was quickly
recognized however that the complex structural phase diagram was key. In particular, it has been
recognized that piezoelectric properties are maximized close to the structural phase transition from
rhombohedral (R) to tetragonal (T) phases, which exists in a limited range of chemical composition:
2
crystallographic group–subgroup relationship, and thus no continuous transition between them is
possible. A breakthrough in the understanding of the remarkable piezoelectric properties of PZT was
achieved by showing that the strong piezoelectric properties of these solid solutions can be
interpreted via a ‘polarisation rotation’ between the adjacent R- and T-phases through one (or
more) intermediate monoclinic phases2, 3. Subsequent work on other lead-containing piezoelectrics
such as PMN-PT or PZN-PT has further underlined the need for knowledge of structural phase
diagrams for both the understanding of remarkable properties, and the design of new improved
piezoelectrics (see reviews 4-7).
In recent years, the environmental and health hazards of lead have been recognized, so that
recycling and disposal of devices containing lead-based piezoelectric materials became of great
concern. As a consequence, there is an increasing interest in the development of lead-free
piezoelectric materials8-13 with the main challenge to develop materials with an equivalent or even
higher piezoelectric response than the lead-based materials. Within this context, recent reports14 of
a high piezoelectric coefficient d33 of 620 pC/N in the lead-free solid solution
0.5(BaZr0.2Ti0.8O3)-0.5(Ba0.7Ca0.3TiO3)—albeit in a small temperature range—have attracted a significant research
interest, as this value exceeds even the d33 of soft PZT. This result has motivated further
investigations of the whole solid solution x(Ba0.7Ca0.3TiO3) -(1-x)(BaZr0.2Ti0.8O3) - abbreviated to BCTZ
- on both ceramics and thin film samples (e.g. 15-20). The first structural phase diagram of BCTZ has
been reported14 and the different phase sequences with increasing temperature can be summarized
as follows: (i) x ≤ 0.32: a single phase transition is observed from the low temperature R-phase to the
high-temperature prototype cubic ̅ structure (C), (ii) 0.32 < x < 0.8 : presence of two phase
transitions through a R-T-C phase sequence and (iii) x > 0.8: a single phase transition from a T-phase
to the C-phase. In-between (i) and (ii) the phase diagram was proposed to pass through a triple
point, where three first-order phase transitions (C-T, C-R, and T-R) coincide and where the highest
3
solutions such as BaTi1-xBxO3 (B = Zr, Ce, Hf) it appears that the suggested R-C phase sequence is
common to highly doped BTO-based materials, while the R-T-C sequence is unusual.8, 21
The aim of this work is to re-investigate the structural phase diagram of BCTZ, motivated by both the
known importance of the structural phase diagram for understanding piezoelectrics and the
uncommon nature of the R-T-C phase sequence reported previously. We are specifically interested
in investigating the R-T sequence and to verify the potential presence of 1) an intermediate
orthorhombic O-phase as in BaTiO3-based materials; 2) a bridging M-phase as in PZT; 3) long-range
octahedral tilts, which might be introduced by the Ca-substitution, knowing that CaTiO3 manifests
strong tilt instabilities. Structural distortions of perovskites are often subtle and difficult to detect, so
we have chosen to use high-resolution powder diffraction experiments at a synchrotron source with
small temperature steps to investigate four chemical compositions around the triple point.
Polycrystalline BCTZx (with compositions 20%, 32%, 40% and 50%) were synthesised by a
conventional solid state reaction technique. Raw materials with stoichiometric fractions of BaCO3
(99.95%), TiO2 (99.9%), CaCO3 (99.5%), and ZrO2 (99.99%) were mixed and ground by ball milling for
2 h with the addition of alcohol. After drying, the powder mixtures were calcined at 1350 °C for 15 h
in an oxygen atmosphere. All compositions were checked using standard XRD, SEM and X-ray
microprobe to ensure phase purity and appropriate chemical content.
Powder diffraction was performed on the high-resolution powder diffraction beamline ID31 at the
European Synchrotron Radiation Facility, Grenoble, France. The sample was packed into a 0.4mm
diameter capillary, and spun at a rate of 20 Hz to remove preferred orientation effects. Photons of
wavelength 0.35419(1) Å (E = 35.005(3) keV) were used and the diffracted intensities were collected
using a multianalyser detector bank22. Rietveld refinements of the collected patterns were
4
The ceramics used for the dielectric measurements were made from the same powders used for the
above X-ray investigation. The sintered pellets had relative density above 92%, diameter of 8mm and
thickness of 1mm. The major faces were gold-electroded and set in a homemade temperature cell
under a dry helium atmosphere: this is critical to avoid moisture condensation on the samples and
the formation of ice on cycling through the ice point.
Before powder patterns suitable for Rietveld refinement were taken, a “snapshot” of the thermal
variation of the whole pattern was collected. This procedure took advantage of the ability of the
beamline apparatus to collect a sizeable pattern (~16° 2, comparable information content to a 100°
2 pattern using CuKα radiation) in seconds. Patterns were collected continuously whilst the
temperature was ramped from 80 to 450 K, with each pattern covering around 2 K. When visualised
as suitably-cropped contour plots, these collections yield an overview of the thermal development of
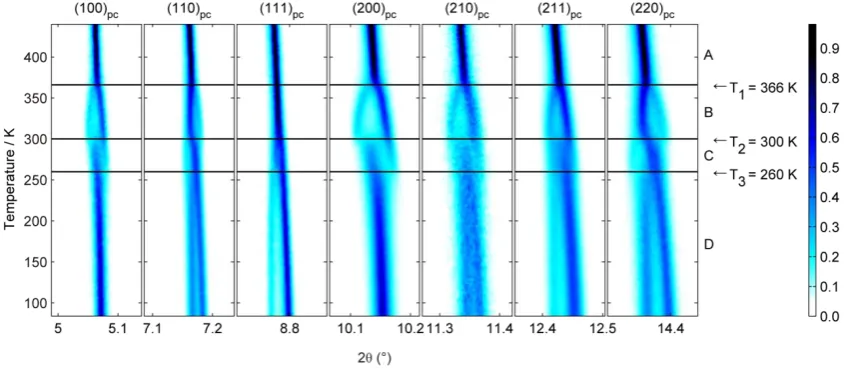
the structure. This plot for BCTZ50 is shown in Figure 1 where a total of three phase transitions are
observed in the temperature range studied. Furthermore, from the splitting of the peaks we can
suggest crystal systems for the four phases present. Phase A: In the high temperature phase,
denoted A in Figure 1, all of the pseudo-cubic peaks are singlets, strongly suggesting cubic
symmetry. Phase B: the splitting of the (100)pc into a doublet and the continuation of the (111)pc as a
singlet suggests a pseudo-cubic tetragonal symmetry. Phase C: As the (111)pc is now split, and the
(100)pc remains split, we can suggest that the lattice is no longer pseudo-cubic. Instead, the splitting
of the peaks is consistent with an √ √ orthorhombic supercell. Phase D: The
resingularization of the (100)pc peak infers a return to a pseudo-cubic unit cell, and the
large splitting of the (111)pc peak suggests a rhombohedral crystal lattice. This phase transition
sequence (Cubic-Tetragonal-Orthorhombic-Rhombohedral) is identical to that of the parent phase of
the system, BaTiO3.
This sequence, however, depends on the chemical compositions of BCTZ, as illustrated by
5
can be seen that BCTZ40 presents a similar phase sequence to BCTZ50, while BCTZ20 and BCTZ32
undergo only one phase transition. The splitting of the pseudo-cubic Bragg peaks in these materials
is consistent with the low temperature rhombohedral structure of BCTZ50 and—indeed BaTiO3—
suggesting a direct transformation from the high temperature cubic phase to the low temperature
rhombohedral phase. We note that no extra reflections consistent with octahedral tilting are
observed in any pattern in the current study. We therefore conclude that despite the introduction of
the small Ca2+ cation, no long-range octahedral tilts are introduced to the structure.
To confirm the succession of 3 phase transitions for compositions beyond BCTZ32, we reconsidered
the published dielectric data for BCTZ32 and BCTZ50 (ref 16) and we undertook further investigations
of BCTZ20 and BCTZ40. In our earlier work16 and other reports14, 15, dielectric and elastic experiments
did show the succession of 3 phase transitions for BCTZ50, while a single transition was observed for
BCTZ32. Despite being of low amplitude, the third transition (assigned above as R-O) did also appear
in the dielectric data of Liu and Ren14 for BCTZ50, although it was not considered as such. Our
previous pyroelectric experiments made this third transition in BCTZ50 unquestionable16: this is
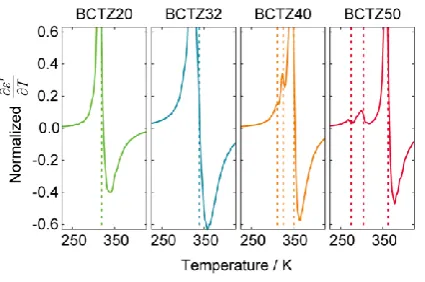
readily seen in Figure 3 where ⁄ is plotted for the 4 compositions. This shows that the single
transition at low content (BCTZ20 and BCTZ32) is separated from the succession of 3 transitions in
the high composition range (BCTZ40 and BCTZ50) by a small region of phase space. Since the Gibbs
phase rule prohibits a single four-phase invariant point in a pseudo-binary phase diagram, we refer
to this non-point-like region as a phase convergence region. The temperatures at which the dielectric
anomalies are recorded are also in full agreement with the above structural investigations.
Why the two intermediate phases (O+T) both disappear at very similar compositions (in the phase
convergence region), both in the current BCTZ solid solution and in the binary BZT, is an interesting
question. Since both phases exist due to competing A- and B-site polar instabilities, leading to a
reduction of the number of Ti4+ (111)pc displacements from 8 (cubic) to 4 to 2 to 1 (rhombohedral) as
6
although at no point degenerate. The addition of other species into the BTO structure does not
change the overriding nature of the Ti4+ to displace in (111)pc directions, but it does interfere with
the delicate balance of forces required to stabilise the intermediate tetragonal (4 sites) and
orthorhombic (2 sites) phases.
In order to confirm the suggested phase sequences and to assign a space group to the individual
phase, full Rietveld refinements were performed on powder patterns collected for significantly
longer times. The space groups of the phases of BaTiO3 were used as an initial basis for the
refinements, and in all the phases, these space groups (or mixtures thereof near transitions) yielded
good fits to the data. Since there was no evidence to suggest lower space-group symmetry (such as
tilt peaks or unexplained splitting) these space groups were accepted as correct. In all phases of all
compositions studied, anisotropic peak widths were observed and were accounted for in the model
by applying the corrections of Stephens25. Rietveld refinements confirm that the phase sequence
observed in BCTZ50 and BCTZ40 is identical to that observed in BaTiO3: i.e. ̅
. An example of an orthorhombic refinement and indicative fits of BCTZ50 at all
temperatures is shown in Figure 4 (ref. 26). As is decreased further from BCTZ40 to BCTZ32 and
beyond, we observe that the two intermediate phases and are suppressed and the
three transitions coalesce to form one “pinched” transition directly from the low temperature
phase to the high temperature ̅ phase. This “pinching” of the transition (and the
introduction of relaxor behaviour beyond27) is also seen in other BaTiO3 based solid-solutions, and in
the Ba(Ti,Zr)O3 system in particular. In this system, the pinching of the transitions is driven by the
competing elastic fields28 of the different sized titanium and zirconium cations, and occurs when
Zr/(Ti + Zr) reaches ~0.15. (ref. 29) In the current solid-solution we observe the pinching occurring
between the BCTZ32 and BCTZ40 compositions, corresponding to 0.12 < Zr/(Ti + Zr) < 0.136.
This is a small yet significant compositional difference, and so we can infer an effect of the Ca
7
at a composition of Zr = 0.15 in BTZ, one would expect it to occur in BCTZ25 (which equates to Zr = 0.15 as in BTZ). As we observe the phase convergence at a lower Zr content, we conclude that the Ca
substitution destabilises the intermediate BaTiO3 structures further. This is likely due to the
underlying and competing tilt instabilities induced by CTO, so that less Zr doping is needed to
destabilise them completely and induce the single R-C transition.
In summary, we have observed an orthorhombic phase in the BCTZ system, which now makes the
phase sequence (from low to high temperature) R-O-T-C for higher BCTZ compositions (Figure 5(a)).
This is identical, both in sequence and in space group symmetry, to that of the parent phase of the
system, BaTiO3. Overall, this is to be expected: the addition of zirconium to BaTiO3 destabilises
tetragonal and orthorhombic phases, forcing the rhombohedral phase up to the Curie point, whilst
the addition of calcium stabilises the tetragonal phase down to low temperature30. Since the two
ends of the BCTZ phase diagram reported here are BaTi0.8Zr0.2O3 (BTZ20 BCTZ0) and Ba0.7Ca0.3TiO3
(BCT30 BCTZ100), one can think of the BCTZ solid solution as a way of traversing from BCT to BTZ
without having to go via BTO as an intermediate. In so doing, the rate of change of instability with
composition (hereafter referred to as the “instability gradient”) is increased, manufacturing a more
vertical phase boundary, much like that observed in an MPB. To emphasise this effect, the three
dimensional phase diagram (the BTO-BCT30-BTZ20 triangle vs. T) is shown in Figure 5(b):
circumventing BTO in going from BCT30 to BTZ20 can clearly be seen to increase the instability
gradient. This quasi-stable region, a direct consequence of the high instability gradient, increases the
degrees of freedom available to the system, and corresponds to a strongly degenerate free energy
landscape. This degeneracy could enhance the extreme piezoelectric coefficients in this composition
range15. Given the small dielectric anomaly associated with this third transition, and the high
instability gradient associated with the orthorhombic phase, it is understandable why its existence
has been unobserved until now: particularly given that the previous transition sequence was
assigned solely on the basis of dielectric data. In spite of its small dielectric anomaly, and small phase
8
One may consult the ternary phase diagram and try to manufacture an even greater instability
gradient, by altering the end members of the solid-solution. Increasing the Zr content further in the
BTZ end-member actually drives TC at that end if the solid-solution down, reducing the instability
gradient. However, the addition of more Ca to the BCT end-member could enhance the properties
further: by using BCT40 the tetragonal phase is even more stabilised at that end of the phase
diagram, and an even larger instability gradient could be observed around the phase convergence
region.
Acknowledgements
We would like to thank A. Fitch for his help with the synchrotron data collection. JK acknowledges
financial support during his sabbatical stay at Warwick University from the Institute of Advanced
Study (IAS) Warwick and from the Région Rhône-Alpes (CMIRA grant). DSK thanks the Science City
[image:9.595.86.513.467.654.2]Research Alliance and the HEFCE Strategic Development Fund for financial support.
Figure 1 - BCTZ50 "snapshot". Normalised contour maps showing the evolution of the first 7 pseudo-cubic peaks with
temperature for BCTZ50. Three distinct phase transitions are observed (black lines), suggesting four distinct phases
9
Figure 2 - Comparison of the normalised (220)pc peak in the four compositions studied in the present work. The three
phase transitions observed in BCTZ50 are “pinched” together as x is decreased, until in BCTZ32 (and below) only one
transition remains. The temperature of this initial cubic-symmetry breaking transition also increases monotonically with
x.
Figure 3 - Derivative of the relative real part of the dielectric permittivity versus temperature for the BCTZ compositions
under investigation. The operating frequency was 10 kHz. The lines indicate transitions, the temperatures of which
[image:10.595.193.406.382.523.2]10
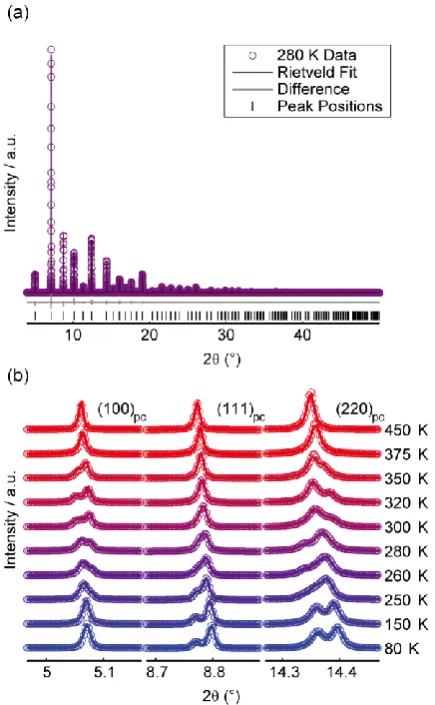
Figure 4 – Rietveld refinements of BCTZ50. (a) Whole pattern refinement fit of the 280 K data using an orthorhombic
structure; (b) Variable temperature Rietveld fits for the (100)pc, (111)pc (× 0.5), and (220)pc reflections in BCTZ50.
11
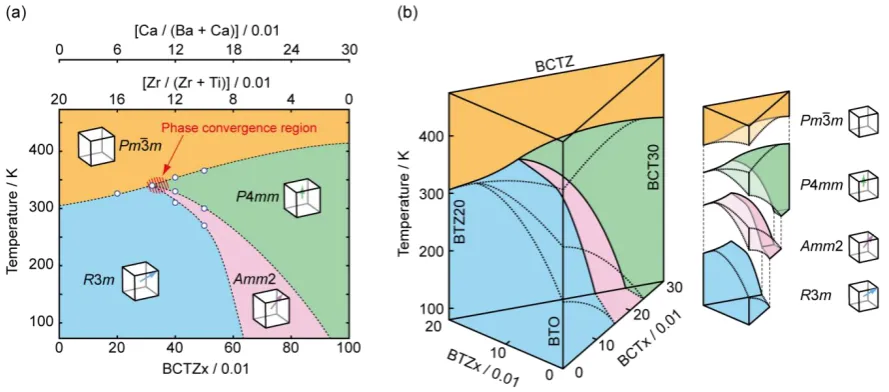
Figure 5 – Phase diagrams of BTO solid-solutions (a) Suggested phase diagram of BCTZ based on the current study. In
contrast to the previous work of Liu (see Ref 14), we observe the orthorhombic Amm2 phase persisting all the way to
the phase convergence region. (b) 3D phase diagram of BCTZ, showing how the two binary BTZ and BCT phases combine
to form the ternary BCTZ, including an exploded view emphasising the connectivity of the phases. This 3D
representation highlights the formation of the high instability gradient: in traversing from the left edge (BTZ20) to the
right edge (BCT30) via the parent phase BTO, the elimination of the Zr-induced pinching of the transitions and the
introduction of the Ca-induced stabilisation of the tetragonal phase occur sequentially. However, in traversing from
BTZ20 to BCT30 directly, these two effects occur simultaneously, manufacturing the larger instability gradient.
References
1
M. E. Lines and A. M. Glass, Principles and Applications of Ferroelectrics (Clarendon Press, Oxford, 1977).
2
B. Noheda, D. E. Cox, G. Shirane, J. A. Gonzalo, L. E. Cross, and S. E. Park, Applied Physics Letters 74, 2059 (1999).
3
B. Noheda, J. A. Gonzalo, L. E. Cross, R. Guo, S. E. Park, D. E. Cox, and G. Shirane, Physical Review B (Condensed Matter) 61, 8687 (2000).
4
D. E. Cox, B. Noheda, G. Shirane, Y. Uesu, K. Fujishiro, and Y. Yamada, Applied Physics Letters
79, 400 (2001). 5
B. Noheda, Current Opinion in Solid State & Materials Science 6, 27 (2002). 6
B. Noheda and D. E. Cox, Phase Transitions 79, 5 (2006). 7
M. Davis, Journal of Electroceramics 19, 25 (2007). 8
12 9
T. Takenaka and H. Nagata, Key Engineering Materials 157, 57 (1999). 10
M. D. Maede, D. Damjanovic, and N. Setter, J. Electroceram. 13, 395 (2004). 11
Y. Saito, H. Takao, T. Tani, K. Nonoyama, K. Takatori, T. Homma, T. Nagaya, and M. Nakamura, Nature 432, 84 (2004).
12
T. R. Shrout and S. J. Zhang, J. Electroceram. 19, 113 (2007). 13
J. Rodel, W. Jo, K. T. P. Seifert, E. M. Anton, T. Granzow, and D. Damjanovic, Journal of the American Ceramic Society 92, 1153 (2009).
14
W. Liu and X. Ren, Physical Review Letters 103, 257602 (2009). 15
D. Damjanovic, A. Biancoli, L. Batooli, A. Vahabzadeh, and J. Trodahl, Applied Physics Letters
100, 192907 (2012). 16
F. Benabdallah, A. Simon, H. Khemakhem, C. Elissalde, and M. Maglione, Journal of Applied Physics 109, 124116 (2011).
17
A. Piorra, A. Petraru, H. Kohlstedt, M. Wuttig, and E. Quandt, Journal of Applied Physics 109, 104101 (2011).
18
V. S. Puli, A. Kumar, D. B. Chrisey, M. Tomozawa, J. F. Scott, and R. S. Katiyar, Journal of Physics D: Applied Physics 44, 395403 (2011).
19
J. Gao, et al., Applied Physics Letters 99, 092901 (2011).
20 D. Xue, Y. Zhou, H. Bao, C. Zhou, J. Gao, and X. Ren, Journal of Applied Physics 109, 054110 (2011).
21
A. Simon, J. Ravez, and M. Maglione, Journal of Physics: Condensed Matter 16, 963 (2004). 22
J. L. Hodeau, P. Bordet, M. Anne, A. Prat, A. N. Fitch, E. Dooryhee, G. Vaughan, and A. Freund, in Conference on Crystal amd Multilayer Optics, San Diego, Ca, 1998).
23
A. A. Coelho, (Coelho Software, 2007). 24
B. Ravel, E. A. Stern, R. I. Vedrinskii, and V. Kraizman, Ferroelectrics 206, 407 (1998). 25
P. W. Stephens, Journal of Applied Crystallography 32, 281 (1999). 26
See supplementary material at (URL) for full Rietveld refinement fits of all compositions studied.
27
A. R. Akbarzadeh, S. Prosandeev, E. J. Walter, A. Al-Barakaty, and L. Bellaiche, Physical Review Letters 108, 5 (2012).
28
C. Laulhe, A. Pasturel, F. Hippert, and J. Kreisel, Physical Review B 82 (2010). 29
T. Maiti, R. Guo, and A. S. Bhalla, Journal of the American Ceramic Society 91 (2008). 30