2-Cyano-1-methylpyridinium iodide
Michael N. Kammer,aLynn V. Koplitzband Joel T. Maguec*
a
Department of Physics, Loyola University, New Orleans, LA 70118, USA,
b
Department of Chemistry, Loyola University, New Orleans, LA 70118, USA, and
cDepartment of Chemistry, Tulane University, New Orleans, LA 70118, USA
Correspondence e-mail: [email protected]
Received 11 July 2013; accepted 12 July 2013
Key indicators: single-crystal X-ray study;T= 100 K; mean(C–C) = 0.008 A˚; Rfactor = 0.036;wRfactor = 0.091; data-to-parameter ratio = 574.1.
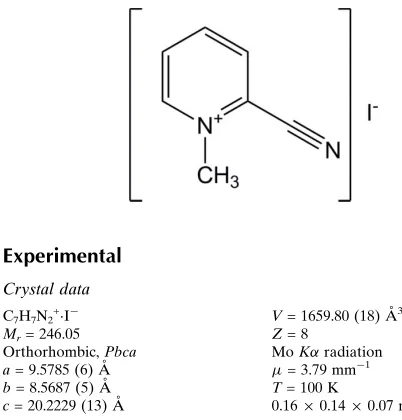
The cation in the title compound, C7H7N2+I
, is planar (r.m.s. deviation for the nine fitted non-H atoms = 0.040 A˚ ). The crystal packing is best described as undulating layers of cations and anions associatedviaC—H I interactions.
Related literature
For the structure of 2-cyano-N-methylpyridinium nitrate, see: Koplitz et al. (2012). For structures of 3-cyano-N -methyl-pyridinium salts, see: Koplitzet al.(2003); Magueet al.(2005). For structures of 4-cyano-N-methylpyridinium salts, see: Kammer, Koplitz & Mague (2012); Kammer, Mague & Koplitz (2012).
Experimental
Crystal data
C7H7N2+I
Mr= 246.05
Orthorhombic,Pbca a= 9.5785 (6) A˚
b= 8.5687 (5) A˚
c= 20.2229 (13) A˚
V= 1659.80 (18) A˚3
Z= 8
MoKradiation
= 3.79 mm1
T= 100 K
0.160.140.07 mm
Bruker SMART APEX CCD diffractometer
Absorption correction: multi-scan (TWINABS; Sheldrick, 2009)
Tmin= 0.58,Tmax= 0.77
58292 measured reflections 53390 independent reflections 40858 reflections withI> 2(I)
Rint= 0.047
Refinement
R[F2> 2(F2)] = 0.036
wR(F2) = 0.091
S= 1.03 53390 reflections
93 parameters
H-atom parameters constrained max= 1.14 e A˚
3
min=0.43 e A˚
[image:1.610.44.245.475.685.2]3
Table 1
Hydrogen-bond geometry (A˚ ,).
D—H A D—H H A D A D—H A
C1—H1B I1i 0.98 3.20 4.014 (5) 141 C1—H1C I1ii
0.98 3.11 4.021 (5) 156 C5—H5 I1iii
0.95 3.12 3.810 (5) 131 C6—H6 I1iv 0.95 3.03 3.677 (5) 126
Symmetry codes: (i)xþ3
2;yþ12;z; (ii)xþ12;yþ1;zþ12; (iii)xþ12;yþ32;z; (iv) xþ1;yþ1;z.
Data collection:APEX2(Bruker, 2013); cell refinement:SAINT (Bruker, 2013); data reduction:SAINT; program(s) used to solve structure:SHELXTL (Sheldrick, 2008b); program(s) used to refine structure: SHELXL2013 (Sheldrick, 2013); molecular graphics: DIAMOND(Brandenburg & Putz, 2012); software used to prepare material for publication: SHELXTL and CELL_NOW (Sheldrick, 2008b).
We thank the Chemistry Department of Tulane University for support of the X-ray laboratory and the Louisiana Board of Regents through the Louisiana Educational Quality Support Fund (Grant LEQSF (2003–2003)-ENH–TR-67) for the purchase of theAPEXdiffractometer. Michael Kammer was supported by Louisiana Board of Regents grant LEQSF(2007–12)-ENH-PKSFI-PES-03 during the summer of 2011.
Supplementary data and figures for this paper are available from the IUCr electronic archives (Reference: TK5240).
References
Brandenburg, K. & Putz, H. (2012).DIAMOND. Crystal Impact GbR, Bonn, Germany.
Bruker (2013).APEX2andSAINT. Bruker AXS Inc., Madison, Wisconsin, USA.
Kammer, M. N., Koplitz, L. V. & Mague, J. T. (2012).Acta Cryst.E68, o2514. Kammer, M. N., Mague, J. T. & Koplitz, L. V. (2012).Acta Cryst.E68, o2409. Koplitz, L. V., Bay, K. D., DiGiovanni, N. & Mague, J. T. (2003).J. Chem.
Crystallogr.33, 391–402.
Koplitz, L. V., Mague, J. T., Kammer, M. N., McCormick, C. A., Renfro, H. E. & Vumbaco, D. J. (2012).Acta Cryst.E68, o1653.
Mague, J. T., Ivie, R. M., Hartsock, R. W., Koplitz, L. V. & Spulak, M. (2005).
Acta Cryst.E61, o851–o853.
Sheldrick, G. M. (2008a).CELL_NOW. University of Go¨ttingen, Germany. Sheldrick, G. M. (2008b).Acta Cryst.A64, 112–122.
Sheldrick, G. M. (2009).TWINABS. University of Go¨ttingen, Germany. Sheldrick, G. M. (2013).SHELXL2013. University of Go¨ttingen, Go¨ttingen,
Germany.
Structure Reports Online
supporting information
Acta Cryst. (2013). E69, o1281 [doi:10.1107/S1600536813019302]
2-Cyano-1-methylpyridinium iodide
Michael N. Kammer, Lynn V. Koplitz and Joel T. Mague
S1. Comment
The three-dimensional, solid state structures of the salts of the three isomeric cyano-N-methylpyridinium cations are quite
varied. These range from layered structures as seen in the chloride and bromide salts of the 3-cyano-N-methyl pyridinium
cation (Koplitz, et al., 2003; Mague, et al., 2005) and in 2-cyano-N– methylpyridinium nitrate (Koplitz, et al., 2012)
through an open channel structure for 3-cyano-N-methyl pyridinium iodide (Koplitz, et al., 2003) to complex networks as
found for 4-cyano-N-methylpyridinium bromide and iodide (Kammer, Mague & Koplitz, 2012; Kammer, Koplitz &
Mague, 2012). In all instances, the packing appears to be organized by weak C—H to anion hydrogen bonding and, in the
case of 2-cyano-N-methylpyridinium nitrate, an anion–π interaction although we have yet to discern a pattern based on
either the position of the cyano group on the ring or the size or shape of the anion. In the title compound, the packing of
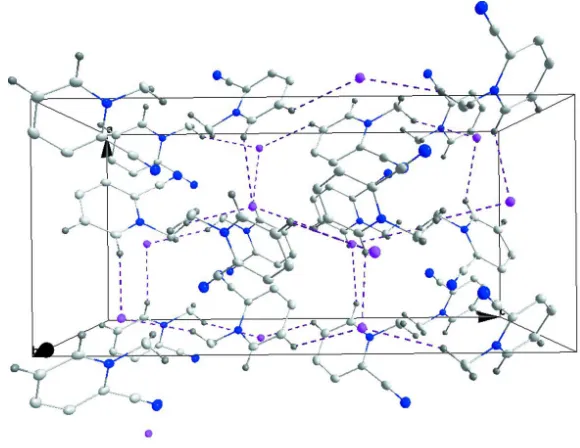
the cations and anions is organized by weak C—H···I hydrogen bonding (Table 1). It can be described as "wavy" layers
extending parallel to c. Fig. 2 presents a side view of the layers while Fig. 3 is a top view. From both of these, it is evident
that the weak interionic interactions organize a three-dimensional network which is intermediate in complexity between
those seen for 3-cyano-N-methylpyridinium iodide and 4-cyano-N-methylpyridinium bromide.
S2. Experimental
2-Cyanopyridine (10.5 g) was first melted in a warm water bath and then dissolved in benzene (40 ml). Iodomethane (9.5
ml) was added to this solution slowly with stirring and the solution was refluxed for 2 h. Yellow solid 2-cyano-N-methyl
pyridinium iodide (m.p. 419–423 K) was collected by vacuum filtration.
S3. Refinement
The diffraction data were obtained from 3 sets of 400 frames, each of width 0.5° in ω, collected at φ = 0.00, 90.00 and
180.00° and 2 sets of 800 frames, each of width 0.45° in φ, collected at ω = -30.00 and 210.00°. The scan time was 15
sec/frame. Analysis of 1649 reflections having I/σ(I) > 15 and chosen from the full data set with CELL_NOW (Sheldrick,
2008a) showed the crystal to belong to the orthorhombic system and to be twinned by a 180 ° rotation about c. The raw
data were processed using the multi-component version of SAINT under control of the two-component orientation file
generated by CELL_NOW. The model was refined as a two-component twin which, although giving somewhat higher
values for R1 and wR2 and the residual peaks in the final difference map than refinement as 1-component using the single
component reflection file extracted from the full data set with TWINABS, provided a more reasonable suggested
weighting scheme. H-atoms attached to carbon were placed in calculated positions (C—H = 0.95 - 0.98 Å). All were
included as riding contributions with isotropic displacement parameters 1.2 - 1.5 times those of the attached atoms. The
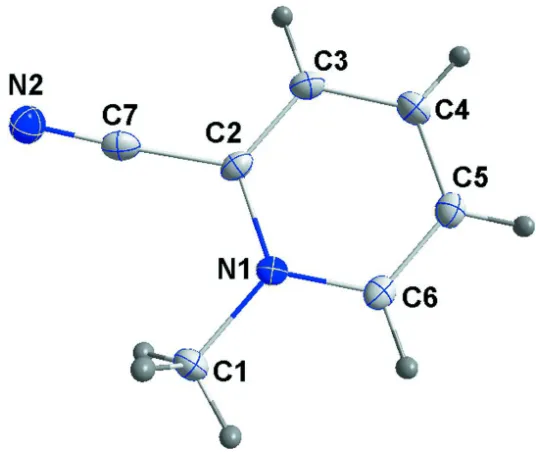
Figure 1
Perspective view of the title compound with 50% probability ellipsoids.
Figure 2
[image:3.610.130.471.408.633.2]Figure 3
Packing projected down b showing the top view of the layers.
2-Cyano-1-methylpyridinium iodide
Crystal data
C7H7N2+·I−
Mr = 246.05
Orthorhombic, Pbca a = 9.5785 (6) Å
b = 8.5687 (5) Å
c = 20.2229 (13) Å
V = 1659.80 (18) Å3
Z = 8
F(000) = 928
Dx = 1.969 Mg m−3 Melting point: 146 K
Mo Kα radiation, λ = 0.71073 Å Cell parameters from 4287 reflections
θ = 2.9–28.7°
µ = 3.79 mm−1
T = 100 K Slab, yellow
0.16 × 0.14 × 0.07 mm
Data collection
Bruker SMART APEX CCD diffractometer
Radiation source: fine-focus sealed tube Graphite monochromator
Detector resolution: 8.3660 pixels mm-1
φ and ω scans
Absorption correction: multi-scan (TWINABS; Sheldrick, 2009)
Tmin = 0.58, Tmax = 0.77
58292 measured reflections 53390 independent reflections 40858 reflections with I > 2σ(I)
Rint = 0.047
θmax = 28.7°, θmin = 2.0°
h = −12→12
k = −11→11
l = −26→27
Refinement
Refinement on F2 Least-squares matrix: full
neighbouring sites
H-atom parameters constrained
where P = (Fo2 + 2Fc2)/3 (Δ/σ)max < 0.001
Δρmax = 1.14 e Å−3 Δρmin = −0.43 e Å−3
Special details
Geometry. All e.s.d.'s (except the e.s.d. in the dihedral angle between two l.s. planes) are estimated using the full covariance matrix. The cell e.s.d.'s are taken into account individually in the estimation of e.s.d.'s in distances, angles and torsion angles; correlations between e.s.d.'s in cell parameters are only used when they are defined by crystal symmetry. An approximate (isotropic) treatment of cell e.s.d.'s is used for estimating e.s.d.'s involving l.s. planes.
Fractional atomic coordinates and isotropic or equivalent isotropic displacement parameters (Å2)
x y z Uiso*/Ueq
I1 0.41161 (3) 0.07802 (3) 0.10870 (2) 0.01550 (12)
N1 0.9765 (4) 1.0275 (5) 0.1442 (2) 0.0135 (9)
N2 0.7422 (4) 0.7530 (5) 0.2022 (2) 0.0205 (10)
C1 1.0446 (5) 0.9818 (6) 0.2072 (3) 0.0187 (11)
H1A 1.1337 1.0371 0.2116 0.028*
H1B 1.0615 0.8690 0.2072 0.028*
H1C 0.9837 1.0092 0.2443 0.028*
C2 0.8562 (5) 0.9559 (6) 0.1244 (3) 0.0142 (10)
C3 0.7917 (5) 0.9967 (6) 0.0661 (3) 0.0158 (11)
H3 0.7074 0.9471 0.0530 0.019*
C4 0.8517 (5) 1.1118 (6) 0.0268 (3) 0.0168 (11)
H4 0.8105 1.1395 −0.0143 0.020*
C5 0.9713 (5) 1.1848 (6) 0.0481 (3) 0.0166 (11)
H5 1.0122 1.2648 0.0220 0.020*
C6 1.0321 (5) 1.1424 (5) 0.1070 (3) 0.0149 (10)
H6 1.1140 1.1945 0.1216 0.018*
C7 0.7957 (5) 0.8415 (6) 0.1685 (3) 0.0165 (11)
Atomic displacement parameters (Å2)
U11 U22 U33 U12 U13 U23
I1 0.01513 (19) 0.01697 (18) 0.01439 (19) 0.00131 (12) −0.00021 (13) −0.00058 (13) N1 0.013 (2) 0.014 (2) 0.014 (2) 0.0017 (16) 0.0001 (18) −0.0019 (17)
N2 0.022 (2) 0.020 (2) 0.019 (2) −0.0019 (19) 0.001 (2) −0.0010 (19)
C1 0.020 (3) 0.022 (3) 0.014 (3) −0.001 (2) −0.004 (2) 0.001 (2)
C2 0.012 (2) 0.014 (2) 0.016 (3) −0.0010 (19) 0.003 (2) −0.003 (2)
C3 0.013 (3) 0.016 (2) 0.018 (3) 0.0006 (19) 0.000 (2) −0.003 (2)
C4 0.019 (3) 0.017 (2) 0.014 (3) 0.004 (2) −0.001 (2) −0.002 (2)
C5 0.017 (3) 0.014 (2) 0.020 (3) 0.0014 (19) 0.003 (2) 0.000 (2)
C6 0.012 (2) 0.011 (2) 0.021 (3) 0.0023 (18) 0.003 (2) −0.002 (2)
Geometric parameters (Å, º)
N1—C6 1.348 (6) C2—C7 1.446 (7)
N1—C2 1.366 (6) C3—C4 1.391 (7)
N1—C1 1.484 (6) C3—H3 0.9500
N2—C7 1.141 (6) C4—C5 1.375 (7)
C1—H1A 0.9800 C4—H4 0.9500
C1—H1B 0.9800 C5—C6 1.375 (7)
C1—H1C 0.9800 C5—H5 0.9500
C2—C3 1.375 (7) C6—H6 0.9500
C6—N1—C2 119.8 (4) C2—C3—H3 120.5
C6—N1—C1 119.9 (4) C4—C3—H3 120.5
C2—N1—C1 120.3 (4) C5—C4—C3 119.1 (5)
N1—C1—H1A 109.5 C5—C4—H4 120.4
N1—C1—H1B 109.5 C3—C4—H4 120.4
H1A—C1—H1B 109.5 C6—C5—C4 120.3 (5)
N1—C1—H1C 109.5 C6—C5—H5 119.8
H1A—C1—H1C 109.5 C4—C5—H5 119.8
H1B—C1—H1C 109.5 N1—C6—C5 120.6 (5)
N1—C2—C3 121.1 (4) N1—C6—H6 119.7
N1—C2—C7 117.5 (4) C5—C6—H6 119.7
C3—C2—C7 121.4 (5) N2—C7—C2 176.9 (6)
C2—C3—C4 119.0 (5)
C6—N1—C2—C3 1.3 (7) C2—C3—C4—C5 −2.0 (7)
C1—N1—C2—C3 −180.0 (5) C3—C4—C5—C6 1.2 (7)
C6—N1—C2—C7 −175.6 (4) C2—N1—C6—C5 −2.2 (7)
C1—N1—C2—C7 3.1 (7) C1—N1—C6—C5 179.1 (4)
N1—C2—C3—C4 0.7 (7) C4—C5—C6—N1 0.9 (7)
C7—C2—C3—C4 177.5 (5)
Hydrogen-bond geometry (Å, º)
D—H···A D—H H···A D···A D—H···A
C1—H1B···I1i 0.98 3.20 4.014 (5) 141
C1—H1C···I1ii 0.98 3.11 4.021 (5) 156
C5—H5···I1iii 0.95 3.12 3.810 (5) 131
C6—H6···I1iv 0.95 3.03 3.677 (5) 126