warwick.ac.uk/lib-publications
Manuscript version: Author’s Accepted Manuscript
The version presented in WRAP is the author’s accepted manuscript and may differ from the
published version or Version of Record.
Persistent WRAP URL:
http://wrap.warwick.ac.uk/132085
How to cite:
Please refer to published version for the most recent bibliographic citation information.
If a published version is known of, the repository item page linked to above, will contain
details on accessing it.
Copyright and reuse:
The Warwick Research Archive Portal (WRAP) makes this work by researchers of the
University of Warwick available open access under the following conditions.
Copyright © and all moral rights to the version of the paper presented here belong to the
individual author(s) and/or other copyright owners. To the extent reasonable and
practicable the material made available in WRAP has been checked for eligibility before
being made available.
Copies of full items can be used for personal research or study, educational, or not-for-profit
purposes without prior permission or charge. Provided that the authors, title and full
bibliographic details are credited, a hyperlink and/or URL is given for the original metadata
page and the content is not changed in any way.
Publisher’s statement:
Please refer to the repository item page, publisher’s statement section, for further
information.
XXX-X-XXXX-XXXX-X/XX/$XX.00 ©20XX IEEE
Control-Oriented Implementation and Model Order
Reduction of a Lithium-Ion Battery Electrochemical
Model
Liuying Li
Modelling and Control Systems WMG, University of Warwick
Coventry, UK
Cheng Zhang
Faculty of Engineering Imperial College London
London, UK
James Marco
Energy and Electrical Systems WMG, University of Warwick
Coventry, UK
Widanalage D. Widanage
Modelling and Control Systems WMG, University of Warwick
Coventry, UK
Dhammika.Widanalage@warwic k.ac.uk
Abstract—The use of electrochemical models makes it
computationally intractable for online implementation as the model is subject to a complicated mathematical structure including partial-differential equations (PDE). This paper is based on the single particle model with electrolyte dynamics. Methods to solve the PDEs in the governing equations are given. Model order reduction techniques are applied to the electrochemical model to reduce the order from 350 to 14. The models solved by numerical solution, residue grouping method and balanced truncation method are compared with experimental data of a coin cell for validation. The results show that the reduced order model can increase simulation time 75 times compared with the high order model and 2.3% root mean square error with the experiment result.
Keywords—Lithium ion battery, single particle model with electrolyte, reduce order modeling, residue grouping, balance truncation.
I. INTRODUCTION
Electrochemical models of batteries are typically developed from first principles and aim to accurately capture the internal battery dynamics such as diffusion, intercalation kinetics, and electric potentials. Underpinned by such models, battery internal states or parameters can be better understood and manipulated by sophisticated estimation and control approaches. However, the use of electrochemical models makes it computationally intractable for online implementation as the model is subject to a complicated mathematical structure including partial-differential equations (PDE), ordinary-partial-differential equations (ODE) and algebraic equations. In order to devise a control-oriented model, to support real-time monitoring and control, model order reduction techniques, including residue grouping [1], balanced truncation [2], Padé approximation [3], can be used to reduce the model order while maintaining the desired level of accuracy. G.Fan in [4] compared some order reduction techniques applied to the solid-state diffusion. Although the above models have addressed the accuracy and development of reduced order models of Li-ion batteries, the implementation and comparison between different methods with real cell experiment data still need to be discussed.
This paper is based on the single particle model with electrolyte dynamics (SPMe). The PDEs in the governing
equation of the SPMe are solved by finite difference method (FDM) and finite element method (FEM). After solving the PDEs, the full order model would be high (e.g. 350th order). Model order reduction techniques are used to develop a low order Li-ion battery model derivate that is suitable for real-time implementation, for example within a battery control system. Residue grouping (RG) and balance truncation (BT) are order reduction techniques for high order systems. They are applied to the SPMe model to reduce the model order from 350 to 14.
Both the full order model (FOM) and the reduced order model (ROM) have been implemented within the commercially available software Matlab and SIMULINK.
II. SINGLE PARTICLE MODEL WITH ELECTROLYTE
[image:2.612.329.569.488.689.2]The SPMe model derived by Scott J. Moura in [5] is a simplification of the Newman model [6]. The schematic of the SPMe model is shown in Figure 1. The positive and negative electrodes are modelled with spherical particles surrounded by the electrolyte. The Li-ions intercalation and de-intercalation processes are performed through the surface area of these particles[7].
The SPMe is derived under several assumptions [5]. These assumptions ultimately render a model consisting of two diffusion PDEs for electrodes concentrations, one diffusion PDE for electrolyte concentrations, and a nonlinear output function about the surface concentration of the solid, the boundary concentration of the electrolyte, and the current (as shown in Fig. 2).
Fig. 2. Block diagram of SPMe [5].
The governing equations of SPMe are given in Table I. The nomenclatures can be found in Table II.
TABLE I. GOVERNING EQUATIONS
Governing Equations Eq.
No. 𝝏𝒄𝒔±
𝝏𝒕 (𝒓, 𝒕) = 𝟏 𝒓𝟐
𝝏 𝝏𝒓[𝑫𝒔
±𝒓𝟐𝝏𝒄𝒔±
𝝏𝒓(𝒓, 𝒕)]
(1)
𝝏𝒄𝒆 𝒋
𝝏𝒕(𝒙, 𝒕) = 𝝏 𝝏𝒙[
𝑫𝒆 𝒆𝒇𝒇
𝜺𝒆𝒋 𝝏𝒄𝒆
𝒋
𝝏𝒙(𝒙, 𝒕)] +̅ (𝟏 − 𝒕𝒄𝟎)
𝜺𝒆𝒋𝑭𝑳𝒋 𝑰(𝒕)
𝒋𝝐{−, 𝒔𝒆𝒑, +}𝑹𝒇−
(2)
𝜿𝒆𝒇𝒇𝝏𝝓𝒆±,𝒔
𝝏𝒙 (𝒙, 𝒕) = −𝒊𝒆
±(𝒙, 𝒕) +
𝜿𝒆𝒇𝒇(𝒄 𝒆) ∙
𝟐𝑹𝑻 𝑭 (𝟏 − 𝒕𝒄
𝟎) (𝟏 +𝒅 𝒍𝒏 𝒇𝒄/𝒂
𝒅 𝒍𝒏 𝒄𝒆
(𝒙, 𝒕))𝝏 𝒍𝒏 𝒄𝒆 𝝏𝒙 (𝒙, 𝒕)𝑹𝒇+
(3)
𝝏𝒊𝒆±
𝝏𝒙(𝒙, 𝒕) = 𝒂
±𝑭𝒋 𝒏
±(𝒙, 𝒕) (4)
𝒋𝒏±(𝒕) = +̅
𝑰(𝒕) 𝑭𝒂±𝑳±=
𝟏 𝑭𝒊𝟎
±(𝒕) [𝒆𝜶𝒂𝑭
𝑹𝑻 𝜼±(𝒕)− 𝒆− 𝜶𝒄𝑭
𝑹𝑻 𝜼±(𝒕)] (5)
𝒊𝟎±(𝒕) = 𝒌±[𝒄 𝒔𝒔
±(𝒕)] 𝜶𝒄× [𝒄
𝒆(𝒙, 𝒕) (𝒄𝒔,𝒎𝒂𝒙± − 𝒄𝒔𝒔±(𝒕))] 𝜶𝒂 (6)
𝜼±= 𝝓 𝒔 ±(𝒕) − 𝝓
𝒆(𝒙, 𝒕) − 𝑼±(𝒄𝒔𝒔±(𝒕)) − 𝑭𝑹𝒇±𝒋𝒏±(𝒕) (7)
TABLE II. NOMENCLATURE
Description Sym
bol
Unit
Lithium concentration in solid phase 𝒄𝒔± mol/m3 Lithium concentration in electrolyte phase 𝒄𝒆
𝒋 mol/m3
Solid electric potential 𝝓𝒔± V
Electrolyte electric potential 𝝓𝒆±,𝒔 V
Ionic current 𝒊𝒆± A/m2
Molar ion flux 𝒋𝒏± mol/m2-s
Exchange current density 𝒊𝟎± A/m
2
Overpotential 𝜼± V
Lithium concentration in solid phase at particle surface 𝒄𝒔𝒔± mol/m3
Apply current 𝐼 A/m2
Terminal voltage 𝑉 V
III. NUMERICAL SOLUTION OF PDES
To solve the governing equations, numerical methods such as the FDM and FEM can be applied on the diffusion PDE of the SPMe in the solid and electrolyte domains separately.
A. Finite-Difference Method
The principle of FDM is very similar to numerical methods used to solve ODEs. In this method the differential operator is approximated by replacing it with the derivatives in the equation using differential quotients [8].
Central difference of the first order derivatives of FDM can be applied to solve the diffusion PDE of the SPMe. The numerical solution of the solid phase with finite difference approach would be:
𝜕𝑐𝑠±
𝜕𝑡 (𝑍, 𝑡) = [ 𝐷𝑠±
𝑍𝑅𝑠±2∆𝑥
+ 𝐷𝑠
±
𝑅𝑠±2(∆𝑥)2
] 𝑐𝑠±(𝑛+1)
+ [ 𝐷𝑠
±
𝑅𝑠
±2(∆𝑥)2−
𝐷𝑠±
𝑍𝑅𝑠 ±2
∆𝑥] 𝑐𝑠
± (𝑛−1)
+ [ −2𝐷𝑠
±
𝑅𝑠±2(∆𝑥)2
] 𝑐𝑠±(𝑛)
where 𝑍 = 𝑟
𝑅𝑠±, ∆𝑥 is the distance between each two nodes, and
the boundary conditions are:
𝜕𝑐𝑠±
𝜕𝑟 (0, 𝑡) = 0 𝜕𝑐𝑠±
𝜕𝑟 (𝑅𝑠
±, 𝑡) = ± 1
𝐷𝑠±𝐹𝑎±𝐿±
𝐼(𝑡)
B. Finite-Element Method
The FDM is the simplest and most commonly used approach to the solution of the diffusion equations found in battery models. But FDM ignored the concentrations between each two nodes. The finite element method (FEM) add in admissible functions and generates equations for the nodal dynamics that can be realized in state-variable or transfer-function forms. More information and details on the FEM method can be found in [9, 10].
In the simulation part of this paper, the SPMe model is implemented in Matlab/SIMULINK. The full order model (FOM) is a numerical solution by FDM with 350 states in total. The solid phase is mashed in 50 nodes for each electrode and the electrolyte is mashed in 250 nodes across the three domains.
IV. MODEL ORDER REDUCTION TECHNIQUES
Solving the PDEs by FDM and FEM would produce a high order model. The full order would be 350th order. This full order
[image:3.612.43.299.338.699.2]A. Residue Grouping Method
To apply residue grouping method analytically, we need to obtain a transcendental transfer function with an infinite number of poles. Transcendental transfer functions are commonly characterised by numerous closely spaced poles with similar residues. The transcendental transfer function of the positive electrode solid diffusion equation is [11]:
𝑐𝑠𝑠+(𝑠)
𝐼(𝑠) = 𝑍 + ∑
𝑅𝑒𝑠𝑘𝑠
𝑠 − 𝑝𝑘 ∞
𝑘=1
where 𝑐𝑠𝑠+(𝑠) is the surface concentration after Laplace
transform, 𝑝𝑘represent the poles, 𝑅𝑒𝑠𝑘represent the residues,
and 𝑍 represents the steady state solution. The derivative of the transcendental transfer function and application of the residue grouping method on the electrode solid diffusion equation can be found in [1].
The poles are 𝑝𝑘 = −𝐷𝑠( 𝜉𝑘 𝑅𝑠)
2
where 𝜉𝑘 are roots of tan(𝜉𝑘) =
𝜉𝑘 not including 𝜉0= 0.The residues are 𝑅𝑒𝑠𝑘 = −2 𝑎𝑠𝐹𝑅𝑠𝑝𝑘. The
direct term is 𝑍 = −𝑅𝑠 5𝑎𝑠𝐹𝐷𝑠.
From [1], we take a cut-off frequency of 10 Hz to approximate the solid state diffusion dynamics and neglecting the high frequency dynamics above the cut-off frequency. Then plot the poles versus residues as Fig.3 shows.
[image:4.612.330.567.173.359.2]Residue grouping method is to partition the frequency range of interest into d “bins” and lump together modes within each bin. The grouping procedure yields the d-th order transfer function as a reduced order transfer function.
Fig. 3. Solid state diffusion poles and residues.
In Fig. 3 the blue dots are the analytical solution of the residues versus poles. After group the points into 6 “bins”, the reduced order solution would be a 6th order transfer function
with the input of apply current 𝐼(𝑡) and output the solid state surface concentration𝑐𝑠𝑠+(𝑡).
The same process can be applied on the negative electrode. For the electrolyte phase, the residue grouping method can be applied numerically based on FEM. The transfer function of ∆𝑐𝑒(𝑡) vs 𝐼(𝑡) would be got using the method in [1].
B. Balanced Truncation Method
Balanced truncation method is applied by minimising the system's maximum error in the frequency domain [2]. A balanced truncation uses Hankel singular values instead of eigenvalues to discard states and reduce the model order. With the proper choice of a threshold for state truncation, the model order can be reduced significantly without affecting the performance a lot. Fig. 4 show the plot of Hankel Singulars in different states for order reduction of the SPMe model with parameters in Table III.
Fig. 4. Hankel Singular Values (state contributions).
The implementation of balanced truncation in Matlab can simply by using function “balred()” to capture the reduced order
model’s transfer function.
The model order reductions in this paper, use a 6th order
transfer function for both the positive and negative electrode diffusion equation and the electrolyte diffusion as a 2nd order. In
total, the reduced order model is a 14th order for both
implementations of residue grouping and balanced truncation.
V. SIMULATION AND VALIDATION
To compare the different model order reduction techniques, both full order model and reduced order models based on SPMe model are implemented in SIMULINK. The parameters (Table III) are obtained by fitting the experimental data of a coin cell.
The validation of the model is performed using a discharge current of 0.5 C until the voltage reaches the minimum value, followed by a charge of 0.5C. The terminal voltage of the experimentally measured, the full order model (FOM), residue grouping reduced order model (RG) and balanced truncation reduced order model (BT) are compared. The comparison is shown in Fig. 5 below.
TABLE III. PARAMETERS
Parameters Symbol Value
Thickness of anode 𝐿− 22 μm
Thickness of separator 𝐿𝑠 20 μm
Thickness of cathode 𝐿+ 35 μm
[image:4.612.60.291.411.586.2]Volume fraction of solid in anode 𝜀𝑠− 0.635 Volume fraction of solid in cathode 𝜀𝑠+ 0.476 Volume fraction of electrolyte in anode 𝜀𝑒− 0.295 Volume fraction of electrolyte in separator 𝜀𝑒𝑠 0.44 Volume fraction of electrolyte in cathode 𝜀𝑒+ 0.443 Diffusion coefficient of solid in anode 𝐷𝑠− 0.1 μm2s-1 Diffusion coefficient of solid in cathode 𝐷𝑠+ 0.8 μm2s-1 Diffusion coefficient of electrolyte 𝐷𝑒 278.8 μm2s-1 Conductivity of solid in anode 𝜎− 100 Ω-1m-1 Conductivity of solid in cathode 𝜎+ 100 Ω-1m-1
Bruggeman porosity b 1.5
Ambient temperature T 298.15 K
Transference number 𝑡𝑐0 0.363
Kinetic reaction rate of anode 𝑘− 5 x 10⁻⁶ (A/m2)(mol3/
mol) (1+α) Kinetic reaction rate of cathode 𝑘+ 7 x 10⁻⁶ (A/m2)(mol3/
mol) (1+α) Charge transfer coefficients α 0.5 Ωm-2 Anode-electrolyte resistivity 𝑅𝑓− 0 Ωm-2 Cathode-electrolyte resistivity 𝑅𝑓+ 0 Ωm-2 Contact resistance/Current collector
Resistance
Rc 0 Ωm-2
Conductivity of electrolyte κ 0.95 Sm-1
Faraday’s constant F 96485.33289
Cmol-1
Universal gas constant R 8.314472
Jmol-1K-1 Fixed electrolyte concentration ce 1000 molm-3
Cell maximum voltage Vmax 4.115 V
Cell minimum voltage Vmin 2.5 V
Maximum concentration of anode 𝑐𝑠,𝑚𝑎𝑥− 31,389 molm-3 Maximum concentration of cathode 𝑐𝑠,𝑚𝑎𝑥+ 36,292 molm-3
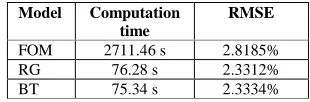
[image:5.612.362.517.53.104.2] [image:5.612.63.299.472.647.2]The real running time, peak error and root mean square error (RMSE) are given in Table IV. From the comparison figure and table it can be found, FOM has similar accuracy with the reduced order model RG and BT by comparing with the experiment results. However, the reduced order models’ computation time are much shorter than the FOM with the same simulation time (14000 s) and step length (0.1 s).
Fig. 5. Comparison of the terminal voltage among experiment result, full order model, residue grouping reduced order model, and balance truncation reduced order model.
TABLE IV. MODELS COMPARISON
Model Computation time
RMSE
FOM 2711.46 s 2.8185%
RG 76.28 s 2.3312%
BT 75.34 s 2.3334%
The residue grouping and balanced truncation method were implemented with the same reduced order in the simulation model. The residue grouping method appears very similar to the balanced truncation method but achieves slightly better accuracy in the whole cycle.
VI. CONCLUSION
This paper applied three methods to solve the PDEs in the electrochemical models of li-ion battery for control oriented implementation. The proposed model is most similar to those developed in [5], yet we analyse the solver of the PDEs in the governing equations and the model order reduction methods applied on the model. The reduced order single particle model, implemented in SIMULINK, was validated with experiment data of a coin cell. Accuracies of 97.67% was obtained for the reduced order models (compared with 97.18% for a full order model) when validated with constant current charge and discharge experiment. In addition, a model based observer can be subsequently designed and tested in the future.
ACKNOWLEDGMENT
This work was supported by the EPSRC Faraday Institution Multi-Scale Modelling project (EP/S003053/1, grant number FIRG003).
REFERENCES
[1] K. A. Smith, C. D. Rahn, and C.-Y. Wang, "Model order reduction of 1D diffusion systems via residue grouping," Journal of Dynamic Systems, Measurement, and Control, vol. 130, no. 1, p. 011012, 2008.
[2] M. Jun, K. Smith, and P. J. J. o. P. S. Graf, "State-space representation of Li-ion battery porous electrode impedance model with balanced model reduction," vol. 273, pp. 1226-1236, 2015.
[3] J. C. Forman, S. Bashash, J. L. Stein, and H. K. Fathy, "Reduction of an electrochemistry-based li-ion battery model via quasi-linearization and pade approximation," Journal of the Electrochemical Society, vol. 158, no. 2, pp. A93-A101, 2011.
[4] G. Fan, K. Pan, and M. Canova, "A comparison of model order reduction techniques for electrochemical characterization of lithium-ion batteries," in Decision and Control (CDC), 2015 IEEE 54th Annual Conference on, 2015, pp. 3922-3931: IEEE.
[5] S. J. Moura, F. B. Argomedo, R. Klein, A. Mirtabatabaei, and M. Krstic, "Battery State Estimation for a Single Particle Model With Electrolyte Dynamics," IEEE Transactions on Control Systems Technology, vol. 25, no. 2, pp. 453-468, 2017.
[6] K. E. Thomas, J. Newman, and R. M. Darling, "Mathematical modeling of lithium batteries," in Advances in lithium-ion batteries: Springer, 2002, pp. 345-392.
[7] A. Jokar, B. Rajabloo, M. Désilets, and M. Lacroix, "Review of simplified Pseudo-two-Dimensional models of lithium-ion batteries," Journal of Power Sources, vol. 327, pp. 44-55, 2016/09/30/ 2016.
[8] S. Pramanik and S. Anwar, "Electrochemical model based charge optimization for lithium-ion batteries," Journal of Power Sources, vol. 313, pp. 164-177, 2016.
[9] C. D. Rahn and C.-Y. Wang, Battery systems engineering. John Wiley & Sons, 2013.
![Fig. 1. Schematic of the Newman model [7]](https://thumb-us.123doks.com/thumbv2/123dok_us/9427042.447170/2.612.329.569.488.689/fig-schematic-the-newman-model.webp)
![Fig. 2. Block diagram of SPMe [5].](https://thumb-us.123doks.com/thumbv2/123dok_us/9427042.447170/3.612.43.299.338.699/fig-block-diagram-of-spme.webp)