David John Carnegie
A Thesis Submitted for the Degree of PhD at the
University of St. Andrews
2011
Full metadata for this item is available in Research@StAndrews:FullText
at:
http://research-repository.st-andrews.ac.uk/
Please use this identifier to cite or link to this item: http://hdl.handle.net/10023/1860
David John Carnegie
A Thesis presented for the degree of
Doctor of Philosophy
Optical Trapping group
Department of Physics and Astronomy
University of St Andrews
UK
Declaration
I, David John Carnegie, hereby certify that this thesis, which is approximately 48,000 words in length, has been written by me, that it is the record of work carried out by me and that it has not been submitted in any previous application for a higher degree. I was admitted as a candidate the degree of Doctor of Philosophy in September 2006; the higher study for which this a record was carried out in the University of St Andrews between 2006 and 2010.
Date... Signature of candidate...
I hereby certify that the candidate has fullled the conditions of the Resolution and Regulations appropriate for the degree of Doctor of Philosophy in the University St Andrews and that the candidate is qualied to submit this thesis in application for that degree.
Date... Signature of supervisor...
In submitting this thesis to the University of St Andrews I understand that I am giving permission for it to be made available for use in accordance with the regula-tions of the University Library for the time being in force, subject to any copyright vested in the work not being aected thereby. I also understand that the title and abstract will be published, and that a copy of the work may be made and supplied to any bona de library or research worker, that my thesis will be electronically accessible for personal or research use unless exempt by award of an embargo as
requested below, and that the library has the right to migrate my thesis into new electronic forms as required to ensure continued access to the thesis. I have obtained any third-party copyright permissions that may be required in order to allow such access and migration, or have requested the appropriate embargo below.
The following is an agreed request by candidate and supervisor regarding the elec-tronic publication of this thesis: Access to Printed copy and elecelec-tronic publication of thesis through the University of St Andrews.
Date ...
Signature of candidate...
can fuck o"
Dr Alun Anderson
Acknowledgements
Two people who need to be thank immediately are my two supervisors, Professor Kishan Dholakia and Dr Frank Gunn-Moore. They have both shown extraordinary patience and support throughout my time here at St Andrews and I was very fortu-nate to have the opportunity to work with them on this project. I greatly appreciate all the hours they spent reading and rereading this thesis and helping me to get it to where it is now.
Were it not for the continuing support of Dr David Stevenson I doubt I would be writing this thesis. He has been a constant source of motivation and has made insightful suggestions at every avenue that took this project in directions no one else thought to go. He was an especially great help when it came to the biological aspects of this project (as well as the whisky aspects of which there were many).
Special mention must also go to Dr Jörg Baumgartl and Dr Tomas iºmár for their vital support and expertise on spatial light modulators and their contribution to my 2009 publication.
Though I wish to thank everyone who helped me out over the years I would like to specically mention some people who really stood out. Graham Milne was a great help in the beginning where he showed me how to get the best out of the LabVIEW software that proved vital to this project. Dave Stothard and Dave Walsh from the Terahertz group were both very gracious when it came to exchanges of computer technology and oered vital objective opinions on all the latest software. Special thanks also goes to Rob, Xanthi, Lani, Lissa, Doog, Andrew, Paul, Craig, Chris as well as everyone else in the W-Squad and anyone else whoever helped me on this project. To those of you who were fortunate enough to attend one of the infamous physics bonre parties, it'll never be the same again.
Publications
Peer reviewed publications
D. J. Carnegie, T. iºmár, J. Baumgartl, F. J. Gunn-Moore and K. Dholakia, Au-tomated laser guidance of neuronal growth cones using a spatial light modulator, J. Biophotonics 2, 682-692 (2009).
D. J. Carnegie, D. J. Stevenson, M. Mazilu, F. J. Gunn-Moore, and K. Dholakia, Guided neuronal growth using optical line traps, Opt. Express 16, 10507-10517 (2008).
D. J. Stevenson, D. J. Carnegie, B. Agate, F. J. Gunn-Moore and K. Dholakia, Long-Term Cell Culture on a Microscope Stage: The Carrel Flask Revisited, Mi-croscopy and Analysis 22(1), 9-11 (2008).
Other publications
D. J. Carnegie, F. J. Gunn-Moore and K. Dholakia, Optically guided neuronal growth, SU2P Symposium, University of Strathclyde, March 2010.
D. J. Carnegie, F. J. Gunn-Moore and K. Dholakia, Optically guided neuronal growth, Scottish Neuroscience Group, St Andrews, August 2009.
D. J. Carnegie, F. J. Gunn-Moore and K. Dholakia, Optically guided neuronal growth, European Conference on Biomedical Optics, Munich, June 2009.
D. J. Carnegie, D. J. Stevenson, F. J. Gunn-Moore and K. Dholakia, Optically guided neuronal growth, International School of Biophotonics, Hven, Sweden, July 2007.
D. J. Carnegie, D. J. Stevenson, T.K. Lake, B. Agate, V. Gárcés-Chávez, F. J. Gunn-Moore and K. Dholakia, Optically guided neuronal growth, Medical Photonics Workshop, St Andrews, January 2007.
D. J. Carnegie, D. J. Stevenson, T.K. Lake, B. Agate, V. Gárcés-Chávez, F. J. Gunn-Moore and K. Dholakia, Optically guided neuronal growth at near infra-red wavelengths, Biophotonics: Technology and Applications, Institute of Physics, London, December 2006.
Publicity
Abstract
In this thesis, experiments into articially guiding neuronal growth cones using
tightly focused lasers beams were peformed and evaluated.
The experiments are performed by focusing a laser beam to the leading edge of
a developing growth cone and attemping to change the direction of growth cone.
These experiments were carried out using Gaussian, line and asymmetric line beam
proles. There was no noticeable change in the success rate with dierent beam
proles.
Following this, I assisted my colleague Dr Michael Mazilu in the construction
of a mathematical model of lopodia in an optical eld in order to help explain
the mechanism for optically guided neuronal growth which suggests that optical
trapping forces on lopodia are responsible.
Next, I set about implementing a system to automate the process of laser guided
neuron growth by employing a spatial light modulator and a custom built computer
program. This allowed the computer to track a developing growth cone and
auto-matically adjust the position of the laser beam as the growth cone developed. This
program was successfully employed to articially grow neuronal growth cones
to-wards a user inputted target point. The use of the spatial light modulator to beam
shape was also demonstrated with the use of a Bessel beam being used to guide
neurons for the rst time.
I also used a transgenic cell line of neurons to show for the rst time that HSP70
is not involved in this phenomenom. This was accomplished by transfecting NG108's
with a plasmid containing HSP70 promoter tagged GFP. Under enough thermal or
mechanical stress, the cells would express HSP70 which would produce a detectable
GFP signal. No GFP was detected in cells after being exposed to laser irradiation
of a power higher than would normally be used to guide neurons.
Combined, these experiments show that the beam prole of the operating laser
does not signicantly aect the success of articial growth and that the optical force
on lopodia near the laser beam is likely to be the mechanism for this phenomenon.
A possible heating eect of the laser has also been shown to not be strong enough to
illicit a heat shock stress response from the cell. The demonstration of an automatic
system which incorporates beam shaping has also been shown and such a system
shows the potential to advance the investigation of artical neuron growth using
Contents
Declaration ii Acknowledgements vi Publications viii Abstract x Abbreviations xv1 Introduction 1
1.1 Preface . . . 1
1.2 Synopsis of thesis . . . 4
1.3 Biophotonics . . . 6
1.3.1 Optical trapping . . . 7
1.3.1.1 Principles . . . 7
1.3.1.2 Experimental setup . . . 13
1.3.1.3 Notable examples from the literature . . . 16
1.3.2 Laser considerations . . . 19
1.4 Neurons . . . 22
1.4.1 Introduction . . . 22
1.4.2 Basic structures . . . 24
1.4.2.1 The cytoskeleton . . . 25
1.4.2.2 Actin treadmilling . . . 28
1.4.2.3 Action potentials . . . 30
1.4.3 The growth cone . . . 34
1.4.3.1 Introduction . . . 34
1.4.4 Growth cone guidance . . . 37
1.4.4.1 Chemical cues . . . 37
1.4.4.2 Other cues . . . 43
1.5 Optically guided neuronal growth . . . 44
1.5.1 Discovery and rst experiment . . . 44
1.5.2 Eect of beam shape . . . 45
1.5.3 Eect of wavelength . . . 47
1.5.4 Eect of pulsed operation compared to continuous wave . . . 50
2 Using optical line traps for neuronal growth 53 2.1 Introduction . . . 53
2.1.1 Cell culturing method . . . 56
2.1.2 Experimental setup . . . 58
2.2 Experimental procedure and results . . . 61
2.2.1 Explanation of `Forward' and `Reverse' bias congurations . . . 62
2.2.2 Description of laser application . . . 64
2.2.3 Results . . . 66
2.3 Mathematical model . . . 69
2.3.1 The original approach by Ehrlicher et al . . . 70
2.3.2 My lopodial approach . . . 72
2.4 Conclusion and discussion . . . 81
3 Development of an automated experimental setup 84 3.1 Introduction . . . 84
3.2 Spatial Light Modulators . . . 85
3.2.1 Introduction to Spatial Light Modulators . . . 85
3.2.2 Fourier optics and Spatial Light Modulators . . . 86
3.2.3 Principle of operation . . . 90
3.2.4 Beam aberration correction using SLMs . . . 94
3.2.5 Comparison to Acousto-Optic Deectors . . . 95
3.3 Spatial Light Modulators for neuron growth . . . 97
3.3.1 Optical train . . . 97
3.3.2 Introduction to LabVIEW . . . 100
3.3.3 Shape detection using LabVIEW . . . 101
3.3.4 Application of program . . . 108
3.4 Conclusion . . . 117
4 Investigations into the biochemistry of optically guided neuronal growth119 4.1 Introduction . . . 119
4.2 HSP-70 as an indicator for laser induced cell stress . . . 121
4.2.1 Introduction . . . 121
4.2.2 Plasmid construction . . . 122
4.2.2.1 Heat Shock Protein . . . 122
4.2.2.2 Green uorescent protein . . . 125
4.2.2.3 HSP70-GFP . . . 128
4.2.2.4 Plasmid construction and transfection . . . 130
4.2.3 Experimental procedure . . . 132
4.2.3.1 Controls . . . 132
4.2.3.2 Main experiment . . . 134
4.2.5 Conclusion and discussion of heat shock experiments . . . 139
4.3 Chemical pathway inhibition . . . 140
4.3.1 Introduction . . . 140
4.3.2 Introduction to chemical pathways . . . 142
4.3.2.1 The mitogen-activated protein kinases . . . 142
4.3.2.2 Phosphatidylinositol 3-kinases . . . 144
4.3.3 Inhibitors used . . . 147
4.3.3.1 UO126 . . . 147
4.3.3.2 LY294002 . . . 148
4.3.4 Experimental procedure and results . . . 149
4.3.4.1 Results . . . 152
4.3.5 Conclusion and discussion of protein inhibition experiments . . . 156
5 Conclusions and discussion 159 Bibliography 166 Appendix 185 5.1 Appendix 1: Data in Table 2.1 . . . 185
Abbreviations
ADP - Adenosine Diphosphate
AOD - Acousto-Optic Deector
ARP - Actin Related Protein
ATP - Adenosine Triphosphate
BAEC - Bovine Aortic Endothelial Cell
BFP - Blue Fluorescent Protein
CAM - Cell Adhesion Molecule
CCD - Charge Coupled Device
CDC42 - Cell Division Control Protein 42
CHO - Chinese Hamsyer Ovary
CO2 - Carbon Dioxide
COM - Centre of Mass
CRT - Cathode Ray Tube
CW - Continuous Wave
DCC - Delected in Colorectal Carcinoma
DIC - Dierential Interference Contrast
DMEM - Dulbecco's Modied Eagle Medium
DMSO - Dimethylsulphoxide
DNA - Deoxyribonucleic Acid
DRG - Dorsal Root Ganglia
EGFP - Enhanced Green Fluorescent Protein
EM - Electromagnetic
ER - Endoplasmic Reticulum
ERK - Extracellular Signal-Regulated Kinase
FACS - Fluorescence-Activate Cell Sorting
FCS - Foetal Calf Serum
FGF - Fibroblast Growth Factor
FITC - Fluorescein Isothiocyanate
FRET - Förster Resonance Energy Transfer
FT - Fourier Transform
GFP - Green Fluorescent Protein
HASMC - Human Aortic Smooth Muscle Cell
HOT - Holographic Optical Tweezers
HSE - Heat Shock Promoter Element
HSF - Heat Shock Factor
HSP - Heat Shock Protein
HSP70 - Heat Shock Protein 70
HSPB1 - Heat Shock Protein Binding Factor 1
IR - Infrared
LC - Liquid Crystal
LCD - Liquid Crystal Display
MAPK - Mitogen-Activated Protein Kinase
MEK1 - Mitogen-Activated Protein Kinase Kinase
NA - Numerical Aperture
Nd:YAG - Neodynium-doped Yttrium Aluminium Garnet
NGF - Nerve Growth Factor
NIR - Near Infrared
NRK - Normal Rat Kidney
N-WASP - Neural Wiskott-Aldrich Syndrome Protein
PAK - p21 Protein-Activated Kinase
PC - Personal Computer
PI3K - Phosphoinositide 3-Kinase
QPD - Quadrant Photodiode
RAC - Ras-Related C3 Botulinum Toxin Substrate
ROI - Region of Interest
RNA - Ribonucleic Acid
SAM - Surface Adhesion Molecule
SLM - Spatial Light Modulator
SPM - Single Point Mutation
Ti:Sapph - Titanium-doped Sapphire
TP - Target Point
UNC5 - Uncoordinated Locomotion-5
UV - Ultra Violet
Chapter 1
Introduction
1.1 Preface
When Albert Einstein published Zur Quantentheorie der Strahlung in 1917 [1], he
set physicists on a quest to develop a source of coherent monochromatic light that
is now theoretically possible thanks to his work. However, it was not until over 40
years later that the rst laser was demonstrated to the world by Theodore Maiman
in 1960 [2].
Originally, the laser was almost ridiculed as a solution looking for a problem but
since then several entirely new elds of physics have emerged based around the laser
and exploiting it for scientic and technological gain. In the beginning of the 21st
century the laser is now ubiquitous and there is almost no aspect of industry that
has not been touched by it. Telecommunications, spectroscopy, defence, computing
and medicine have all been through massive revolutions in the last 50 years because
of this new device.
Another one of the great technological innovations from an understanding of
Einstein's quantum theory of light was the invention of `optical tweezers' in 1986
by Arthur Ashkin [3]. Using a focused laser beam it is possible to transfer sucient
amounts of momentum from the photons to small particles to conne them spatially
in three dimensions. Ashkin immediately saw the biological potential of such an
invention and the following year published a paper describing the optical trapping
and manipulation of viruses and bacteria [4]. However, for this work he used an
Argon laser operating at 514 nm which is a wavelength that is harmful for cells
and so, later in the same year, Ashkin published another paper again showing the
trapping and manipulation of cells but using a Nd:YAG laser of wavelength 1064
nm which is less harmful to biological cells [5].
A direct oshoot of the eld of photonics, Biophotonics is concerned with
bio-logical applications of photonic devices. The term now includes all areas of research
investigating the interaction between biological materials and photons. Most of the
research in this eld has been conned to the ultra-violet, visible and infra-red
re-gions of the electromagnetic spectrum because of the availability of laser sources in
those regions.
Examples of research in Biophotonics includes uorescent cellular microscopy,
laser assisted nanosurgery, optical transfection and optical manipulation of cells. In
this thesis I will discuss my experiments into optically guided neuronal growth which
can be considered a form of optical manipulation. Optically guided neuronal growth
a developing neurite and can manipulate the direction of their growth.
The study into articial neuron growth is important because of the many diseases
and aictions in humans that are attributed to damaged neuronal circuitry. Some
sh have the ability to regenerate their spinal neurons and regain motor control
of their limbs after trauma which would leave a mammal otherwise paralyzed [6],
so the repair of spinal tissue is at least possible and has been demonstrated in
nature. Any technology which can articially grow neuronal structures has the
possibility of becoming the basis for a treatment into diseases and ailments which
are specically caused by neuronal growth problems. An additional benet of using
optical methods for this is the sterility that comes with a non-contact technique.
No physical contact is needed and so any procedure is intrinsically sterile which is
an important consideration in practical medicine.
There is also keen interest in the possibility of building circuits and logic gates
using neurons [7]. Any technique that could manipulate the circuitry of neurons
could therefore be of use in this endeavor
Though more extensive research will be needed before any of the experiments
dis-cussed in this thesis could lead to practical medical or technological fruits, the
grow-ing interdisciplinary collaborations between physicists and biologists ensure that this
1.2 Synopsis of thesis
This thesis is constituted of ve chapters. This rst chapter is written as a brief
introduction to the eld of Biophotonics and specically to optically guided
neu-ronal growth. Covered in this chapter will be examples of Biophotonics research
and its importance as well as the background science necessary to understand my
experiments into guiding neurons with light. The brief history of experiments by
other research groups into this phenomenon will also be covered.
Chapter 2 is the rst experimental chapter and will deal with my experiments
into the eect dierent beam proles have on articial neuronal growth. I will detail
my experimental setup that was used to create the Gaussian and line beams that
were employed as well as discuss the results of these experiments. I will also describe
the mathematical model I assisted in building with my colleague Dr Michael Mazilu
using Mathematica 5.2 (Wolfram). This model builds on previous work by Ehrlicher
et al and I will discuss the importance it has to my observations. The implications of
these results with regard to some of the other literature on optically guided neuronal
growth, will also be discussed.
In Chapter 3, I describe a series of experiments and developments that led to
the creation of an automated system for optically guided neuronal growth. This will
involve a discussion on the principles of the spatial light modulator (SLM) as well
as a brief review of its use throughout the Biophotonics literature. I will also go
into a detailed description of the LabVIEW (National Instruments) program that
extract edge information for real time tracking. Finally, within the this chapter, I
will show the results demonstrating that this system works and also show how the
beam shaping capabilities of the SLM mean that this system could form the ideal
platform for a more in depth and comprehensive study into this phenomenon.
Chapter 4 is the nal experimental chapter and deals with my investigations into
the biochemistry of laser guided neuron growth. This chapter is split into two
sec-tions, one investigating the possibility of laser induced thermal eects using HSP70
promoter GFP tagged transgenic cell lines and the other detailing experiments into
chemical pathway inhibition. Previous work on laser induced thermal stress in cells
has shown that HSP70 can be up regulated, but there are also examples in the
lit-erature that show that the thermal eects experienced by neurons during a typical
laser guided neuron growth experiment are marginal. My experiments set out to
determine if the laser radiation used in these experiments is indeed activating a heat
shock response in these cells which could plausibly explain why they react to focused
laser light. This section will include some specic background details on HSP70 and
GFP as well as some examples of their use in the literature. Cellular responses to
stimuli are governed by complex biochemical pathways and it is plausible that a
laser beam as used for neuron growth experiments could be interfering with this
machinery and be responsible for the neurons response to focused laser light. In
or-der to test this hypothesis I reviewed the literature on chemical pathway inhibition
in neuronal growth cones and chose to inhibit two key proteins (separately) to see
proteins chosen for inhibition were mitogen activated protein kinase kinase (MEK1)
and phosphatidylinositol-3 kinase (PI3K) which have been shown in the literature
to be vital for viability of growth cones in neuronal cells. With these proteins
inhib-ited, growth cones in the NG-108 cell line were adversely aected and even collapsed,
despite the presence of a laser beam used for articial growth. This suggests that
these pathways are a pre-requisite for optically guided neuronal growth and that the
laser does not suciently aect the biochemistry of the cell to aect it's response
to certain chemical inhibitors.
1.3 Biophotonics
For the purposes of understanding this thesis it will be useful to review the
back-ground science on optical trapping and neuronal growth without which my
experi-ments would not be possible.
Biophotonics is a combination of words biology and photonics and has become
a general term used to describe experiments and technology that deal with the
interaction of photons and biological matter. The eld of Biophotonics is very diverse
and includes technologies and techniques such photoporation, optical cell sorting,
nanoparticle injection, optical coherence tomography, photo dynamic therapy and
diuse optical tomography. A complete review of Biophotonics is beyond the scope
of this thesis and the examples listed are only to give an idea of the size and diversity
of the eld.
branches of science including medicine and biology. The invention of the optical
tweezers further cemented the demonstrably important role physics could play in
the biology lab. Discussed here is the basic principles behind the optical tweezers
and some notable examples of its use from the literature as well a mention of the
various laser sources used in these applications. Also discussed are some recent
advances in the eld of Biophotonics including photoporation, optical cell sorting
and nanoparticle injection systems.
1.3.1 Optical trapping
1.3.1.1 Principles
The fundamental principle behind optical tweezers is the ability of light to carry and
transfer momentum. Planck hypothesized in 1901 that the energy of any system that
absorbs or emits light of frequency ν must do so in discrete energy levels of E =hν
[8]. In 1905 Einstein showed Planck's hypothesis to be correct experimentally and
that light does act as a particle [9].
The photon, later shown to be an elementary particle, was capable of transferring
discrete amounts of energy as well as, because of mass-energy equivalence, discrete
amounts of momentum between absorbing targets. The momentum carried by a
photon is related to its frequency and is given by the formula p = hν/c. So a
particle that absorbs a photon will experience a change in momentum due to the
conservation of momentum. For example, a photon of wavelengthλ=1064 nm will
of these photons to exert a constant force of 1 newton on an absorbing object then
one would need 1.605 ×1027 of these photons transferring their momentum every second which would be equivalent to a power of ∼ 300 M W. What this means is
that it would be impractical to use the momentum of photons to exert macroscopic
forces, but for a microscopic object which weighs on the order of picograms then
only a force of F = mg w 10−11 N would be required to counteract the weight of this particle, which is equivalent to a photon power of∼3mW.
Ashkin was the rst to show that this radiation pressure could be used to
ac-celerate and conne microscopic particles in 1970 [10]. He observed that one laser
could accelerate particles along its optical axis and then showed that two directly
opposing beams could conne the particles (i.e. the radiation pressure from each was
balanced in the middle). It was another 16 years before he demonstrated the rst
single beam optical tweezers [3] which is only made possible by what was termed
`negative' radiation pressure. In the Mie regime (where particle size is the
wave-length of the laser light) a ray optics approximation, shown in Figure 1.1, is sucient
to describe the optical forces.
More precisely, the forces in the Mie regime due to the optical gradient and the
scattering can be described by equations 1.1 and 1.2 respectively [11].
Fgrad = nP
c
Rsin 2θ+T
2[sin(2θ−2φ) +Rsin 2θ]
1 +R2+ 2Rsin 2φ
(1.1)
Fscat= nP
c
1 +Rcos 2θ+ T
2[cos(2θ−2φ) +Rcos 2θ]
1 +R2+ 2Rsin 2φ
where n is the refractive index of the surrounding medium, θ is the angle of
incidence of the photon upon the particle, φ is the angle of refraction, R is the
reection coecient, T is the transmission coecient, P is the incident power and
c is the speed of light. In order for axial trapping, Fgrad must be greater than Fscat.
These equations are essentially derived from the geometry of the ray optics and
the particle as shown by Ashkin in 1992 [11]. It is interesting to note that these
equations do not depend upon the radius of the particle, however this is because the
equations are neglecting the force due to gravity and the Brownian motion due to
thermal energy. Since mass (and thus the force due to gravity) varies as the cube of
the radius, larger particles become harder to trap and, conversely, since Brownian
motion varies inversely as the cube of the radius, smaller particles nd it easier to
escape optical potential wells. Between these two extremes is a window of size (from
about 18 nm to hundreds of microns) where optical tweezing forces dominate which
fortunately falls into the size range of cellular and molecular biology.
For situations where the particle size is much larger than the wavelength (Mie
regime) of the photon, the ray optics model of photons refracting through the particle
and imparting momentum is perfectly adequate but this model breaks down for
situations where the particle size is much less than the incident wavelength (Rayleigh
regime). In this situation we can no longer consider photons travelling through the
object and must instead model the system based on the electric eld of the laser
beam and the dielectric properties of the particle. In the presence of an electric eld,
Figure 1.2: Diagram of a dielectric particle in an electric eld. On the left the eld is uniform and there is no net force on the particle. On the right, there is a eld gradient which leads to a charge imbalance on the particle which results in a net force towards the most intense region of the electric eld. Image reproduced from [12].
eld. If this eld is uniform then there is no net force, but if the electric eld has
a gradient, then there is a charge imbalance which leads to a net force towards the
most intense region of the electric eld (i.e. the beam centre). Shown in Figure 1.2
is a diagram to illustrate this.
As in the Mie regime, there is also a scattering force that counters the gradient
force in the Rayleigh regime. Whereas the scattering force in the Mie regime was
attributed to the absorption and re-emission of light (reection) imparting
momen-tum on the particle, in the Rayleigh regime, the scattering force can be attributed
to the absorption and re-emission of light by the dipole induced in the particle.
The gradient force on a dielectric particle in an electric eld can be shown to be
described by equation 1.3 [3,13,14] and the scattering force by equation 1.4 [3,14]
Fgrad(r) =
1
Fscat(r) =
8π4
3λ4ε2n3cα
2I(r) (1.4)
where I(r) is the incident intensity, λis the wavelength of the incident light, ε is
the permittivity of the particle and α is the polarisability of the particle given by
the Clausius-Mossotti equation
α = 4πεa3n2
m2−1
m2+ 2
(1.5)
where n is the refractive index of the surrounding medium, a is the radius of the
particle and m is the eective refractive index which is the ratio of the refractive
index of the particle to that of the surrounding medium. Notably there is a
depen-dency on the radius of the particle in Fgrad which implies that larger particles are
easier to trap than smaller ones. However, since Fscat also varies as the radius (but
to the power of 6 due to the dependence onα2 which itself depends on a3) then the
scattering forces increase faster than the gradient forces and large particles actually
become harder to trap at large radii (of course this model breaks down at particle
sizes of rλ). In addition to Fgrad being greater thanFscat for trapping, we must
also consider the signicant Brownian motion of particles in this size regime. In
order to trap a particle successfully we need the potential due to the optical force
at the beam centre to be larger than the thermal energykBT of the particle so that
the Boltzmann factorexp [−U(r)/kBT]is less than 1 whereU(r) = 12nαE(r)2 is the
potential of the gradient force (which is derived by integrating Equation 1.3 over r).
size decreases, so does the polarisability and thus the trapping potential due to the
optical force, to date the smallest particle successfully trapped by a single laser beam
has been a gold nanoparticle of radius 18 nm but this required a huge laser power
(>800 mW) and the trap was not stable over periods longer than a minute [15].
The computational mathematics of modelling Rayleigh particles in an optical
eld has spurred a considerable amount of research in and of itself [3, 13, 14, 16, 17]
and the results of this research will be applied later in Chapter 2 to help model the
behaviour of cytosolic actin in the presence of an optical eld.
However, when the dimensions of the trapping particle are on the same scale
as the wavelength of the laser (roughly 0.1λ−10λ), it is in an intermediate range
between the Rayleigh and Mie regimes. For particles in this range neither the
ray optic or dipole approach is valid and a much more rigorous development of
electromagnetic (EM) theory must be used. Several of these concepts have been
extended to arbitrary shapes such as spheroids and are referred to as `generalized
LorenzMie theories' [1822]. In practice, particles in this regime are still readily
trapped.
1.3.1.2 Experimental setup
Fundamentally, all that is needed to construct optical tweezers is a laser beam and a
high quality microscope objective to focus the beam down to a suciently small spot.
Shown in Figure 1.3 is an example of a typical optical tweezers setup incorporated
Figure 1.3: Simplied diagram of a generic optical tweezers setup. Essentially it is a microscope that has a laser beam ported into the back aperture of the objective which focuses the laser down to a microscopic spot in the sample plane. The laser beam is rst expanded to the same width as the back aperture by a two lens system and then image on to the back aperture by another two lens system. Mirror 1 can be used as a steering mirror. Mirror 2 is a dichroic which reects the wavelength of the laser light but transmits at other wavelengths allowing the CCD to capture images. Without the laser this system would operate exactly as a standard transmission microscope with a lamp providing illumination through a condensing lens before being captured by the objective lens and transmitted to a CCD (or eyepiece).
Typically a laser operating in the TEM00 mode will be collimated and passed
through a two lens system to increase its beam width to match that of the back
aperture of the microscope objective, such as the lenses immediately after the AODs
in Figure 1.3. The lling of the back aperture is necessary to obtain a diraction
limited beam waist at the focus, an under lled aperture will result in a large beam
waist and thus a reduced axial trapping power, whereas an overlled aperture will
result in loss of power [23]. After being expanded by this lens system the beam is
usually imaged through another two lens system such that the nal lens is one focal
aperture of the microscope, which means if a steering mirror is placed here, then
spatial translation in the focal plane is possible without altering the ux through
the back aperture. A graphical explanation of this is shown in Figure 1.4.
Figure 1.4: Illustration of the operation of a steering placed at the conjugate plane of the microscope back aperture. The red lines represent an unsteered beam rst being reected o the mirror (far left) and then travelling left to right through the lens system and nally to a focus after passing through the objective (far right). The dashed lines indicate focal planes and the black line running down the centre is the optical axis. The green lines show a possible path for the beam if the mirror had been rotated slightly. Notice how it focuses in the same plane but at a dierent point from the unsteered beam and how the ux through the back aperture remains unchanged.
This steering mirror can be tted with a piezoelectric device or a galvanometer
so that it can be rotated automatically allowing precise control of the beam location
at focus. Alternatively, the mirror can be replaced with a reecting spatial light
modulator (SLM) to allow much more precise beam control and complex shaping
options. These devices are becoming much more common in optical setups and I
will elaborate more on their operation in Chapter 3.
Optical tweezers, such as those described here, can be said to form the basis
of the ever expanding `optical toolkit'. This toolkit includes optical equivalents for
most household tools such as optical scissors (used to cut molecules) [24], optical
stretchers (used to mechanically deform cells) [25], optical spanners (used to impart
torque) [26], optical sieves (used to lter cells based on size) [27] and an optical
1.3.1.3 Notable examples from the literature
As previously mentioned, research in this eld has been ongoing since Ashkin's
original work in 1986 and it would not be unfair to say that most of the applied
work has come from using the optical tweezers to study biological processes.
At the molecular scale, a great example of such work is that of Svoboda et al
who in 1993 used optical tweezers to measure the individual 8 nm steps taken by
the kinesin molecule [29]. This was made possible by the attachment of optically
tweezable silica beads, carrying single molecules of kinesin, and then depositing these
beads onto microtubules.
Kinesins are a class of motor proteins found in eukaryotic cells that travel along
the cytoskeletal microtubules and can transport other cytosolic proteins around the
cell. The nature of the molecule (shown in Figure 1.5) suggested that it moves
along the microtubule in discrete steps [30]. To do the experiment, Svobada et al
placed kinesin coated silica beads into a solution containing ATP and microtubules
(microtubules are visible under DIC microscopy). They then trapped a bead and
positioned it over a microtubule and, using a technique known as optical trapping
interferometry, were able to measure minute but discrete changes in the displacement
of the bead from the centre of the trap. These displacements could only have been
due to the kinesin molecule trying to pull the bead along the microtubule and so
they could observe the individual 8 nm steps that the kinesin was making along the
microtubule.
two beams of orthogonal linear polarisation states. These beams are both focussed
through the objective down to overlapping diraction limited spots laterally
sep-arated by ∼250 nm but functioning together as a single optical trap. The bead
introduces a relative retardation between the two polarisation states and so when
the beams are recombined by the condenser they interfere and create an elliptical
polarisation state. This elliptical polarisation state is separated by a quarter wave
plate back into two orthogonal linear polarisation states. The dierence in
inten-sity between these two beams is detected by two photodiodes and a normalising
dierential amplier. If the bead is exactly between the two traps then the relative
intensity will be zero, however, if the bead is slightly displaced from this point then
an intensity dierence can be detected and for small distances (<150 nm) this
dif-ference scales linearly with displacement. Because the same beam is also trapping
the bead, then a restoring force will be felt by the bead when it moves out of the
beam centre. For small displacements this force scales linearly with displacement.
So, with trapping power known, and the displacement of the bead from the trap
measurable, it becomes possible to measure any force that is acting to move the
bead from the trap centre. In the experiment described, this force comes from the
Figure 1.5: Diagram of a kinesin molecule carrying cargo along a microtubule. The kinesin itself is composed of two chains (red and blue) the heads of which are alternatively switched `on' and `o' by converting ATP to ADP and vice versa. When `on' the head is attached to microtubule and the structure of the molecule is such that the o head will be in front where by it will be switched `on' and attach to the microtubule at which point the rear head will switch `o' and detach and move ahead to the next step and the process begins again. This implies that the kinesin will move along the microtubule in small discrete steps. Image reproduced from [31]
So by measuring the displacement using photodiodes it becomes possible to also
determine the accompanying restoring force. In a similar experiment in 1995 the
same researchers were able to measure the force exerted by a single molecule of
Escherichia coli RNA polymerase during transcription (14 piconewtons) [32]. Ten
years later, the same group then did the experiment again and were able to measure
the individual steps the RNA polymerase took as it moved along the DNA it was
translating. The step size they measured was0.37±0.06nm, a distance which they
note is comparable to a single base pair [33].
In 2000, Wuite et al measured the force required to stretch both double stranded
DNA (dsDNA) and single stranded DNA (ssDNA). Using two beads linked together
by the DNA, with one bead held stationary in a pipette and the other in a force
the force required to achieve this. It was shown that ∼ 6 pN of tension is enough
to stretch dsDNA and ssDNA to double their lengths [34,35]. A similar experiment
in 2006 by Matsumoto and Olson attempted to measure the twisting modulus of
DNA [36].
Optical tweezers have also found application at the cellular scale. Indeed it was
Ashkin who rst used optical tweezers to trap and move bacteria and viruses in
1987 [4]. Optical tweezers have also been used to study sperm motility in primates
[37,38]. By using a trapping laser of known force König et al were able to accurately
determine the swimming force of the sperm [37] and Nascimento et al then used the
same technique to quantify the motility of sperm and compare it to the `speed of
progression' (SOP) score, which is a commonly used measure of fertility in medicine,
determined by sperm motility experts. They found that the forces measured by
optical trapping provided valuable quantitative information to assess sperm motility
[38]. The ability of optical tweezers to move cells is also being applied to the eld
of in vitro fertilisation [39,40].
1.3.2 Laser considerations
The practical wavelength range of commercially available laser sources covers roughly
157 nm (F2 excimer laser, pulsed) to about 10.6 mm (CO2 gas laser, cw), though
some molecular gas lasers have been demonstrated to operate at up to 699 mm [41].
For optical tweezing and related biological applications, visible light wavelengths
objec-tives) are designed to work in this range. Although recently, some manufacturers
have begun to make objectives which are designed to operate eciently at UV and
NIR wavelengths (e.g. the Nikon UV 100x Objective which can operate
achromati-cally down to 248 nm).
For biologically specic applications, it is also important to consider the potential
harm caused by the wavelength (and not just power) of the laser. A good example
is that of DNA which is very sensitive to photodamage from UV light (peaks at
260 nm). When UV light is incident on the molecule it causes cross-linking between
adjacent cytosine and thymine bases creating pyrimidine dimers (as well as creating
free radicals) [42]. Pyrimidine dimers are mutagenic and are the primary cause of
skin cancer in humans [43].
Ashkin himself was aware of this when he published his rst work on trapping
bacteria [4]. In that work he used an Argon laser of wavelength 514 nm which he
noted was very eective at killing the bacteria he was attempting to trap (which
led him to coin the term optocution). He then published a similar experiment
in the same year trapping bacteria with the much less harmful NIR wavelength of
a neodymium-doped yttrium aluminium garnet (Nd:YAG) laser at 1064 nm and
demonstrated the ability to trap and manipulate them without killing them [5].
Why this wavelength is less damaging than 514 nm is because cells and bacteria are
comparatively more transparent in the NIR range, which in turn is because many
biological chromophores absorb in the strongly in the visible region but not in the
absorb strongly at increasing IR wavelengths [44].
This has led to the NIR being one of the most commonly used wavelength for
optical trapping. Diode laser sources have also recently begun to be used extensively
because of their cheap cost and high output powers. The mode-locked widely tunable
titanium-doped sapphire (Ti:sapphire) laser (which can tune over a range ~700-1050
nm) is also a commonly used laser in optical tweezing setups, especially in research
and applications that are wavelength dependent and/or require a pulsed operation.
Despite being the most commonly used wavelength range for optical trapping,
certain wavelengths of NIR can also be harmful. For example, a study by Neuman
et al in 1999 attempted to measure the photodamage caused to Escherichia coli over
the wavelength range of 780-970 nm using a tunable Ti:sapphire laser [45]. They
found that photodamage is minimised at 830 and 970 nm but reaches a maximum
at 870 and 930 nm. This result agrees quite well with a previous study done on
Chinese hamster ovary (CHO-K1) cells over the same wavelength range suggesting
it is a general trend not specic to any one lifeform. [46].
Other plausible mechanisms for why some wavelengths are more toxic than others
include localised heating [47] and multiphoton absorption [48,49].
Localised heating will occur to a degree for all powers and wavelengths. Where
there are absorption peaks, for example in the spectrum of water, then there will be
a higher degree of heating. Heating can of course be harmful to cells and this will
be explored further in Chapter 4.
and are essentially absorbed as one photon equal to half the wavelength (double the
frequency) of the incident photons. The chances of two or more photons arriving
at the same time is increased by a higher photon density (i.e. beam power) and
can be a particular problem (or benet depending on the context) for pulsed lasers.
For example, a mode-locked Ti:sapphire can operate over a range of ~700-1050 nm
which corresponds to two and three photon absorption wavelengths in the visible and
UV regions respectively which covers the UV range where photodamage is typically
higher than that of visible and NIR wavelengths.
Biophotonics is a continuously growing eld of science and its technologies are
important tools in single cell analysis and surgery as well as complex molecular
biology studies. With the ever decreasing costs and increasing quality of lasers,
the potential applications and technologies developed from Biophotonics is set to
increase.
1.4 Neurons
1.4.1 Introduction
Cells have already been mentioned in this thesis but without any explanation of
exactly what they are or how they operate and it will be useful to briey cover an
introduction to the basic biology here.
All known cell types share some basic features: they are all protected by a
phospholipid membrane and they all contain DNA and the necessary machinery to
eukaryotic cell.
Figure 1.6: Diagram of a typical eukaryotic cell. Notable structures are the plasma membrane protecting the cell from the exterior world, the nucleus that contains the DNA of the cell and the organelles such as mitochondria which provide energy for the cell. On the far left of the diagram is a small section of microtubules. Microtubules (not shown clearly in this diagram) form part of the cytoskeleton of the cell (along with actin and other molecules) and are used to transport chemicals around the cell. The cytoskeleton plays a very important role in the development of neurons. Image reproduced from [50].
The main dierence between eukaryotes and prokaryotes is that eukaryotes have
organelles such mitochondria and a nucleus. Mitochondria have their own DNA and
as such are able to replicate independently of the host cell. They are also responsible
for producing adenosine triphosphate (ATP) for the host cell.
The nucleus of the cell consists of another phosopholipid membrane that
sep-arates the cell's chromosomal DNA from the cytosolic medium of the cell. The
to enter and exit. When the cell divides, the nuclear membrane completely dissolves
and then reforms as two separate nuclei, one for each daughter cell.
1.4.2 Basic structures
Neurons are eukaryotic cells found only in lifeforms that belong to the clade
Eu-metazoa (a subkindgom of Animalia that excludes sponges and other simple animal
life). Neurons are the primary cells that form the nervous system of animals and
can be subdivided into specialist roles such as sensory neurons or motor neurons
depending on where they are in the body and what function they carry out. The
nervous system is a network of these neurons which is used to control or coordinate
all the other organs of the animal via the transmission of electrical signals through
the neuronal circuitry.
Figure 1.7 is a diagram of a typical neuronal cell. A dening characteristic of all
neuronal cells is the axon. This structure begins as a protrusion from the cell body
that grows and elongates into a long thin wire. In the human body, the longest
axons extend from the base of the spine to the periphery of the big toe which is
about a metre in length [51]. Also shown in this diagram is the myelin sheath that is
provided by Schwann cells wrapping themselves around the axon. Myelin sheaths are
only found in lifeforms belonging to the Gnathostomata infraphylum (vertebrates
with jaws) and is an ingenius evolutionary mechanism that increases the speed
of nerve conduction [52]. Cephalopods (which do not belong to Gnathostomata)
Figure 1.7: Diagram of a typical developed neuronal cell. The cell body is much like that of the Eukaryote shown in Figure 1.6 containing the nucleus and other organelles necessary for its operation. Also shown in this diagram are main structures of neurons, the axon and the dendrites as well as the myelin sheath formed from Schwann cells. Dendrites transmit signals to the soma (cell body) whilst axons transmit signals away from the soma Image reproduced from [54].
diameter of their axons. So much so, that the squid giant axon can be up to 1
mm in diameter and thus can be experimented on macroscopically as was shown by
Hodgkin and Huxley in their 1952 work [53] which won them the Nobel prize for
physiology in 1963.
1.4.2.1 The cytoskeleton
All cells have a structural system known as the cytoskeleton which is a composed of
a series of molecule structures that control and maintain the morphology of the cell.
The cytoskeleton consists of three main components: microtubules, intermediate
laments and actin laments. Microtubules are the largest of the three structures
and are polymer laments composed of a series dimers made up of of 55 kDa proteins
Figure 1.8: Diagram of a microtubule showing how the two tubulin dimers link to form the polymer. The diameter of a microtubule is approximately 25 nm with a tubulin dimer measuring approximately 8 nm [55]. Image reproduced from [56].
1.8. Microtubules (MT's) form a complex network throughout the cell and play a
key role in the development of axons in neurons. They act as highways for chemicals
and organelles to be transported around the cell in molecular vehicles such dynein
and kinesin as mentioned above in section 1.3.1.3.
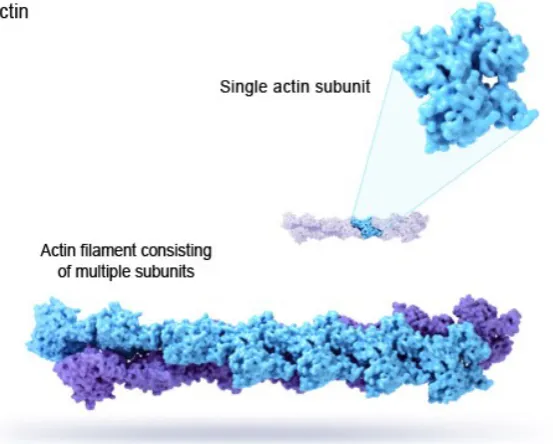
By contrast, actin laments are much smaller than microtubules. They are
composed of actin monomers (G-actin) which are 42 kDa proteins approximately
3 nm in size which polymerise to form an actin lament (F-actin) about 7 nm in
diameter [57]. A diagram of an actin lament in shown in Figure 1.9.
Actin performs several vital purposes in cells such as cytokinesis and is the
primary structure involved in muscle contraction. In cytokinetics, the actin laments
are very dynamic structures with monomers being continually adding on at one end
and dissolved at the other in a process known as treadmilling [58], which is very
Figure 1.9: Diagram of actin lament. The lament (f-actin) is composed of monomers of globulus actin (g-actin) in a helical structure. They are coloured dierently here to show the helix but there is no dierence between the molecules. Image reproduced from the U.S. National Library of Medicine.
detail in the next subsection.
Actin polymerisation is the primary process that drives cell motility. To move
across a substrate, cells use structures called lopodia (or pseudopodia) which are
essentially membrane wrapped bundles of actin laments that extend out of the
of the cell body and adhere to the substrate. For example, lopodial growth is
stimulated when an animal is wounded and broblasts move to close the wound [59].
Filopodia are also the primary machinery involved in the development of neuronal
axons which will be discussed in more detail in section 1.4.3 and 1.5. Filopodia are
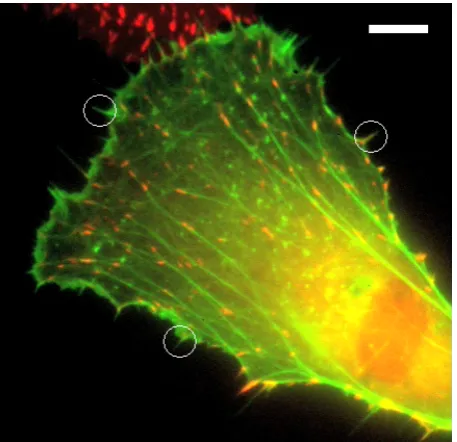
also the subject of a mathematical model in chapter 2.3. Shown in Figure 1.10 is a
uorescent image of a cell stained with actin-GFP in which individual lopodia are
visible. Actin will be revisited in Chapter 2 where I will discuss its role in modelling
Figure 1.10: Fluorescent image of a goldsh broblast tagged with actin-GFP. The net-work structure of the actin laments is visible in the cell body, but also visible are the lopodia protruding from the edge of the membrane. I have marked out some obvious ones with white circles but there are many visible. This cell is also stained with rhodamine tagged vinculin which is the red colour visible. Scale bar is 10 microns. Image reproduced from [60].
Intermediate laments are a family of related proteins which form laments with
an average diameter of ∼ 10 µm. Unlike actin and microtubules, there are several
types of intermediate lament which can be subdivided into six types based on
structural similarity. A discussion of intermediate laments is beyond the scope of
this thesis but for an extensive review see Fuchs et al [61].
1.4.2.2 Actin treadmilling
Treadmilling is the term given to the dynamic process of actin polymerisation and
depolymerisation that takes place in the cell. Essentially, it is when one end of the
lament grows (more molecules are added on to it, extending it) whilst the other end
shrinks (molecules come away from it) which, even though the individual molecules
Figure 1.11: Diagram of the actin treadmilling process advancing a cell membrane. Red spheres represent ATP-actin and blue spheres represent ADP-actin. The green sphere is used as a reference sphere to illustrate how a lament seems to move forward whilst the monomers remain stationary. Proceeding from the top: 1. ATP-actin bind together to form a lament. 2. As the lament grows the, the membrane is advanced and the actin at the end will dephosphorylate to ADP-actin. This end of the lament can depolymerise into ADP-actin monomers which can then be phosphorylated back into ATP-actin (not shown). 3. ATP-actin continues to polymerise onto the ATP end and the membrane continues to advance.
Since actin can be linked to the extra cellular matrix (ECM) via integrins (e.g.
laminin or bronectin), then the treadmilling can aect the motion of the whole cell
relative to the ECM [62]. A simplied diagram of how actin monomers can form a
treadmilling lament is shown in Figure 1.11.
Treadmilling also occurs in microtubules since they can also be bound to the
ECM by transmembrane proteins. The treadmilling of actin is particularly
impor-tant in the growth cone of developing axons because it is what drives the motion
of the growth cone. A chemical guidance cue (discussed in section 1.4.4) can aect
this treadmilling which will change the way the growth cone moves e.g. towards
or away from the source of the cue. Any process which aects cell motility will
which reduces the availablity of ATP, such as an ATPase, will result in a reduction
of actin polymerisation since ATP is needed for actin to polymerise.
A common protein which increases the polymerisation of actin by increasing
the number of nucleation sites for actin is the ARP2/3 (actin related proteins 2/3)
complex [63]. Any stimulus which increases the presence of ARP2/3 in an area will
also increase the polymerisation of actin in that area. Netrin-1 is an example of
such a stimulus and this is discussed in section 1.4.4.1. A diagram of lopodia and
ARP2/3 advancing the membrane is shown in Figure 1.12.
1.4.2.3 Action potentials
The function of neurons in metazoa is to provide the circuitry for the transmission of
electrical signals throughout the body. The axons are essentially wires which transit
these electrical signals to other neurons (or to muscles in the case of neuromuscular
junctions)
These electrical signals are known as action potentials and the axons conduct
them in a single direction, away from the cell body and toward the axon terminal,
where it can either be transmitted to another neuron via a synapse junction or to a
muscle cell via a neuromuscular junction.
Synapses can be formed between axons and dendrites (axodendritic), axons and
other axons (axoaxonic), axons and other cell bodies (axosomatic) and even between
dendrites (dendrodendritic). Whilst most neurons have only one axon, they can
have many dendrites (up to 10,000 [64]). Thus a neuron can have many inputs, but
An action potential is triggered when the neuron is subject to enough stimulation
to `re' an electrical signal. The potential across the membrane of a typical neuron
is maintained at around -70 mV by the cell pumping sodium (Na+) and potassium
(K+) ions in and out. This potential is known as the resting potential. The cell
actively works (uses ATP) to pump these ions against the electrical gradient to
setup the membrane potential. Neurons are stimulated by environmental changes
that alter this membrane potential. Opening potassium channels further decreases
the membrane potential (hyperpolarises) whilst opening sodium channels depolarise
the neuron. If these stimuli are small enough, the cell will quickly act to return to
the resting potential within a few milliseconds. However, if the depolarising stimulus
is suciently strong, a threshold is crossed which triggers a positive feedback event
whereby more sodium ow into the cell causes more sodium ow into the cell. This
quickly completely depolarises the neuron and briey reverses the polarity of the
membrane potential. Once the sodium channels have been fully opened the cell
begins to recover to the resting potential by pumping out the sodium again. This
entire sequence takes only a few milliseconds. This short burst of electrical activity
is the action potential, and it immediately begins to propagate down the axon.
The action potential is an all or nothing event. Either the stimulus is sucient
to cause the positive feedback cascade, or it isn't. The action potential is digital in
that it is either fully on or fully o without any inbetween levels.
The stimulation which can cause a neuron to re can come from other other
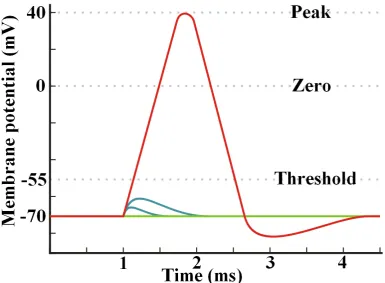
pho-Figure 1.13: Simplied diagram of how the membrane potential changes during an action potential. The green line represents a neuron that is not perturbed over the time frame, blue lines represent stimulations that were insucient to trigger an action potential and the red line represents a suciently strong stimulus that triggers an action potential. The cell membrane has a resting potential of -70 mV compared to the extra cellular medium. In order for a stimulus to successfully trigger an action potential it must breach a threshold voltage in order for positive feedback to accelerate the depolarisation. The blue lines fall short of this threshold (which is around -55 mV) and so the membrane potential recovers without the neuron ring. The stimulus for the red line need only be sucient to get the potential above -55 mV for the cell's own feedback mechanism to take eect and hyperpolarise the membrane to a peak potential of around 40 mV. This pulse will propagate down the membrane of the cell via the Na+ and K+ ion gates along it opening in succession. Once the peak potential
[image:51.595.120.506.187.470.2]tons of light can trigger an action potential [65]. In the case of other neurons, when
an action potential reaches a synapse, the presynaptic membrane releases vesicles
of neurotransmitters which trigger neuroreceptors on the postsynaptic membrane
which causes sodium channels to open and depolarise the postsynaptic cell which
can trigger another action potential. Generally, neurons have several inputs and
only one output and it takes several inputs arriving at the same time to suciently
depolarise the postsynaptic cell to transmit the action potential. In this way neurons
can be thought to act as logic AND gates.
Action potentials have been shown to eect the development of growth cones by
changing intracellular levels of calcium ions (Ca2+) [66]. In particular, the inux of
calcium ions into the growth cone has been shown to collapse the growth cone by
disrupting the actin laments within it [67]. It has also been shown that the turning
eect on a growth cone by Netrin-1 (discussed in section 1.4.4.1) can be completely
negated by the removal of extracellular calcium ions [68].
Pulsed femtosecond lasers have been demonstrated to be capable of triggering
action potentials in neurons. This has been attributed to a multiphoton eect and
is not possible under cw irradiation [69].
1.4.3 The growth cone
1.4.3.1 Introduction
Neurogenesis, the creation of neurons from stem cells, is most active during
A freshly created neuron structurally resembles a broblast initially and has none
of the archetypal neuronal features shown in Figure 1.7 such as an axon or dendrites.
However, the production of the axon begins as soon as this neuron dierentiates and
a structure called the growth cone begins to protrude from the cell body [71].
The growth cone is a highly motile path-nding structure that forms the tip of
a developing axon. It consists of a at area known as the lamellipodium which is
structurally made up by a mesh of actin laments. The lopodia extend as spiny
protrusions from the lamellipodia and are made up of bundles of parallel actin
laments. The whole structure is connected to the cell body by a series of parallel
microtubules feeding it resources and removing waste. Shown in Figure 1.14 is
a diagram of a growth cone showing these structures. Figure 1.15 is an electron
microscope image of a developing growth cone. Visible is the at lamellipodium
from which the lopodia protrude. The advancement of the growth cone is driven
by actin polymerisation at the leading edge [72].
Growth cones are important because they exist to connect developing axons to
the correct places in the body to ensure that the animal is born with a functional
nervous system. Because there are so many permutations of possible nervous system
structures and that only a few of them will result in a healthy animal, a complex
system of guiding the growth cones to ensure they reach their correct targets has
evolved. This system is mostly based on chemical signal detection.
All around the membrane of the growth cone are various molecular binding
Figure 1.14: Diagram of neuronal growth cone. The microtubule network is shown as green and the actin as red. As shown, the lopodia are bundles of actin laments that protrude away from the growth cone in search of substrate to attach to. The axon being dragged by the advancing growth cone consists almost entirely of parallel microtubules. Image from [73].
to aect the direction of growth [74]. Chemical cues secreted throughout the body
direct the developing axons to their correct targets. Once a growth cone has reached
and bound to its target it will cease growing and become a synapse connecting it to
the other cell [75].
The actual cues that growth cones respond to has been the subject of intense
research for many years [7679] and a comprehensive review of this work is beyond
the scope of this thesis. However, a brief review of work which specically uses these
chemical cues to articially guide developing axons is necessary since this can be
related to optically guided neuronal growth.
1.4.4 Growth cone guidance
1.4.4.1 Chemical cues
The use of lasers to guide axons is a relatively recent innovation, previously our
knowledge on how growth cones are controlled has come from studies using chemical
gradients and scaolds.
The justication for using chemicals is easily understandable since this is exactly
how the axons develop in vivo and by exerting control over which chemicals a
de-veloping axon is exposed to, it should be possible to exert control over its direction
of growth. Shown in Figure 1.16 is a diagram of how a growth cone would respond
Figure 1.16: Diagram of a growth cone turning in the presence of an attractive chemical gradient (pink=high concentration, white=low concentration). The diagram is a sequence proceeding from 1-4. 1. The growth cone before the gradient is introduced with a F-actin net-work making up the lamellipodia and lopodia and with a MT bundle in the shaft. 2. When a chemoattractant is detected, F-actin selectively polymerizes on the side of the growth cone toward the attractant, forming increased numbers of lopodia and lamellipodia. This bias of actin polymerization to one side of the growth cone causes less polymerization on the opposite side, favoring shrinkage/retraction of lamellipodia and lopodia. 3. Numbers and size of F-actin bundles increase and are stabilized by actin-bundling proteins and linkages to the substrate. 4. When the growth cone is pointing directly towards the chemoattractant, no one side of the growth is favoured over the other and F-actin polymerisation on both sides is stabilised. Image and caption reproduced from [80] but edited for the purposes of this thesis.
There are many chemical factors that can control neuronal growth cones. These
chemical signals can be both attractive or repulsive to growth cones. Shown in Table
1.1 is a list of such factors.
These cues can be subdivided based on their operation. Netrins, semaphorins
and Slit are diusible secreted proteins whilst cadherin is a cell adhesion molecule
(CAM) and laminin is a secreted surface adhesion molecule (SAM).
Netrins are a class of molecules identied as being involved in axon guidance and
Environmental cue Eect Target References Netrins Attractive/repulsive# DCC/UNC5 receptor [81,82]
Semaphorins Mostly repulsive## Multiple receptors [81,83]
Ephrins Attractive/repulsive Eph A/B receptor [81,84] Laminin Adhesive Integrin receptor [82] Cadherin Adhesive Other cadherins [79,85]
Slit Repulsive Robo receptor [81,86]
Table 1.1: List of well known chemical cues involved in growth cone guidance. #depending
on what receptor is being activated, ## semaphorin 3A is attractive. This list is not
ex-haustive.
articially guide the developing axon of a spinal neuron from Xenopus laevis [88]
and shown in Figure 1.17 is an axon turning towards a source of Netrin-1. Netrins
are bifunctional in that they can act as either chemoattractants or chemorepellants
depending on which surface protein it binds to, for example Netrin-1 acts as an
attractant when binding to the DCC (deleted in colorectal carcinoma) receptor but
as a repellent when binding to the UNC5 (uncoordinated locomotion-5) receptor [89].
Structurally, Netrins are similar to laminin which is an important surface adhesion
molecule (SAM) [77].
Figure 1.17: Time lapse image sequence of a Xenopus laevis spinal neuron turning to-wards a diusing source of Netrin-1. Sequence progresses from A to D and the time in minutes is shown in the bottom right corner of each frame. The arrow in the top right shows the location of the Netrin-1 source and, as can be seen, the neuron is growing to-wards it. The scale bar is 10 mm, the number in the lower right corner is the time in minutes. Image reproduced from [88].
in-vestigated for axon guidance. Semaphorins make up the largest group of guidance
cues consisting of at least 30 members [90]. They were originally thought to act
as moderators of axon repulsion in vitro [91, 92] and in vivo [9395] but they can
act as chemoattractants as well [96]. Shown in Figure 1.18 is a series of images of
a Xenopus spinal neuron reacting to the presence of Sema3A normally and then
in presence of a protein (truncated Plexin-A1) that blocks the repulsive eects of
[image:58.595.192.432.293.629.2]Sema3A.
Figure 1.18: A control spinal neuron exposed to a gradient of Sema3A emanating from a pipette (A) is repelled away over a period of 1 hr (B). In contrast, a GFP-expressing spinal neuron from an embryo injected with mRNA for the truncated plexin-A1 construct (C) is not aected after 1 hr by Sema3A (D). A similar neuron (E) shows a normal attractive response to netrin-1 after 1 hr (F). Image and caption reproduced from [97].
Netrins and (some) Semaphorins are long range guidance cues because they are