ISSN Online: 2151-1969 ISSN Print: 2151-1950
DOI: 10.4236/jgis.2019.116046 Dec. 27, 2019 766 Journal of Geographic Information System
Geological Context Mapping of Batouri Gold
District (East Cameroon) from Remote Sensing
Imagering, GIS Processing and Field Works
Bissegue Jean-Claude
1, Tchameni Rigobert
1, Etouna Joachim
2, Fosso Tchuente Périclex
1,
Danra Moh Guela Guy Basile
11Department of Earth Sciences, Faculty of Science, University of Ngaoundéré, Ngaoundéré, Cameroon 2National Institute of Cartography (INC), Yaounde, Cameroon
Abstract
The Batouri area is located in the Adamawa-Yade domain in East Cameroon region, and has a high geological potential as a host for gold deposits. It is covered by thick forest where outcrops are sometime scarce. The purpose of this study is to generate and combine different geological information which makes up the specificity of the Batouri gold District, in order to contribute to the better knowledge of its geological setting. From satellite imageries, GIS tools and field data; lithological units, lineament and density maps have been dressed at regional-scale of 1/400.000. The mapping has enabled the discov-ery of spatial and topologic relationships between shear zones, lineaments, gold occurrences and often mineralized granitic intrusions. According to the field data, lithological and lineament maps, the lithology of the Batouri gold District is characterized by alkali granitoids (tonalite, granodiorite, syeno- monzo-granite, alkaline granite) hosted by orthogneisses and migmatites as gold mineralization hosts; while the lineaments show a major shear zones trending NE-SW defined by presence of mylonites. The shear zones crosscut all lithologies, mostly granodiorite where majority of gold occurrences is ob-served; locally, nearest these shear zones, rocks are transformed to the mylo-nites and gold is concentrated along. From density map, it is shown that the high gold mineralization zone corresponds to highest lineaments density. All those data suggest that gold mineralization in the Batouri district is controlled by tectonic and lithology. It is conclusive that Batouri gold deposit is epige-netic gold set emplaced in orogenic setting, during the post-collisional stage of the Central African Fold Belt (CAFB) and the Congo Craton (CC).
Keywords
Mapping, Remote Sensing, Landsat 8 OLI, SRTM, GIS, Batouri Gold District How to cite this paper: Jean-Claude, B.,
Rigobert, T., Joachim, E., Périclex, F.T. and Basile, D.M.G.G. (2019) Geological Context Mapping of Batouri Gold District (East Cameroon) from Remote Sensing Imager-ing, GIS Processing and Field Works. Jour-nal of Geographic Information System, 11, 766-783.
https://doi.org/10.4236/jgis.2019.116046
Received: November 12, 2019 Accepted: December 24, 2019 Published: December 27, 2019
Copyright © 2019 by author(s) and Scientific Research Publishing Inc. This work is licensed under the Creative Commons Attribution International License (CC BY 4.0).
DOI: 10.4236/jgis.2019.116046 767 Journal of Geographic Information System
1. Introduction
The lithologic and structural studies are the starting issues to evaluate the spati-otemporal distribution of ore bodies in a landscape in each well-known area. During the last decades, many works have been carried out in the Batouri gold mining area focusing on the geology and geochemical aspects of lode gold mi-neralization [1]; on the sulphide microchemistry and hydrothermal fluid evolu-tion in quartz veins [2]; on the lode gold mineralization [3], on the geochemistry and geochronology [4], on the investigation of the reliability of anomaly, and also on the ascertainment of the nature of gold distribution within the soil hori-zons [5], on the determination of the distribution of the area of likely trap mi-neralization or fluid flow from the gravity data [6]. However, all those studies are concentrated in Kambele site and its surroundings; none is done at region-al-scale (municipality) allowing the natives to master their geological resources. Nevertheless, the artisanal mining sites are found everywhere through the study area. Thus, thick forest cover, scarcity of outcrops, lateritic cover, an inaccessible landscape, lack of lithologic details and insecurity are the major hindrances. To overcome these limitations, remote sensing offers a set of tools to improve the location of lithological boundaries and allows the mapping of lineaments with precision.
For more than a century, Remote Sensing using vegetation and drainage pat-tern as indicators has been long used for its potential in the discrimination of hidden lithological units and fractures in geological studies and mining explora-tion [7]. As far as, GIS is well known for its performances in compilation of mul-tisource data layers.
In this work, we used the Landsat 8 OLI and SRTM (Shuttle Radar topography Mission) images data combined to the field observations and previous works in GIS to produce geological data such as main lithological facies, structural linea-ments and density maps enabling the contribution to the better knowledge of geological setting of the Batouri gold District at East region of Cameroon.
2. Localization and Geological Setting of the Batouri Gold
District
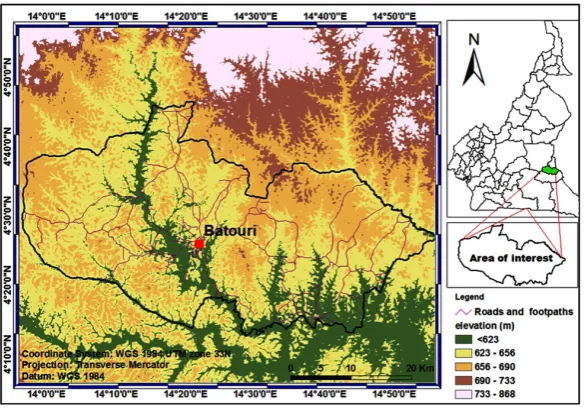
The study area is bounded between latitude 4˚15' and 4˚50' North and longitude 13˚58' and 14˚60' East and covers a surface area of 3888 Km2. Batouri town is
si-tuated about 90 km northeastern of Bertoua and it is accessible through lateritic road (Figure 1).
DOI: 10.4236/jgis.2019.116046 768 Journal of Geographic Information System shear zone (CCSZ) and the Mayo Nolti shear zone (MNSZ). Particularly, the Central Cameroon shear zone and the Sanaga fault are well investigated in Mayo Dana-West of Tibati and Bafia regions respectively [9] [10] [11]. Along the ENE-WSW trending Central Cameroon shear zone and his Sanaga shear fault relay, kinematic analysis show an earlier D2 sinistral transpression followed by a D3 dextral shear movement during Pan-African Orogeny. The AYD is domi-nated by 640 - 610 Ma, syn- to late-collisional high-K calc-alkaline granitoids
(Figure 2(b)). These granitoids intrude high-grade gneisses that represent a
Pa-laeoproterozoic basement, which was likely dismembered during the Pan-African orogeny [8] [12] [13]. The rocks of the AYD are classified into three main groups
[12] [14]: 1) large supracrustal blocks of Palaeoproterozoic metasedimentary
rocks and orthogneiss with assimilated Archean crust similar to the Ntem Com-plex, 2) 640 - 610 Ma syn- to late-tectonic granitoids of transitional composition and crustal origin, and 3) 612 - 600 Ma low- to medium-grade metasedimentary and metavolcaniclastic rocks. The geology of Batouri is particularly dominated by syn- to late tectonic granites locally crosscut by systems of shear zones ([15];
Figure 2(c)).
[image:3.595.228.522.504.709.2]Moreover, newly published interpretations based on field observations, pe-trological, geochemical and geochronological data suggest that 1) the Adama-wa-Yadé domain represents an Archaean/Palaeoproterozoic microcontinent, which was detached from the northern margin of the Congo craton in the early Neoproterozoic, but became re-accreted together with the Mayo Kebbi (mag-matic) arc during the Pan-African orogeny [16] 2) the Tcholliré-Banyo Shear Zone, at the northern edge represents the exhumed mid- to lower part of the former orogenic root of the Central Africa Orogenic Belt that has undergone partial melting, lateral flow and pan-African (650 and 580 Ma) intrusion of maf-ic to felsmaf-ic calc-alkaline magmas [17]. It has been intruded by many Pan-African granitic plutons [18].
DOI: 10.4236/jgis.2019.116046 769 Journal of Geographic Information System Figure 2. (a) Geological sketch map of west-central Africa and north-east Brazil with cratonic masses and the Pan-African-Brasiliano provinces belt in west-Gondwana; mod-ified from from [19] [20]. Pa: Patos shear zone, Pe: Pernambuco shear zone. Dashed out-line roughly marks the state boundary of Cameroon. (b) Geological sketch map of Ca-meroon showing from the major lithotectonic domains (After [19] [21]). TBSZ: Tchol-liré-Banyo shear zone, CCSZ: Central Cameroon shear zone, SF: Sanaga fault, GGSZ: Godé-Gormaya shear zone, MNSZ: Mayo Nolti shear zone, RLSZ: Rocher du Loup shear zone. (c) Geologic map of Batouri east, sheet No NB.33 S.W. E.31 (modify from [15]).
3. Methods
3.1. Remote Sensing Data Set
To carry out this study a set of Landsat 8 OLI (Operational Land Imager) and SRTM (Shuttle Radar Topography Mission) images of the Endeavour space shuttle were used. A total of two OLI and SRTM scenes 184-57 and 183-057 Path/Row covering the study area were obtained from the U.S Geological Survey website of Maryland University. Their characteristics are as follows: 1) The pe-riod of acquisition was December 2018 which corresponds to the dry season, 2) the Landsat image shows clouds SW of study area; 3) the spatial resolution is 30 m, 4) the data are georeferenced to Universal Transverse Mercator (UTM), World Geodetic system 1984 (WGS 84) zone 33N, 5) they are in Geotiff format. The analysis of the different resulting maps was made using Envi 5.1 and ArcGIS 10.2.2.
3.2. Data Pre-Processing
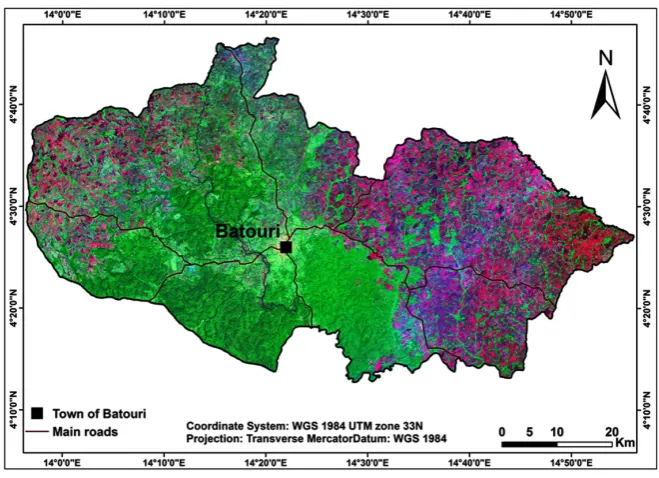
3.2.1. Mosaicking and SubsettingMosaicking is the merging of two or more images just to form a single. It was required because the study area is covering more than one image. Both scenes 184-57 and 183-057 Path/ Row of Landsat and SRTM were merged and the area of interest was subsetted (Figure 3).
3.2.2. Stretching
con-DOI: 10.4236/jgis.2019.116046 770 Journal of Geographic Information System trast was improved manually by the interactive stretching of Gaussien type. The objective here is to increase the perception of the image by improving its visual quality, in order to highlight certain elements that characterize the geology namely faults and discontinuities.
3.3. Data Processing
The methodology used was based on Remote Sensing and GIS approach. The main steps of the methodological approach carried out, are presented in the flowchart shown below (Figure 4).
3.3.1. Lithological Study
Lithological formations were discriminated using the band color composition, PCA classification, prewitt filter and drainage pattern approach.
1) Band color composite
[image:5.595.235.511.333.529.2]The Band color composite was applied to the seven first bands (1, 2, 3, 4, 5, 6 and 7) with the same resolution (30 m) of the Landsat 8 OLI stacked image, by assigning band 5 to the primary color red (R), band 4 to the green (G) and band
Figure 3. Mosaicked Landsat 8 OLI scenes (False color 752) covering the study area (black polygon).
[image:5.595.260.488.572.692.2]DOI: 10.4236/jgis.2019.116046 771 Journal of Geographic Information System 2 to blue (B). The choice of 542 for RGB required the compute of the Optimum Index Factor (OIF) in ILWIS software; this one has a maximum value for good visual interpretation. The false color composite (FCC) image (Figure 5) ob-tained integrates additional information closer to the reality of the field, that re-veals the structure of the soil and clearly allows the discrimination of the geolog-ic features referring to the vegetation in view of relationship between vegeta-tion-soil-geology.
2) Directional filtering and PCA
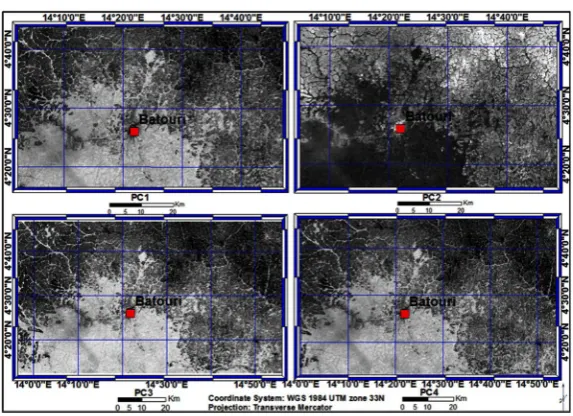
[image:6.595.208.538.457.696.2]The directional filters are used to highlight or to mask the specific characteris-tics of the image based on their frequency linked to the texture. We used direc-tional filters, in particular, Prewitt filter shown in Table 1. Prewitt’s algorithm 7 × 7 matrix filters is an operator used in image processing for the detection of contours. In this study, the Prewitt filter was done on 542 colored image and panchromatic image (band 8). The Principal Component Analysis (PCA) was carried out in order to overcome the strong redundancy of multi-band images and to improve the contrast of the image (Figure 6). The PCA generates a series of new image bands that are generally expressed in lowering order of variability. Thus, the first principal component represents as much variation as possible in the original image data. The input image contains the seven bands with same resolution. The result of the three first components (the neo-channels PC1, PC2 and PC3) represents respectively 59.20%; 28.60% and 11% (Figure 6) of the in-formation contained in the original multi-spectral image with seven bands. Later on, a supervised classification of a PCA image was run (Figure 7), the signa-ture file was created using PCA values of co-located pixels with field polygons (fieldwork).
DOI: 10.4236/jgis.2019.116046 772 Journal of Geographic Information System Figure 6. Scree plot of eigenvalues
Figure 7. Four first neo-channels PC1, PC2 (inverted), PC3, and PC4 in greyscale, representing respectively the decreasing of the information con-tained in the original multi-spectral image.
Table 1. The Matrix of Prewitt filter.
1 1 1 1 1 1 1
1 1 1 1 1 1 1
1 1 1 1 1 1 1
−1 −2 −3 −7 1 1 1
−1 −2 −3 −3 1 1 1
−1 −2 −2 −2 1 1 1
−1 −1 −1 −1 1 1 1
3.3.2. Lineament Study
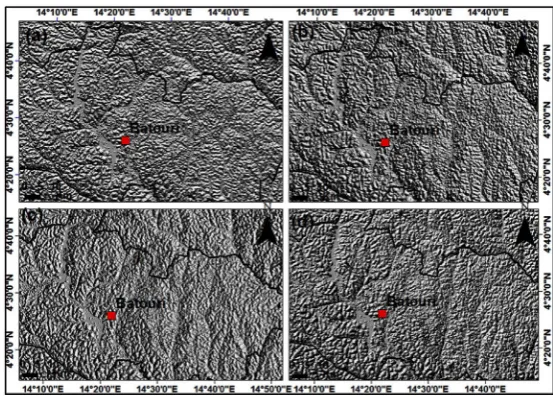
[image:7.595.230.517.254.462.2]pro-DOI: 10.4236/jgis.2019.116046 773 Journal of Geographic Information System cedure was performed in two steps: First, the shaded relief images were created for various sun azimuths and angles of 045˚, 135˚, 225˚ and 315˚ (Figures 8(a)-(d)). Indeed, areas perpendiculars to the sun angle are illuminated the most while the areas with high angle or greater than 90˚ are shaded. Secondly, slope gradient maps were generated through stretching by histogram equalizer into 10 intervals and display with a gradual greyscale from white (lower values) to black. The histogram is a little bit homogeneous and the values for mean, standard devia-tion and median are almost same. Then, visual and manual interpretadevia-tions were required to extract geologic lineaments.
3.4. Field Investigation Techniques
[image:8.595.234.511.376.574.2]During the field surveys, we explored the outcrops and described rock outcrops at regional and mesoscale. Set of tools mainly including GPS and geologic compass has been very useful for measuring of the geological structures such as foliation, shistosity, boudins, and fractures. This step also permitted to collect the represent-ative samples of each rock types, to explore the mining sites in each landscape, and then to take the locations of gold occurrences using the GPS. The outcrops in this area were accessed through the roads and cattle tracks, footpaths, rivers and stream channels. The vegetation encountered is typically a wooded savanna at north, the forest galleries along rivers and streams and dense forest at South.
Figure 8. Hillshade images with varying sun azimuth and angle used to enhance structural determination of lineaments in the area. (a) sun illumination azimuth at 45˚; (b) Sun illumination azimuth at 135˚; (c) Sun illumination azimuth at 225˚; (d) Sun illumination azimuth at 315˚ (black line represents contours of study erea).
4. Results
4.1. Field Observations
DOI: 10.4236/jgis.2019.116046 774 Journal of Geographic Information System gneisses, orthogneisses and mylonites, whereas undeformed rocks are consti-tuted of tonalite, diorite, granodiorite, syeno-monzo-granite, alkaline granite,
(Figure 9(a), Figures 9(c)-(g)). At the mapping scale, four main rock types’
namely tonalite, granodiorite, syeno-monzo-granite and alkaline granite have been distinguished and mapped. The main mineralization styles consist of 1) quartz vein deposits and stockwerks (Figure 9(b)) and 2) disseminated deposits which constitute the primary gold deposits; 3) the alluvial placers and 4) eluvial placers are secondary gold deposits. Most of the artisanal mining sites such as Kambele, Mongonnam, Tikondi, Pandi, Tapare and Mama are situated at sec-ondary placers. The field data based on the relative chronology of the different structural elements observed on the outcrops and the geometric relationship between these structural features revealed that, the area of Batouri was affected by three phases of deformation.
[image:9.595.281.465.329.608.2]The early deformation D1 phase is associated to two events: firstly, the mig-matization and granitization of old gneiss basement, and the SW-NE and S-N trending faults associated with intrusion of aplite dykes; secondly the emplace-ment of plutonic rocks recorded all along the tectonic evolution. In places,
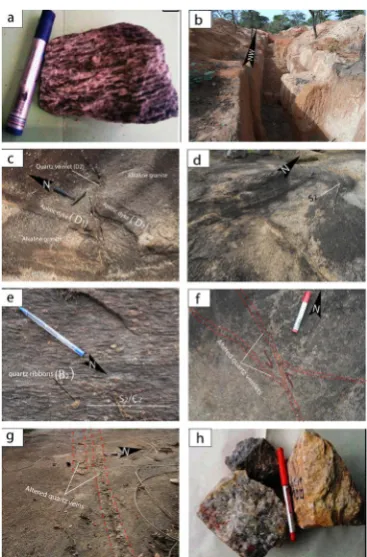
Figure 9. Field photographs of some rock samples and outcrops, artisanal mining and deformation structures at Batouri. (a) Mylonite sample from Ndongmembe. (b) NW-SE-trending tunnel of mineralized vein extracted by artisanal miners at Pandi. (c) Outcrop of sub-horizontal alkaline granite intruded by an aplite dyke and cross-cuted by a quartz vein at Nguemo. (d) C2-band along Protomylonite at
DOI: 10.4236/jgis.2019.116046 775 Journal of Geographic Information System the aplitic granite intrutions occur as a set of parallel near-horizontal dykes which appear to define local foliation and assuming to represent the last phase of magmatic activity at Batouri. This phase shows both the spatial association of ductile and brittle structures marked by migmatitic foliation and aplitic granite dykes (Figure 9(c)). That phase was recorded by migmatites of Ndoumimbe, Nguemo and Goura II. In general, the foliation S1 is locally outlined by sub-hori-
zontal aplitic granite dykes intruded mostly in alkaline granites and migmatites. Three main orientations of S1 foliation have been identified: 1) a major NE-SW
direction with average dips of 35˚ NW, 2) E-W to N and 3) NNE-SSW direction with flat dip. As for L1 lineation, it’s commonly mineral lineation, defined by quartzo-feldspathic elongation with main direction N-S and oblique plunge (~35˚) to the Nord. Thus, the intersection of foliation plants have yield to the facts of a regional P1 fold axes (±N170˚/30˚).
The D2 deformation phase is defined by SW-NE trending ductile-brittle sini-stral shear zones associated with gold mineralization, which mainly cuts grano-diorite, syeno-monzo-granite and alkaline granite plutons. These shear zones are Brittle-ductile shear zones formed under intermediate conditions (fault zones + deformation + metamorphism). That phase locally combined mylonitic folia-tion, schistosity and also associated with secondary NW-SE-trending faults. In field, S2 mylonitic foliation, S2 schistosity and C2 sinistral shear band (Figure
9(d)) were observed in mylonites of Ngouengan, protomylonites of Ndou-mimbe, granodioritic gneisses of Dimako I, syeno-monzo-granites of Tikondi and granodiorites of Kambele. The S2 mylonitic foliation is outlined by a
com-positional banding and mostly trends NE-SW rarely WNW-ESE with sub-ver- tical dip toward NW. The transposition of S1 by C2 thrust was observed at scale
of outcrop in alkaline granite of Ndoumimbe and Djira. The lenticular porphy-roclasts of feldspars(B2) associated to sinistral S2/C2 structures are developed on
both the mafic (biotite, amphibole) and the quartzo-feldspathic layers (Figure
9(e)).
Brittle aspect of this phase consist of fractures marked by the N030˚, N060˚, N090˚, N135˚ C2 quartz veins shear planes which displace and truncate aplite
veins with sinistral motion and subvertical dip (Figure 9(f)). These veins vary from 5 cm to 0.5 m in thickness and are discontinuous (Figure 9(g)), they con-sist essentially of white, rose and smoky quartz varieties, as well as carbonates
(Figure 9(h)).
The D3 phase is mainly brittle and composed of fractures including barren quartz veins, pegmatite dykes and dry joints with all azimuthal direction, they are mostly encountered in Bougogo, Amidobi, Goura II, Nkolbomo, Tikondi Djoko, Gbakine, Mbosso and Takobe.
4.2. Lineament Investigation
DOI: 10.4236/jgis.2019.116046 776 Journal of Geographic Information System structures were considered (Figure 10(a)). From the satellite imageries processed, a total of 1669 lineament features and major faults were identified, extracted and interpreted as geologic lineaments. The lengths vary between 1 to 21 km and they are oriented in all azimuth but the main directions are: N-S, NE-SW and NW-SE (Figure 10(b)). On a basis of geometric characters, three types of linea-ments have been identified: 1) concordant linealinea-ments, 2) secant linealinea-ments and 3) upsetting lineaments (Figure 10(a) and Figure 10(c)). Concordant linea-ments are parallels to certain linear faults and are interpreted as the brittle fault, Secant lineaments correspond to quartz veins in the field and upsetting linea-ments correspond to the corridors of ductile deformation (shear zones). Most of the lineaments or faults correspond to the drainage network and contacts between rock units, so they are easy to trace. The topologic relationship based on the closeness between lineaments and gold signs and mining pits shows that Kambele mining sites is situated along the shear zones with a lot of li-neament intersections; the Djengou mining pits is found on secant lili-neaments at about 0.2 km of shear zone, the Kambele III, Bakassi, Kapso, Amorcelin, Ngordjia and Grand bateau mining pits are situated less than 1km of secant li-neaments.
The technique used yields an effective and faster way to evaluate lineaments in the estimated directions. However, it requires manual features extraction, there-fore subjective and laborious. There is a possibility that some lineaments are sometimes neglected. Thereafter, the lineament density map was rasterized using ArcGIS. Many of the lineament features interpreted from the various filtered were fields observed.
4.3. Lithological Discrimination
DOI: 10.4236/jgis.2019.116046 777 Journal of Geographic Information System Figure 10. Linear map of the Batouri area extracted from satellite imagery. (a) Significant geological structures map. (b) Rose diagram of distribution of the directions of the lineaments. (c) Dem-Kambele mining area zoom lens.
Figure 11. Batouri main lithological units map obtained from the combined field-based data, remote sensing methods and GIS tools showing the distribu-tion of rock outcrops and gold occurrences.
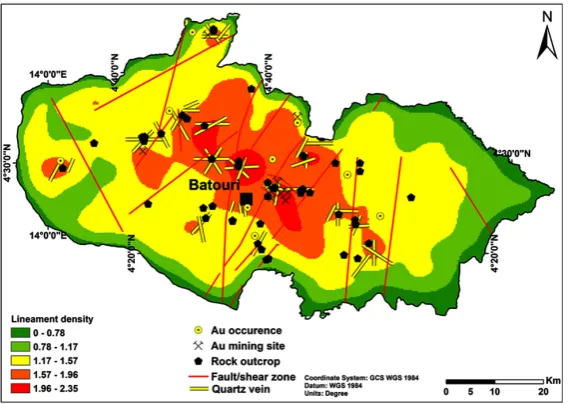
4.4. Relationship between the Density of Lineaments, Gold
Occurrences, Faults/Shear Zones, Outcrops and Lodes
[image:12.595.235.513.321.517.2]DOI: 10.4236/jgis.2019.116046 778 Journal of Geographic Information System - The majority of gold signs and rock outcrops are associated with faults/shear
zones corresponding on field to the areas of mylonitization.
- The sector ofhigh gold mineralization is the area with the highest lineaments density; that is what makes Kambele the biggest mining camp within the Ba-touri gold district where many gold mining pits are encountered.
[image:13.595.223.508.235.437.2]- The gold mineralization is concentrated and disseminated; the lineaments density is well represented on field by abundance of azimuthal quartz veins. The Batouri gold District is quit vast because occurrences are found every-where and someevery-where else; researches carry out in the area have to be ex-tended out of this area.
Figure 12. Correlation between lineament density, faults/shear zone, gold oc-currence, lode and outcrops.
5. Discussion
The Batouri area has had many previous works in geological, geophysical and hydrological domain at the local [1]-[6] [22] [23] and at the regional scale [6] [23]. The current study has shown that, as mentioned by other authors, the ge-ology of Batouri area is much variable and it is characterized by alkali granitoids highly deformed in shear zones.
DOI: 10.4236/jgis.2019.116046 779 Journal of Geographic Information System granite and alkaline granite represent the granitoids crosscut by shear zones, faults and quartz veins in which gold mineralization is concentrated or dissemi-nated.
Moreover, the result obtained from lineaments studied in the area also tempts to show three types of lineaments: concordant, secant and upsetting lineaments. Most mining pits are located near secant lineaments assuming that they are the host of gold mineralization. Those observations let us propose the metallogenic model essentially based on distribution of gold according to lineaments.
In fact, during the emplacement of panafrican belt, the structural evolution at Batouri is characterized by a first episode of migmatization, granitization and the emplacement of plutonic rocks along dextral NE-SW fault during the first deformation phase D1. This phase is equivalent to the D3 dextral shear move-ment developed along the Central Cameroon shear zone (CCSZ). The second episode of deformation phase D2 consists to replay of dextral NE-SW faults in sinistral motion. It is marked by SW-NE trending ductile-brittle sinistral shear zones occupied by mylonites, associated with gold mineralization, which mainly cut granodiorite, syeno-monzo granite and alkaline granite plutons. At last, the third deformation phase D3 is attributed to the intrusion of barren quartz veins and pegmatite dykes.
Likewise, the result also shows the high density of lineaments and its hetero-geneity. Both first lineaments characteristic are directly dependent on the degree to which the rocks have been fractured. So, the heterogeneity of density is not linked to the rock types but, rather to the variability of brittle degree. Admitting that this study agrees with [5], it can be confirmed that the lineaments are asso-ciated with faults and it is also obvious that heavy capacity of lineaments occur-rences is within the Batouri town and its surroundings. Thus, using the hypothe-sis that the lineaments correspond to the brittle structures in the rocks, precisely faults, dykes, quartz veins and dry joints and due to the relationship between gold occurrences and fractures, the highest density denote therefore the areas of high gold mineralization. The number of gold occurrences increases with lithol-ogy; granodiorite is the greatest gold host as seen at Kambele, then syeno-mon- zogranite at Tikondi and tonalite at Dimako II with neighbouring localities; the characteristics of quartz veins and altered wall rock in the Batouri gold district are suggestive of structural and lithological controlled of lode gold mineraliza-tion.
DOI: 10.4236/jgis.2019.116046 780 Journal of Geographic Information System only NE-SW (N035˚) and NW-SE has been interpreted by [2] and [3] as ap-proximate trend of auriferous shear zones and quartz veins. The occurrence of gold signs concentrated along the shear zones could be explained by two geolog-ic phenomenons, either metamorphism/plutonism or often to brittle/ductile de-formation. Likewise, the alignment of rock outcrops could be associated with the orogeny of pan-African granitic intrusions (pan-African granitoids). From all those geological data, it is obvious that the Batouri gold is epigenetic gold set in place in orogenic setting.
6. Conclusion
The Batouri gold District has a rich geological potential favorable to host gold mineralization. The remote sensing by an analysis of a Landsat 8 OLI and a Shuttle Radar DEM permitted to generate the geological data such as main li-thological facies map, structural lineaments map and density map as the poten-tial targets for the best characterization and understanding of the geology asso-ciated to the gold mineralization in the Batouri area. The study produced and combined the geological data of the Batouri gold District area using satellite im-ageries, GIS processing and field work in order to characterize it and to contri-bute to the better knowledge of its geological setting. From the interpretation of the geomatics data combined to the field data in GIS, it’s shown that: the geology of Batouri gold District varies a lot and has a large variety of lithological facies. The gold mineralization hosts consist of four main granitic rocks namely: tona-lite, granodiorite, syeno-monzogranite and alkaline granite associated to quartz veins. The fault and shear structures defined on field by the presence of mylo-nites crosscut all those main lithological units; the three lineaments types identi-fied 1) concordant lineaments, 2) secant lineaments and 3) upsetting lineaments well correspond on the field to the faults, shear zones, dykes, quartz veins or dry joints. The number of gold occurrences increases with lithology, several mining pits are found in granodiorite of kambele, the occurrence of gold signs is con-centrated along the shear zones with a lot of lineament intersections and the high gold mineralization zones corresponds to the area of highest lineaments density. From those observations, we propose the metallogenic model essentially based on distribution of high gold occurrences according to lineaments. Thus, all these data are suggestive of tectonic and lithological control of lode gold mi-neralization in the Batouri gold district. It’s conclusive that the Batouri gold de-posit is epigenetic gold set emplaced in orogenic setting. The resulting geological information’s can be used for the mining exploration or gold panning in the area, neighboring Mining districts and for the better management of geological resources by local township.
Acknowledgements
DOI: 10.4236/jgis.2019.116046 781 Journal of Geographic Information System for their contribution on his training in Remote Sensing and GIS. We gratefully acknowledge the reviewers for their critical and constructive comments on the manuscript. The authors would like to thank Haskandi Kalaza Josué for having improved the English’s quality of the manuscript.
Conflicts of Interest
The authors declare no conflicts of interest regarding the publication of this pa-per.
References
[1] Suh, C.E., Lehmann, B. and Mafany, G.T. (2006) Geology and Geochemical Aspects of Lode Gold Mineralization at Dimako-Mboscorro, SE Cameroon. Geochemistry:
Exploration, Environment, Analysis, 6, 295-309.
https://doi.org/10.1144/1467-7873/06-110
[2] Suh, C.E. (2008) Sulphide Microchemistry and Hydrothermal Fluid Evolution in Quartz Veins, Batouri Gold District (Southeast Cameroon). Economic Geology Unit, University of Buea, Buea, Cameroon.
[3] Assaah, V.A. (2010) Lode Gold Mineralisation in the Neoproterozoic Granitoids of Batouri Southeastern Cameroon. Clausthal University of Technology, Clausthal- Zellerfeld, Germany, 202p.
[4] Assaah, V.A., Zoheir, B., Lehmann, B., Freid, D., Burgess, R. and Suh, C.E. (2015) Geochemistry and Geochronology of the ~620 Ma Gold-Associated Batouri Grani-toids, Cameroon. International Geology Review, 57, 1485-1509.
https://doi.org/10.1080/00206814.2014.951003
[5] Vishiti, A., Suh, C.E., Lehmann, B., Egbe, J.A. and Shemang, E.M. (2015) Gold Grade Variation and Particle Microchemistry in Exploration Pits of the Batouri Gold District, SE Cameroon. Journal of African Earth Sciences, 111, 1-13.
https://doi.org/10.1016/j.jafrearsci.2015.07.010
[6] Ngoumou, P.C., Marie-Louise Clotilde, O.A., Alou Marcelin, B.B., Joseph Antoine, W.K., Olivier Ulrich Igor, O.A. and Mbarga, T.N. (2016) Evidence by Multi-Scale Analysis of Lineaments Derived from Gravity Anomalies in the Batouri Area (East-ern-Cameroon). International Journal of Science and Research, 5, 2319-7064.
https://doi.org/10.21275/v5i2.NOV161206
[7] Scanvic, J.Y., Delpont, G. and King, C. (1985) Structural and Geobotanical Contri-bution of Remote Sensing to Exploration of Hidden Deposits in Brittany (France). BRGM, Service Géologique National, Rapport Final du projet CEE MSM 037F, 151 p.
[8] Van Schmus, W.R., Oliveira, E.P., da Silva Filho, A.F., Toteu, S.F., Penaye, J. and Guimarães, I.P. (2008) Proterozoic Links between the Borborema Province, NE Brazil, and the Central African Fold Belt. Geological Society, London, Special Pub-lications, 294, 69-99.https://doi.org/10.1144/SP294.5
[9] Ngako, V., Affaton, P., Nnange, J.M. and Njanko, T. (2003) Pan-African Tectonic Evolution in Central and Southern Cameroun: Transpression and Transtension during Sinistral Shear Movements. Journal of African Earth Sciences, 36, 207-214.
https://doi.org/10.1016/S0899-5362(03)00023-X
DOI: 10.4236/jgis.2019.116046 782 Journal of Geographic Information System
[11] Dumont, J.F. (1986) Identification par télédétection de l’accident de la Sanaga (Ca-meroun): Sa position dans le contexte des grands accidents d’Afrique Centrale et de la limite nord du craton congolais. Géodynamique, 1, 13-19.
[12] Toteu, S.F., Penaye, J. and Djomani, Y.P. (2004) Geodynamic Evolution of the Pan-African Belt in Central Africa with Special Reference to Cameroon. Canadian Journal of Earth Sciences, 41, 73-85.https://doi.org/10.1139/e03-079
[13] Tanko-Njiosseu, E.L., Nzenti, J.P., Njanko, T., Kapajika, B. and Nédélec, A. (2005) New U-Pb Zircon Ages from Tonga (Cameroon): Coexisting Eburnean-Transa- mazonian (2.1 Ga) and Pan-African (0.6 Ga) Imprints. Comptes Rendus Geos-ciences, 337, 551-562.https://doi.org/10.1016/j.crte.2005.02.005
[14] Toteu, S.F., Penaye, J., Deloule, E., Van Schmus, W.R. and Tchameni, R. (2006) Di-achronous Evolution of Volcanosedimentary Basins North of the Congo Craton: Insights from U-Pb Ion Microprobe Dating of Zircons from the Poli, Lom and Yaoundé Groups (Cameroon). Journal of African Earth Sciences, 44, 428-442.
https://doi.org/10.1016/j.jafrearsci.2005.11.011
[15] Gazel, J. and Gérard, G. (1954) Carte géologique de reconnaissance du Cameroun au 1/500 000, feuille Batouri-Est avec notice explicative. Memoir. Direction Mines Géologie, Yaoundé, Cameroon.
[16] Tchakounté, J., Eglinger, A., Toteu, S.F., Zeh, A., Nkoumbou, C., Mvondo-Ondoa, J., Penaye, J., de Wit, M. and Barbey, P. (2017) The Adamawa-Yadé Domain, a Piece of Archaean Crust in the Neoproterozoic Central African Orogenic Belt (Bafia Area, Cameroon). Precambrian Research, 299, 210-229.
https://doi.org/10.1016/j.precamres.2017.07.001
[17] Saha-Fouotsa, A.N., Vanderhaeghe, O., Barbey, P., Eglinger, A., Tchameni, R., Zeh, A., Tchunte, P.F. and Nomo, E.N. (2019) The Geologic Record of the Exhumed Root of the Central African Orogenic Belt in the Central Cameroon Domain (Mbé- Sassa-Mbersi Region). Journal of African Earth Sciences, 151,286-314.
https://doi.org/10.1016/j.jafrearsci.2018.12.008
[18] Kamwa, N., Tchakounte, J.N., Nkoumbou, C., Owona, S., Tchouankoue, J.-P. and Mvondo Ondoa, J. (2018) Petrology and Geochemistry of the Yoro-Yangben Pan- African Granitoid Intrusion in the Archaean Adamawa-Yade Crust (Sw-Bafia, Ca-meroon). Journal of African Earth Sciences, 150, 401-414.
https://doi.org/10.1016/j.jafrearsci.2018.11.004
[19] Castaing, C., FeyBesse, J.L., Thieblemont, D., Triboulet, C. and Chevremont, P. (1994) Palaeogeographical Reconstructions of the Pan-African/Brasiliano Orogen: Closure of an Oceanic Domain or Intracontinental Convergence between Major Blocks. PrecambrianResearch, 69, 327-344.
https://doi.org/10.1016/0301-9268(94)90095-7
[20] Toteu, S.F., Van Schmus, R.W., Penaye, J. and Michard, A. (2001) New U-Pb and Sm-Nd Data from North Central Cameroon and Its Bearing on the Pre-Pan-African History of Central Africa. PrecambrianResearch, 108, 45-73.
https://doi.org/10.1016/S0301-9268(00)00149-2
[21] Ngako, V., Affaton, P. and Djonfang, E. (2008) Pan-African Tectonics in North-western Cameroon: Implication for the History of Western Gondwana. Gondwana Research, 14, 509-522.https://doi.org/10.1016/j.gr.2008.02.002
DOI: 10.4236/jgis.2019.116046 783 Journal of Geographic Information System
[23] Zanga-Amougou, A., Ndougsa-Mbarga, T., Meying, A., Yufenyu Layu, D., Biko-ro-Bi-Alou, M. and Manguelle-Dicoum, E. (2014) 2.5D Modeling of Crustal Struc-tures along the Eastern Cameroon and Western Central African Republic Derived from Finite Element and Spectral Analysis Methods. Geophysica, 49, 75-97. [24] Ouattara, G., Barthélemy Koffi, G. and Yao, A.K. (2012) Contribution des images
satellitales Landsat 7 ETM+ à la cartographie lithostructurale du Centre-Est de la Côte d’Ivoire (Afrique de l’Ouest). International Journal of Innovation and Applied Studies, 1, 61-75.