© 2019, IRJET | Impact Factor value: 7.211 | ISO 9001:2008 Certified Journal | Page 2497
Identification and Analysis of Accidental Blackspots on NH-48
Pritam Kashid
1, Yugandhar Shinde
2, Siddhant Dhavare
3, Hrishikesh Pokharkar
41,2,3,4
Student, Department of Civil Engineering, JSPM’s Rajarshi Shau College of Engineering, Pune,
Maharashtra, India.
---***---Abstract -
India is a vast country; highway plays animportant role in development of nation’s progress. As national highways are the veins of transportation system within the country so they have to be safe against accidents. National highways carry humans and materials from one place to another at greater speed. Increase in number of vehicles on roads has increase the possibility of accidents. Causes of accidents can be broadly categories into two types’ i.e. subjective factors and objective factors. Subjective factors mainly refer to influences of psychological condition of drivers and pedestrian on roads whereas objective factors refer to roads conditions, geometry of road, etc which are related to engineering perspective. The subjective factors (psychological factors) cannot be controlled by external means but the objective factors can be controlled by applying various remedial measures. So in this paper, objective factors are being analysed and explained along with a supplementary visual road survey and remedial measures. For the analysis of accidental black spots primary and secondary data was collected. Primary data was collected by conducting physical survey on NH-48 and secondary data (Existing data) was collected from national highway authority of India (NHAI) for two year (2017-2018). Then primary and secondary data was analysed by ranking method, weight severity method and accidental density method and accidental black spots were detected on NH-48. Then the remedial measures can be suggested at respective accident prone zone after conducting different surveys. The remedial measures if not able to eliminate accidents to zero shall be able to reduce accidents to the bare minimum. The study of accidental black spots revolves around road safety study as they are an interlinked topic and thus if road safety is satisfied then apparently it is going to reduce the rate of accidents. This reduction in rate of accidents hence shall nullify an accidental black spot if any. Accidental prone areas are thus to be checked for absence of the safety norms and thus carrying out corrections in the existing road design or road condition to fulfill safety aspect. Indian National Highways are thus to be engineered considering all these inputs related to safety and design standards.
Key Words
:
Accidental Black spots, NH-48 (National
Highway 48), Ranking Method, Severity, Index Method, Accidental density method.
1. INTRODUCTION
Accidental black spots can be defined as the location on the road section where the possibility of accident is high or
where accident occurs frequently. In recent years road safety has become a major concern throughout the globe. Therefore road safety is very important in present scenario. In Maharashtra, there were 3577 fatal accidents and 9396 grievous accidents took place on national highways (As per National Crime Records Bureau 2015 report). The identification, analysis and treatments of accidental black spots are most effective approach to road accident prevention.
Maharashtra is one of the fastest growing states in India. The main reason for its development is due to wide spread network of road. This road network helps for better and faster transportation of commodities within state that supports the development of state. As the population increases, the numbers of vehicles also increases which leads to increase in accidents thus this hampers the development of state. To avoid the accidents on the highways, study has to be carried out to detect the accident prone zone and by applying remedial measures to that particular section of road. In an effort to reduce the rate of accidents and to improve overall road conditions and driving experience for the road users a formal safety performance examination called the Road Safety Audit Report is carried out every year by National Highways Authority of India. This helps in accessing the collision potential of various newly constructed and existing roads thus helping in improvement and maintaining these roads.
The major purpose of this report is to- 1) Minimizing the occurrence of crashes. 2) Reducing injury in accident.
3) Ensuring safety criteria have been met in design of roads
4) Encompassing safety of every road user.
Thus we can summarize the main aim of the Road Safety Audit Report is to ensure that all new highway and existing schemes operate as safely as possible. This means that safety should be considered throughout the whole preparation and construction of any project. As road safety is a major concern and a matter of death and life it is an integral part during analysis of accidental black spot.
2. LITERATURE REVIEW
© 2019, IRJET | Impact Factor value: 7.211 | ISO 9001:2008 Certified Journal | Page 2498
method. They had used accidental severity index method for identification of accidental black spot in Cochin City. For the analysis of black spot three years accidental data has been referred. After analysis of this data they had found that Cheranallur signal was most vulnerable accidental prone area and road site.
In 2017, Landge and Mohan used weighted severity indexto identify the accidental prone location along Amravati-Nagpur road stretch from Asian Highway 46. The top five spots were selected as black spot as per WSI value from the collected data and methodology. Depending upon the black spots the remedial measures were suggested.
In 2015, Sorate, Kulkarni, Bobade, Patil, Talathi, Sayyad and Apte identified accident black spots on NH 4(New Katraj Tunnel to Chandani chowk). The main purpose was to find the accidental black spot by collecting secondary data from National highway Authority of India (NHAI) and police data, conducting physical survey (primary data) and analysis this data by method of ranking and severity index, accident density method and weight severity index.
In 2011, Naidu, Venkat and Vamsi identified and analyzed black spots on NH5-Visakhapatnam (India). The data had been collected from the police station for consequent 3 years from 2008 to 2010. Preliminary analysis revealed that there are five black spots in given stretch of road. This study attempted to identify the accidental black spots by calculating the percentage of accident occurring at a particular location.
In 2010, Thube studied the rural highways and found out various causes of accidents and also suggested the remedial measures. The identification of the accident-prone areas was done by the PWD as per the data obtained from local police station. These locations were classified based on the severity of accidents. Further the type of remedial measure to be adopted at these locations was mentioned.
3. SCOPE AND OBJECTIVE
To identify the accidental prone areas on the NH48 extending from Bhujbal Chowk ( Wakad Brige) to Chandani Chowk having a length 12 km while taking into consideration following objectives –
1. Inspecting the roads by visual survey for identifying possible physical characteristics along with other independent characteristics resulting in the formation of accidental prone situations at a particular spot developing a potential accidental black spot.
2. Analysing the data in reference to data collected from NHAI and confirming the accidental causes to the on field survey conducted.
3. Providing suitable remedies to the discovered causes of accidents at the confirmed black spots and thus aiming to reduce the accidents thereby rendering the black spot inactive.
4. STUDY AREA
The study area was selected in Pune region through which National Highway-48 passes and for study purpose the 12 km stretch of road was selected between bhujbal Chowk (Wakad Bridge) (18◦35’31”N, 73◦45’46”E ) to Chandani Chowk
(18◦30’28”N, 73◦47’1”E).
5. METHODOLOGY
Methodology mainly included collection of existing data and visual survey. There are generally two methods for identification of black spot which are as follows:-
I. Exisitng data collection
© 2019, IRJET | Impact Factor value: 7.211 | ISO 9001:2008 Certified Journal | Page 2499
sequentially arranged with the chainage of 1000M. The accidental data was summerized including the locationof accident, nature of accident, classification of accident and the type of casualities along with summary of accidents. Then data was analysised by different methods which are
i. Method of ranking and severity index ii. Accidental density method
iii. Weighted severity method
II. Visual Survey
Here data regarding road conditions was confirmed by carrying out visual inspection of the onsite conditions.The visual survey is carried out in two distict stages as given-
a. Selecting parameter is one of the most crusial step to investigate the accidental blackspot.The two type of parameters namely subjective and objective are to be considered;our study only undermines the consideration of objective parameters.The reason for only considering the objective parameter is that they are the only one that we can control by applying engineering solutions according to the road standards.The parameters can be selected from various sources such as; (i) Studing international journal paper, (ii) By communicating with road users and (iii) By experts’ opinion.
b. Physical survey on road is the actual survey that has to be conducted onsite. The road has to be divided into various small chainages and visually the parameters which are selected have to be scrunitized at that perticular chiange. This data can be analyzied by (i) method of ranking and (ii) method of severity index. The data acquaired from the procedure mentioned above can be analysised through different methods and these methods also differe for Existing Data and the data acquaired from visual survey.
A. For Existing Data
for analysis of exisiting data, the data was seggregated into different categories.
a) Nature of accidents :- i) Overturning, ii) Head on collisions, iii) Rear end collisions, iv) Collisions brush, v) Right turn collisions,vi) Skidding
b) classification of accident:- i) Fatal, ii) Grevious injury, iii)Minor injury, iv)Non injury
1. Method of Ranking and severity index
The causes of accidents in existing data was given below as
i. Overturning ii. Head on collisions iii. Rear end collisions iv. Collisions brush
v. Right turn collisions vi. Skidding
These 6 parameters were selected for analysis of existing data by mehtod of ranking and severity index.
Step 1:- Ranking method is logical method of analysing accidental black spot. In ranking method, out of 6 parameters, the most predominant parameter that casuses accidents is given top rank and the parameters which are responsible for lesser occurance of accidents are given lesser rank. If the parameter exsist at perticular chainage it is mark as ‘Y’ and if the parameter is absent then it is marked as ‘N’. Accordingly all the parameters at the selected strech of road is marked. Depending upon the higher number of ‘Y’ the parameter is given top rank and as the number ‘Y’ decreases the rank descends.
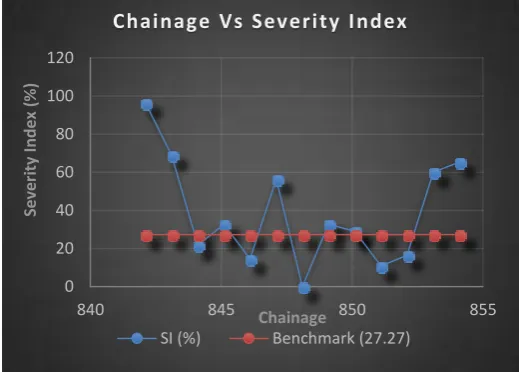
Step 2:- Severity Index denotes vulnerability of a particular spot to accidents. In severity index, the weight has to be assign to parameters. The parameter which has top rank has to be assigned with the larger weight. For example, out of 6 parameters if 4th parameter has top rank then it has to assign with highest weight i.e 6. Then for individual parameters the severity index is calculated by following formula
SI=
Where,
W = W1+W2+W3...+Wn
Step 3:- Severity index benchmark
The severity index value above severity index benchmark is considered as the accidental black spot. To calculate the benchmark the top 3 parameters weights are selected and divided by the weights of all parameters. Then the value is express in the form of percentage and subtracted from 100 to obtain severity index benchmark.
Table No 1:- Observation table for Identification of Black Spot on NH48 (Nature of Accidents).
Sr
no. Chainage 1 2 3 4 Nature of accident 5 6 (SI ) (%) SI
1 852.1 N N N N N N 0 0
2 849.7 N N Y N N N 6 28.57
3 847.87 N N Y N N N 6 28.57
4 847.24 N N Y N N N 6 28.57
5 846.35 N N Y N N N 6 28.57
6 846.26 N N Y N N N 6 28.57
© 2019, IRJET | Impact Factor value: 7.211 | ISO 9001:2008 Certified Journal | Page 2500
8 843.61 N N Y N N Y 11 52.38
9 843.5 N N Y N N N 6 28.57
10 842.8 N N Y N N N 6 28.57
11 842.1 N N Y N N N 6 28.57
Yes 0 0 9 0 0 1
Ranking 3 5 1 4 6 2
Weightage 4 2 6 3 1 5
SI Benchmark 28.57
Sample calculation:-
Sum of top 3 weightage = 6+5+4= 15 W=6+5+4+3+2+1=21
SI Benchmark = 100-((15/21)x100) = 28.57 SI = (6/21)*100 = 28.57
0 10 20 30 40 50 60
840 845 850 855
SI (
%
)
CHAINAGE
Chainage Vs Severity Index
SI (%) Benchmark (28.57)
Graph No 1:- Above graph shows relationship between actual chainage and severity index. According to the graph
Accidental black spot is at 843.61 chainage.
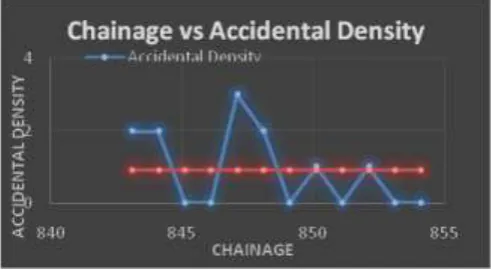
2. Accidental Density Method
Accidental density can be calculated by number of accidents per unit length of road stretch on a highway.
Step 1:- Unit length of road is to be selected and accidental data is formed in tabulated form. The total number of accidents that has occurred in selected stretch of road is calculated.
Step 2:- The accident density at particular chainage is calculated by calculating numbers of accidents at that chainage per unit length of road.
Step 3:- Accidental density benchmark
The accidental density value which is above this value is considered as the accidental black spot. Accidental density benchmark can be calculated by dividing total number of
[image:4.595.311.557.478.613.2]accidents on selected stretch of road to number of unit length of selected stretch of road.
Table No 2:- Observation table for Identification of Black Spot on NH48 ( Actual number of accidents).
Sr. No Chainage Number of Accidents Accidental Density
1 854.1-853.1 0 0
2 853.1-852.1 0 0
3 852.1-851.1 1 1
4 851.1-850.1 0 0
5 850.1-849.1 1 1
6 849.1-848.1 0 0
7 848.1-847.1 2 2
8 847.1-846.1 3 3
9 846.1-845.1 0 0
10 845.1-844.1 0 0
11 844.1-843.1 2 2
12 843.1-842.1 2 2
Benchmark 0.9167
Sample calculation:-
Total accident =11, Unit length = 1000m Accidental density= 11/12 = 0.9167
Graph No 2:- Above graph shows relationship between actual chainage and Accidental Density. According to the
graph Accidental black spot are at 852.1-851.1, 850.1-849.1, 848.1-847.1, 847.1-846.1, 844.1-843.1 and
843.1-842.1.
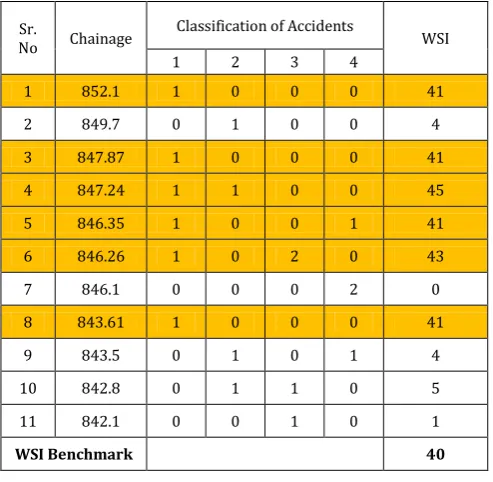
3. Weighted severity index
In this method the weights are assign are given on the basis of number and severity of accidents at that particular location. The accident is classified as:-
© 2019, IRJET | Impact Factor value: 7.211 | ISO 9001:2008 Certified Journal | Page 2501
ii) Grevious injuries (GI)
iii) Minor injuries (MI)
iv)Non injury
The weight severity index is calculate by following formula:- WSI= (41 X K) + (4 X GI) + (1 X MI)
[image:5.595.39.286.282.523.2]The location with WSI value more than 40 is termed as accidental black spot.
Table No 3:- Observartion table for Identification of Black Spot on NH48 (Classification of Accidents).
Sr.
No Chainage
Classification of Accidents
WSI
1 2 3 4
1 852.1 1 0 0 0 41
2 849.7 0 1 0 0 4
3 847.87 1 0 0 0 41
4 847.24 1 1 0 0 45
5 846.35 1 0 0 1 41
6 846.26 1 0 2 0 43
7 846.1 0 0 0 2 0
8 843.61 1 0 0 0 41
9 843.5 0 1 0 1 4
10 842.8 0 1 1 0 5
11 842.1 0 0 1 0 1
WSI Benchmark 40
Sample calculation:-
WSI = (41x 1) + (4 x 1) + (0 x 1) = 45
0 20 40
840 845 850 855
SE
V
ER
IT
Y
IN
D
EX
(
%)
CHAINAGE
Chainage Vs Severity Index (%)
SI (%) Benchmark (20)
Graph No 3:- Above graph shows relationship between acutal chainage and severity index. According to the graph Accidental black spot are at 852.1, 847.87, 847.24, 846.35,
846.26 and 843.61 .
B. For Visual Survey
There are many parameters that can cause accidents but the most perdominant parameters are selected which are as follows:-
i) Improper shoulder
ii) Visibility at junction
iii)Small subsidary road meeting at a junction or unauthorizied junction.
iv) Improper transition of roads
v)Absence of side rails.
vi)Unguarded bus-stops, roadside vendors or road encroachment
vii)Absence of sign boards, reflectors or road markings
viii)Drainage facility
ix)Road surface condition
x)Improper median or divider on road
For the analysis of visual survey method of ranking and method of severity index is use.
1) Method of Ranking
a. The parameters which are persent at perticular chainage is marked as ‘Y’ and the number of ‘Y’ is calculated.
b. The parameters with most number of ‘Y’ is given top rank and the parameters with lesser number of ‘Y’ is given lesser rank.
2) Method of Severity Index
a. weight has to be assign to each parameters. The parameters with top rank has to assign with highest weight. b. Then severity Index can be calculated by the formula given below
SI = Where,
W = W1+W2+W3...+Wn
© 2019, IRJET | Impact Factor value: 7.211 | ISO 9001:2008 Certified Journal | Page 2502
Table No 4:- Observartion table for Identification of BlackSpot on NH48 (Parameters).
Sample calculations :-
Sum of top 5 weightage = 10+9+8+7+6= 40 W= 10+9+8+7+6+5+4+3+2+1= 55 SI Benchmark = 100-((40/55)x100) = 27.27 SI = (36/55)*100 = 65.45
0 20 40 60 80 100 120
840 845 850 855
Sev
er
ity
In
d
ex
(
%
)
Chainage
Chainage Vs Severity Index
SI (%) Benchmark (27.27)
Graph No 4:- Above graph shows realtionship between actual chainage and severity index. According to the graph
Accidental black spots are at 854.1, 853.1, 850.1, 849.1, 847.1, 845.1, 843.1 and 842.1.
6. RESULTS AND CONCLUSION
The readings were taken on National Highway 48 spanning from Bhujbal Chowk to Chandani Chowk for a length of 12 km.
From Table No.1 only one black spot was detected using Ranking and Severity Index method .
From Table No.2 six black spots were detected using Accidental Density method.
From Table No.3 six black spots were detected using Weighted Severity Index method.
From Table No.4 eight black spots were detected using Ranking and Severity Index method.
All together 9 black spots were detected in the stretch of 12km on National Highway 48 by neglecting the recurring values of chainage in all the above tables.
The NH-48 is one of the major traffic corridors in the state which has reported 431 accidents from 2017 to 2018 as per the data acquired from National Highway Authority of India. Our studies carried out on the stretch spanning from Bhujbal Chowk to Chandani Chowk has found out that one of the major reason of accidents is the rear end collisions which occurs due to improper transition, over speeding, loss of control over vehicle and visibility at junction. The chainages 854.1, 853.1, 852.1, 850.1, 849.1, 847.87, 847.24, 847.1, 846.35, 846.26, 845.1, 843.61, 843.1 and 842.1. Thus, summing up the tally of black spot to 9 on the stretch surveyed has been quantified as accidental black spots through the analysis carried out. The NH-48 has most of the problems leading to the development of accidental black spots due to the negligence of periodic maintenance. If the authority carries out the periodic maintenances with diligence we can surely see a considerable reduction in the number of black spots in the coming future.
REFERENCES
[1] R.R. Sorate, R.P. Kulkarni, S.U. Bobade, M.S. Patil, A.M. Talathi, I.Y. Sayyad, S.V. Apte, “ Identification of Accidental Black Spots on National Highway 4 ( New Katraj Tunnel to Chandani Chowk ).”, IOSR Journal Of Mechanical and Civil Engineering, Vol. 12, PP61-67, 2015.
[2] Snehal U. Bobade, Jalindar R. Patil, R. R. Sorate, “Identification of Accidental Black Spots on National Highways and Expressways.”, International Journal Of Research in Advent Technology, 2015.
[3] LiyamolIsen, Shibu A, Saran M., “Identification and Analysis of Accidental Black Spot using Geographic Information System.”, International Journal of Innovative Research in Science, Engineering and Technology, Vol. 2, Special Issue 1, 2013.
© 2019, IRJET | Impact Factor value: 7.211 | ISO 9001:2008 Certified Journal | Page 2503
Characteristic Analysis Based on GIS.”, Journal of Geographic Information System, 2012.
[5] A.N. Dehury, A.K. Das, A.K. Pattnaik, U. Chattraj, P. Bhuyan, M. Panda, “Black Spot Analysis on National Highways.”, International Journal of Engineering Research and Applications.”, Vol. 3, Issue 3, 2013. [6] Liu Yichao, “Highway Traffic Accident Black Spot
Analysis of Influencing Factors.”, ICTE 2013 ,ASCE, 2013. [7] M Mohammed Fayaz, Mrudula S P, Sarah Jaison George, Sherin P Yoyak, Serin Sara Roy, “Black Spot Identification Using Accident Severity Index Method.”, ISSN:2394-0697,Volume-5,Issue-3,2018.
[8] Aruna D. Thube, Dattatraya T. Thube, “Accident Black Spots on Rural Highways in India: A Case Study.”, International Journal of Civil Engineering and Technology., Volume 1, Number 1,2010.
[9] Naidu. V .M., Venkat L and P. I. Vamsi, “ Identification and Analysis of Black Spots on NH5- Visakhapatnam.”, Global Journal Engineering and Applied Sciences-ISSN 2249-2623, Vol 3,2011.
[10] Athira Mohan and De. V. S. Landge, “Identification of Accident Black Spots on National Highway.”, International Journal of Civil Engineering and Technology, Vol 8, Issue 4, 2017.
[11] SnehalBobade, Anuj U. Manerikar, Devika J. Buttepatil, Prem M. Rathod,”Black Spot Analysis on National Highway-4.”, IJERT,ISSN:2278-0181, Vol 5, Issue 03,2016.
[12] S.U. Bobade, Dr. J.R. Patil, R.R. Sorate, “ Black Spot Analysis on Pune- Solapur National Highway.”, IRJET, Vol 02, Issue 03, 2015.
[13] SnehalBobade-Sorate,AnujU. Manerikar,Devika J. Buttepatil,Prem M. Rathod.”Black Spot Analysis on Pune-Bangalore National Highway.”, IRJET, Vol 03, Issue 04,2016.