E-Learning Adoption in Open Learning Programs: A
Case Study of Public and Private Universities in Jeddah
City
Sadik Ali Al-Taweel
Information Systems DepartmentUniversity of Science & Technology* Sana’a, Yemen
Abdurahman H. Al-Abdali
Information TechnologyDepartment
Open University Malaysia Malaysia
Belal Al-Fuhaidi
Computer Science DepartmentUniversity of Science & Technology Sana’a, Yemen
ABSTRACT
This research was carried out in three public and private universities in Jeddah City, Kingdom of Saudi Arabia. These universities use electronic materials in their programs. The main objective of this paper was to assess the adoption of learning in Saudi universities. A survey was conducted on e-learning activities given to students throughout their study. A structured questionnaire was designed and distributed to 154 students from the selected universities. Based on data analysis, the main findings showed that students are inadequately qualified to adopt e-learning technology in their learning life. There is an obvious weakness of students in learning through uses of technology devices. They have deep belief in traditional learning. Although the universities in Saudi Arabia have good infrastructure and funding for more projects to adopt e-learning technology and encourage students to use it, this did not work well to support and encourage students to be more familiar with and interested in e-learning techniques. This is perhaps because of the absence of legislation that may regulate the adoption process of e-learning among students. Most of the facilities that were offered by universities did not convince the students to be involved in e-learning technology. The factors that negatively affect adopting e-learning among students are the lack of computer skills, low bandwidth connectivity of the internet and high cost of more bandwidth.
General Terms
E-learning Technology, Information and Communication Technology, E-Learning Adoption
Keywords
E-learning, open programs, traditional learning, e-learning technologies, hybrid learning
1.
INTRODUCTION
Humanity passed many ages starting from pre-mechanical for the first human age to mechanical age with the industrial revolution and then to electromechanical ages which were close to our modern technology era and was the beginning of telecommunications with some important innovations like a telegraph, telephone and radio in the period of 1840 to 1940 [1].
The current age is the electronic age which starts from the large computer invented in 1940 until right now with the revolution of communication and the computer technology. This modern technology that grows fast in internet and web services encourages many sectors to invest more in technology in their working life. Education sector is one of
the fields that adopt technology as a new learning tool called distance learning that depends mainly on the internet and computer devices for dealing with electronic materials. This entails that all users of distance learning either teachers or learners have the technology and are able to use it in the learning process [2],[3].
E-learning is a new technology for education using the computer, Internet, or network. It is the ability of network technology to support skills of learning and getting knowledge. It can also be defined as electronic applications and processes which students learn [4],[5],[6].
2.
RELATED WORK
2.1
Learning
Learning continuously develops and changes rapidly from traditional learning to e-learning that delivers instructions by devices such as a desktop, laptop, tablet or even a smartphone. E-courses are available to reach asynchronous learning anytime, anywhere and developed to be self-study [7].
Learning has different definitions from simple to complex. A simple definition was provided by Atkinson who defined learning as a change that happens for permanent effect which causes the results out of practice [8]. Learning might be more specifically defined as “an individual process of changing behavioral patterns, increasing or altering mental models and processes” [9]. Educators consider learning as an active process leading to the acquisition of knowledge, which is long lasting, measurable, and specific to changes in behavior [10]. According to complex dimensions, the view of learning definition shows more and more details. In this regard, different types of learning are considered as a complex process of one of these dimensions such as the physiological dimension (related to the characteristics of learner), affective dimension (related to personality of learners in different human behavior as emotion, motivation and attention), cognitive dimension (related to logical concepts and processing information of learners) and psychological dimension (related to individual differentiation).
2.1.1
Traditional Education
Traditional classroom learning is a form of knowledge transfer in which the lecturer stands and talks in front of a roomful of people who listen, try to understand and write notes at the same time. The lecture originated from the days when printed material and copies of texts were not widely available. Nowadays, technologies allow us to copy, print, scan and digitally save materials and text with ease. Yet, traditional classroom lecturing is still one of the most common teaching methods in use today [11].
2.1.2
Non-Traditional Education
Information and Communication Technology (ICT) is the backbone of education that moves traditional education toward new education era called E-learning. E-learning is the use of information and communication technology such as computer, Internet, mobile phone, radios, televisions, LMS and other modern technology to enhance teaching and learning activities [12],[3].
2.2
Educational Technology
The concept of educational technology provides a fundamental theoretical basis for research and practice in teaching and learning [11]. Educational technology is defined as “the study and ethical practice of facilitating learning and improving performance by creating, using and managing appropriate technological processes and resources”[13].
[14] defines educational technology as a “goal oriented problem solving approach utilizing tools, techniques, theories, and methods from multiple knowledge domains, to (1) design, develop, and evaluate, human and mechanical resources efficiently and effectively in order to facilitate and leverage all aspects of learning, and (2) guide change agency and transformation of educational systems and practices in order to contribute to influencing change in society”.
2.2.1
Instructional Technology
The phenomenon of technology in education has been identified as an important issue since the huge efforts of computer technology to transform Skinner’s teaching machines was recognized in the 1960s [15]. Instructional technology is considered as educational technology, but Association for Educational Communications and Technology (1994) defined instructional technology as “the theory and practice of design, development, utilization, management,and evaluation of processes and resources for learning” [14].
2.3
E-learning Technologies
The advent of e-learning as part of the collaborative learning paradigm includes Web 2.0 technologies, which are widely used by students and are now making their way into the classroom.
Facilitators use these new techniques usefully to support their mission in classroom and strongly enhance their potential efforts in the learning process that focuses on students to get the highest level of benefit through daily activities. Different web technology that is rapidly used is known as Web 2.0 technologies such as wikis, blogs, social networks, podcasts and video-sharing sites such as YouTube, and virtual learning sites such as second life [16].
Educators and researchers always look forward to new technologies which will require adaptation by both students and instructors to be used widely and efficiently by researchers [17].
The use of technology, however, is about more than capital investment and there has to be a strategic approach to staff development and the personalization of learning through, for example, learner tracking tools, diagnostic tools and multimedia approaches that improve recruitment, retention and achievement. Technologies must be used to move teaching and learning in the classroom to new horizon and beyond. Developing tools and resources for practitioners must be a priority [18],[19].
3.
METHODOLOGY
This research is an exploratory research as it aims to explore how students can increase their attainment through using e-learning techniques inside or outside university. Also it is a quantitative research. It aims at measuring the effect of e-learning on students' attainment. It depends on gathering data about specific variables. It uses standard methods to analyze data and present results.
In this study, the strategy used is the survey because the study aims to identify the opinions of the sample about a specific topic. The data were gathered from students at three universities in Jeddah, Saudi Arabia, adopting open learning programs that depend on many e-learning techniques.
3.1
Data Collection
In this research, the data were collected through a questionnaire distributed to the students in the three selected universities inside Jeddah city in Saudi Arabia that use open learning technology.
This study used mainly a close ended questionnaire as a research tool that depends on Yes/No options with open questions that reflect the opinions of the students. The questions were formed in such a way that their answers would provide a clear view of the participants about the effect of e-learning on their attainment.
The research focused on the students who use e-learning in their study inside and outside the university via different technology tools. The targeted universities in Jeddah city in the Kingdom of Saudi Arabia use e-learning technology for open learning students.
Eight hundred questionnaires were distributed to the students in the three universities. The returned questionnaires were one-hundred and seventy-eight. Twenty-four of them were canceled as they were not answered completely. The rate of unused questionnaires was 13.48%. As shown in Table 1, most of the canceled questionnaires (18) were from King Abdul-Aziz University (KAU) and 6 of them were from Saudi Electronic University (SEU).
Table 1: Statistics of discarded questionnaires out of the total number
Site Targeted Respondent Discarded Percentage
KAU 500 110 18 16.4%
SEU 200 56 6 10.7%
JIC 100 12 0 0%
3.2
Research Population and Sampling
Population of this research was the students of open learning in three universities at Jeddah city in the Saudi Arabia i.e. King Abdul-Aziz University (KAU), Saudi Electronic University (SEU), Jeddah International College (JIC).
The sample of the research was selected from the open learning colleges inside the three universities of Jeddah city in Saudi Arabia. The population size was 800, but just one hundred fifty-four (154) were the actual sample size of the study.
[image:3.595.311.548.211.465.2]This research used a random sampling technique to target students who were studying at three universities inside the Jeddah city in Saudi Arabia. A questionnaire was distributed to students inside the campus by the researcher's relatives and friends who were studying in the universities. Table 2 indicates the scenario of questionnaire distribution in different sites of the selected. Tables 3 and 4 show the questionnaire distribution based on gender.
Table 2: Statistics of Questionnaires Distributed Classified By Site
Site Targeted Respondent Percentage
K AU 500 92 18.4%
SEU 200 50 25%
JIC 100 12 12%
Total 800 154 19.25%
Table 3: statistics of questionnaires distributed classified by Male site
Male Site Targeted Respondent Percentage
KAU 300 61 20.33%
SEU 150 36 24%
JIC 50 12 24%
Total 500 109 21.8%
Table 4: Statistics of questionnaires distributed classified by Female site
Female Site Targeted Respondent Percentage
KAU 200 31 15.5%
SEU 50 14 28%
JIC 50 0 0%
Total 300 45 15%
4.
RESULT
4.1
Data Presentation
A summary of respondents' results based on the analysis of the first part of the questionnaire about the personal information as shown in Table 5 indicates that most of the respondents were males (109) with 70.8% while the rest were (45) with 29.2%.
The age of most respondents (77.3%) ranged from 15 to25 whereas the age of the rest (32.7%) was distributed into two
categories. The first category (20.1%) represents respondents whose age ranged from 26 to 30. The second category (12.6%) represents respondents of more than 30 years.
The findings also showed that the highest rate of respondents (78.6%) was for those who have occupation. The rest (21.4) who have employees, free bossiness and others represent 11%, 6.5% and 3.9%% respectively. Most of the respondents (113) with 73.4% had no income; 31 respondents with 20.1% received a salary ranged from $550 to $1000; five respondents with 3.2% received $100 to $500 and five respondents with 3.2% received more than $1000.
Table 5: personal information of respondents
Variable Item No. %
Gender Female
Male
45
109
29.2
70.8
Age 15 – 20
21 – 25
26 – 30
Older than 30
40
79
31
4
26
51.3
20.1
2.6
Occupation Student
Employee
Free Business
Others
121
17
10
6
78.6
11
6.5
3.9
Monthly Income
No income
100-500$
550-1000$
More than 1000$ 113
5
31
5
73.4
3.2
20.1
3.3
4.2
Information about Students Study
The results based on the analysis of the second part of the questionnaire as shown in Table 6 indicate that most of the respondents (93.5%) were studying in the Kingdom of Saudi Arabia, while the rest were distributed in Africa (0.7%) and other countries (5.8%). Open learning programs in Saudi Arabia are offered in administrative and humanities fields.
The findings show that the participants belonged to different majors such as administrative sciences, humanity & social sciences, Islamic & Arabic study and others got 51.3%, 22.1%, 10.4% and 16.2% respectively.
Most of the respondents (51.3%) belonged to administrative sciences. Also, the majority of the respondents (64.3%) were in the first year while the respondents in second and third years were 24%; the rest (11.7%) were in the fourth year or higher levels.
[image:3.595.66.268.303.396.2]Table 6: Result of the respondent views classified as study information
Variable Item No. %
Study Location
Saudi Arabia
Africa
Other
144
1
9
93.5
0.7
5.8
Study Field
Administrative Sciences
Humanity & Social Sciences
Islamic & Arabic Study
Other
79
34
16
25 51.3
22.1
10.4
16.2
Study Years Count
1
2-3
4
More than 4
99
37
10
8
64.3
24
6.5
5.2
Highest Degree
PhD
Master
Bachelor
Diploma & Less
2
2
5
145 1.3
1.3
3.2
94.2
4.3
Students’ Educational Activities
4.3.1
Students’ Attendance
Figures 1 and 2 show the attendance of the students during their study in the open learning program. Most of the students (54) with (35%) attended more than 5 times. Other students (between 40 and 48) attended one to two or three-to-four times. Some other students (8%) were completely not interested in attendance.
4.3.2
Using e-learning Technologies during Study
Figures 3 and 4 show the visual view of students' utilization of e-learning technologies during their study at colleges. The findings show a high rate of the students' use of e-learning technologies during their study because most of the students (59 and 51) represent high and middle levels with 71%.4.3.3
Spending Time on Internet for Learning
Purposes
Figures 5 and 6 show that students spend long time using the Internet. Sixty nine students with (45%) spent more than two hours daily while 63 students with (41%) spent from one to two hours. Only 5 students with 3% spend fifteen to thirty minutes on the Internet. Seventeen students with (11%) used the Internet less than fifteen minutes a day.
[image:4.595.57.280.88.384.2]Figure 1: Students’ attendance in face-to-face class
[image:4.595.54.281.91.382.2]Figure 2: Rate of the students’ attendance in face-to-face class
[image:4.595.318.542.491.602.2]Figure 3: Number of the student's e-learning utilization
Figure 4: Rate of the student's E-learning utilization
Figure 5: Time in hours which student spend on Internet
54 41
47 12
2
Student Attendance
5 to 7 3 to 4 1 to 2 Never
59 51
29 15
1
Using e-learning
Technologies During …
[image:4.595.324.534.625.737.2]Figure 6: Rate of the student spending time on Internet
4.4
Student Experience
4.3.1
Students Computer Skills
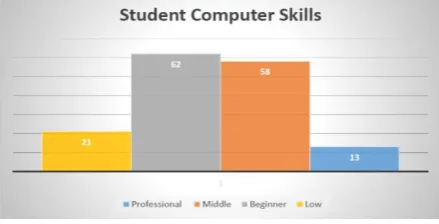
[image:5.595.317.543.74.186.2]According to Figures 7 and 8 students do not have sufficient computer skills. Sixty two of the samples, with (40%), possess basic computer skills. Fifty eight students with (38%) had moderate computer skills. Twenty one students with (14%) had professional computer skills. The least number of students (13) with (8%) had low level of computer skills
Figure 7: Student level of computer technology skills
4.3.2
Computer Application Programs used by
Students
Figures 9 and 10 show the computer application programs that student's use frequently. Sixty students with (39%) deal with browsers and operating systems. A similar number of students used Microsoft application programs such as Word, Excel, PowerPoint, etc. Twenty one students with (14%) used web technology. The rest of respondents (13) with (8%) did not use the above technology tools.
Figure 8: Rate of the student computer skills
4.3.3
Students e-learning Skills
Figures 11 and 12 show students' e-learning skills. Ninety students with (58%) have beginner level of e-learning skills. Forty three students with (28%) have low skills of e-learning. Twenty students with 13% have moderate skills in e-learning. Only one student has professional skills
Figure 9: Student experience in main field of computer
Figure 10: Rate of the student experience in different computer fields
Figure11: Student level of e-learning skills
Figure12: Rate of the student e-learning skills
4.5
Students Preference of the Learning
type
4.3.4
Students Hybrid Learning Preference
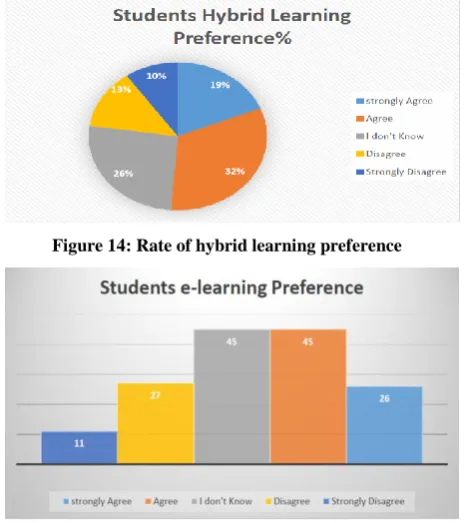
Figures 13 and 14 show the students' preferences of the learning type i.e. e-learning and traditional. [image:5.595.57.277.305.417.2]4.3.5
Students e-learning Preference
Figures 15 and 16 show the students' preferences of the e-learning. Fifty six students with (36%) preferred e- learning whereas (53) students with (35%) did not prefer e- learning. The rest of students (45) with (29%) were indecisive.
[image:6.595.58.276.205.329.2]4.3.6
Students Traditional Learning Preference
Figures 17 and 18 show the students' preferences of the traditional learning. Fifty four students with (35%) preferred traditional learning whereas (89) students with (58%) did not prefer traditional learning. The rest of students (11) with (7%) were indecisive.Figure 13: hybrid learning Preference
4.6
Evaluation of e-learning vs. Traditional
Learning.
[image:6.595.318.541.239.547.2]Figures 19 and 20 show the evaluation of e-learning compared to traditional learning. Sixty four students with 41% perceived that traditional learning i.e. face to face attendance is better for increasing students' attainment than e- learning whereas 35 students with 23% perceived that e- learning is better than traditional learning for students' attainment. Twenty four students with 16% believed that hybrid learning method is better than using e-learning or traditional learning separately. The rest of students (31) with 20% were indecisive.
Figure 14: Rate of hybrid learning preference
Figure 15: Student e-learning Preference
4.7
Factors Affecting e-learning Usability
Figure 21 shows the factors that affect the efficiency of the students in using e-learning materials. Twenty eight percent of the students suffered from the bad service of the Internet that badly affects using e-learning technology. The absence of investment sources in e-learning technology in education sectors affected 20% of students. The lack of the management to implement e-learning technology affected 14% of the students’ use of e-learning. The lack of students' knowledge about e-learning technology was revealed by 10% of the students. Some other factors that affect 8% of the students' e-learning usability include students' capability, the e-learning environment and inefficient effort to implement e-learning technology. Team Work is also a factor revealed by 4% of the students that affects e-learning technology.
Figure 16: Rate of Student e-learning Preference
Figure 17: Student Traditional learning Preference
[image:6.595.53.286.477.739.2]Figure 19: Student Increase ability for Educational Attainment
4.8
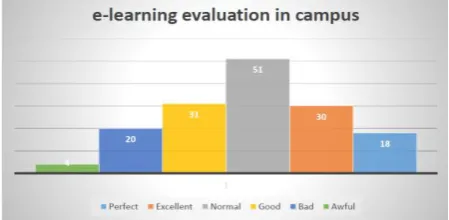
E-learning Evaluation in Campus
[image:7.595.58.278.75.184.2]Figures 22 and 23 show students e-learning evaluation in campus. Fifty one respondents with 33% were neither optimistic nor pessimistic with e-learning technology. The responses of these students were normal. Seventy nine students were optimistic and their views are classified into perfect, excellent and good represented by the numbers 18 (12%), 30 (19%) and 31(20%) respectively. Twenty four students were pessimistic and their views are classified into bad and awful represented by the numbers 20 (13%) and 4(3%) respectively.
[image:7.595.54.285.345.589.2]Figure 20: Rate of Increase ability for Educational Attainment
Figure 21: Rate of factors that affect e-learning usability
Figure 22: Student e-learning evaluation in campus
Figure 23: Student e-learning evaluations in campus
5.
DATA ANALYSIS
There are some elements that support e-learning techniques in Saudi universities. Some of these elements are related to the students, and some others are either related to the university or to the government. The electronic tools used by students in or out campus is the key element that affects students' e-learning. The government has made efforts to encourage students to enroll themselves in open universities that support e-learning technologies.
[image:7.595.309.548.456.663.2]Table 7 shows that the most important tools used by students to support using e-learning technologies in the universities include internet, office software and Google searching engine or YouTube which are represented by 93%, 91% and 91%, respectively. On the other hand, other tools related to learning facility such as Multimedia, CD-DVD, LMS, Virtual Class got less percentage with 57%, 27% and 24%, respectively. The advanced tools related to experience in using e-learning technology such as intranet, video tape and video conference got the least percentage with just 8%, 7%, and 1%, respectively.
Table 7: e-learning technology tools used by student in the selected Saudi Universities
No. e-learning technology tools Freq. %
1 Internet 143 93
2 Office application (word – excel – PowerPoint)
140 91
3 Browsing on search engine or YouTube
or social media 140 91
4 Computer or Laptop or smartphone 136 88 5 Multimedia (Audio – Video – Image) 86 56
6 CD-ROM or DVD 42 27
7 Web-based learning or LMS 37 24
8 Satellite & TV 20 13
9 Virtual learning networks or Virtual classes
16 10
10 Intranet and extranet 13 8
11 Video Tape & Cassette 11 7
12 Video conferencing 1 1
Tables 8, 9 and 10 present details of the study results in the three universities (King Abdul-Aziz University, Saudi electronic university and Jeddah international college).
[image:7.595.55.280.621.731.2]such as video conferencing, satellite, TV, Video tape and cassette as shown in Table 9.
Similarly, as shown in Table 10, most of the respondents in SEU are more interested in ordinary tools related to daily use of Internet such as smartphone, internet and office applications (Word-Excel-PowerPoint). Video conferencing, video tape and cassette, and intranet and extranet are the tools used by the least number of respondents.
Table 11 shows that most of the respondents in the three universities use the same e-learning tools such as office applications, computer devices and Internet which are consider as the least used tools compared to other previous tools.
[image:8.595.309.548.90.303.2]Also table 11 shows that the most used e-learning tools in all the three universities compared to the previous tools are Internet and office applications; while some other tools such as computer, laptop or smartphone e-learning technologies which disappear in KAU. Tools such as search by Google and YouTube appear in KAU.
Table 8: e-learning technology tools used by student in King Abdul-Aziz University
No. e-learning technology tools Freq. %
1 Browsing on search engine or YouTube or social media
88 57
2 Internet 88 57
3 Office application (word – excel – PowerPoint)
88 57
4 Computer or Laptop or smartphone 88 57
5 Multimedia (Audio – Video – Image) 58 38
6 CD-ROM or DVD 17 11
7 Web-based learning or LMS 17 11
8 Virtual learning networks or Virtual classes
8 5
9 Intranet and extranet 8 5
10 Video Tape & Cassette 8 5
11 Satellite & TV 7 5
12 Video conferencing 1 1
Table 9: e-learning technology tools used by student in Saudi Electronic University
No. e-learning technology tools Freq. %
1 Computer or Laptop or smartphone 43 28
2 Internet 40 26
3 Office application (word – excel – PowerPoint)
40 26 4 Browsing on search engine or YouTube
or social media
40 26
5 Web-based learning or LMS 21 14
6 CD-ROM or DVD 18 12
7 Multimedia (Audio – Video – Image) 15 10
8 Satellite & TV 10 6
9 Virtual learning networks or Virtual classes
6 4
10 Intranet and extranet 5 3
11 Video Tape & Cassette 4 3
12 Video conferencing 0 0
Table 10: e-learning technology tools used by student in Jeddah International College
No. e-learning technology tools Freq. %
1 Office application (word – excel –
PowerPoint) 12 8
2 Computer or Laptop or smartphone 12 8
3 Internet 12 8
4 Browsing on search engine or YouTube or social media
8 5
5 Multimedia (Audio – Video – Image) 7 5
6 CD-ROM or DVD 7 5
7 Virtual learning networks or Virtual classes
5 3
8 Web-based learning or LMS 2 1
9 Satellite & TV 2 1
10 Intranet and extranet 0 0
11 Video Tape & Cassette 0 0
[image:8.595.307.548.97.301.2]12 Video conferencing 0 0
Table 11: e-learning technology tools used by student in Saudi Universities
No. KAU SEU JIC
1
Browsing on search engine or
YouTube or social media
Computer or Laptop or smartphone
Office application (word – excel –
PowerPoint)
2 Internet
Internet
Computer or Laptop or smartphone
3
Office application (word – excel –
PowerPoint)
Office application (word – excel –
PowerPoint)
Internet
6.
CONCLUSIONS AND FUTURE
WORK
Based on the findings, certain conclusions are drawn. Students at the three Saudi universities had insufficient knowledge about e-learning technology though these universities had huge budget for e-learning technology. These universities adopt e-learning technology tools that utilizes less resources i.e. finance and infrastructure. Most of the students in these universities use e-learning technology in planning and administering embedded e-learning activities throughout the period of their study. The most important technical barrier to using e-learning technology is the weak infrastructure of the Internet and its high cost.
[image:8.595.48.286.316.504.2]making quizzes and exams available on the portal site and presenting services that students need on the portal site such as the results of the exams can help to force students use the e-learning technology.
The ideas mentioned above can help to motivate students to replace the traditional method in their study at the university with the digital world by using new technology in learning and will finally support adopting e-learning by students and lecturers in and out the university campus.
The main finding of this study revealed that students were not satisfied with e-learning efforts done by Saudi universities and they believe that traditional learning methods are still more efficient and practical than e-learning technology. It is highly recommended to expand the scope of the study field to include schools, institutes and learning centers to measure the level of satisfaction among students in different learning sectors. Also, it might be more useful in future studies to include and survey lecturers and management staff to measure the opinions in different ages and different experience levels.
7.
REFERENCES
[1] Brady, W. & Elkner, J. (2011). Introduction to information and communication technology, Retrieved from
http://openbookproject.net/courses/intro2ict/history/histo ry.html.
[2] LaMorte, C. & Lilly J. (n.d.). Retrieved from http://www.dia.eui.upm.es/asignatu/sis_op1/comp_hd/co mp_hd.htm.
[3] Kanwal, F., & Rehman, M. (2017). Factors Affecting E-Learning Adoption in Developing Countries–Empirical Evidence from Pakistan’s Higher Education Sector. IEEE Access
[4] Angelino, L. M., Williams, F. K., & Natvig, D. (2007). Strategies to engage online students and reduce attrition rates. The Journal of Educators Online, 4(2), 1-14.
[5] Oye, N. D. & A.Iahad, N. & Madar, M. J. and Ab.Rahim, N. (2012). The Impact of E-learning on Students Performance in Tertiary Institutions.International Journal of Computer Networks and Wireless Communications, 2(2), ISSN: 2250-3501.
[6] Christensen, E. W., Anakwe, U. P., & Kessler, E. H. (2001). Receptivity to distance learning: The effect of technology, reputation, constrains, and learning preferences. Journal of Research on Computing in Education., 33, 263-279.
[7] Ruth, C. C. & Richard E. M. (2016). Business & Economics. John Wiley & Sons,528.
[8] Atkinson, R. L., Atkinson R. C., Smith E. E, & BEM D. J. (1993). Introduction to Psychology. (11 ed.) Forth Worth, TX: Harcourt Bruce Jovanorich.
[9] Tusting, Karin & Barton, David., (2003). Models of adult learning: a literature review. National Research and Development Centre for Adult Literacy and Numeracy.
[10] OECD, 2007. Understanding the brain: the birth of a learning science. Retrieved from http://www.oecd.org/dataoecd/42/15/38813448.pdf .
[11] Kybartaite, A. (2010). Impact of Modern Educational Technologies on Learning Outcomes.
[12] Oye, N. D. & A.Iahad, N. & Madar, M. J. and Ab.Rahim, N. (2012). The Impact of E-learning on Students Performance in Tertiary Institutions.International Journal of Computer Networks and Wireless Communications, 2(2), ISSN: 2250-3501.
[13] Richey, R., Ely, D. and Silber, K. (2008). Reflection on the 2008 AECT definitions of the field. TechTrends, 52(1), 24-
[14] Luppicini, R. A. (2005). systems definition of educational technology in society. Educational Technology & Society, 8(3), 103-109.
[15] Higgins, S. & Xiao, Z. and Katsipataki, M. (2012). The Impact of Digital Technology on Learning: A Summary for the Education Endowment Foundation. School of Education, Durham University.
[16] Kimwise Alone.(2017)." Adoption Of E-Learning Technologies In Education Institutions/Organizations: A Literature Review"Asian Journal of Educational Research, Vol. 5, No. 4, ISSN 2311-6080
[17] Galy, E. & Downey, C. and Johnson, J. (2011). The Effect of Using E-Learning Tools in Online and Campus-based Classrooms on Student Performance. Journal of Information Technology Education, 10.
[18] Foster, A. (2005). Realising the Potential – A Review of the Future Role of Further Education Colleges (Foster Report). London: DfES.