http://dx.doi.org/10.4236/ns.2011.34042
A desktop-computer simulation for exploring the
fission barrier
Bruce Cameron Reed
Department of Physics Alma College, Alma, USA;
Received 9 March 2011; revised 24 March 2011; accepted 1 April 2011.
ABSTRACT
A model of a fissioning nucleus that splits sym-metrically both axially and equatorially is used to show how one can predict the presence of a fission barrier of several tens of MeV for nu-clides of mass number A ~ 90 and of ~ 10 MeV for elements such as uranium. While the present model sacrifices some physical realism for the sake of analytic and programming simplicity, it does reproduce the general behavior of the run of fission barrier energy as a function of mass number as revealed by much more sophisti-cated models. Its intuitive appeal and tractability make it appropriate for presentation in a stu-dent-level “Modern Physics” class.
Keywords:Nuclear Fission; Fission Barrier; Numerical Simulation
1. INTRODUCTION
In discussions of the theory of nuclear fission in un-dergraduate texts, one learns that there are two key as-pects of the energetics of that phenomenon: 1) That there exists a limit (Z2/A)lim ~ 50 beyond which nuclei are
un-stable against spontaneous fission (Z is the atomic num-ber and A the mass number), and 2) That whether or not a nucleus will fission upon absorbing a neutron depends on whether or not the binding energy so released ex-ceeds a certain fission barrier. This is also known as the
activation energy or the threshold energy. In older texts, such discussions were often accompanied by schematic plots of energy versus fission-product separation which showed the barrier as a rise of a few MeV over which the compound nucleus had to ‘leap’ before fissioning, with the fission products repelling each other and then ‘sliding down’ the Coulomb potential to a final system energy some 200 MeV lower than the initial spherical configuration [1]. The maximum system energy in these illustrations is usually indicated as occurring right at the
moment of fission. The fission barrier is a profoundly important business. In the case of uranium, its value (about 6 MeV) amounts to about 1 MeV less than the binding energy released when a nucleus of 235U absorbs
a neutron, but is about 1.5 MeV greater than that in the case of 238U. This difference is sufficient to render the
lighter isotope fissile by neutrons of any kinetic energy whereas 238U can only be disrupted by those of energy ~
1.5 MeV or greater.
These fundamental concepts date from a landmark paper published by Niels Bohr and John Wheeler (B&W) in 1939 wherein they modeled nuclei as liquid drops [2]. Expressing the shape of a deformed nucleus as a sum of Legendre polynomials configured to conserve volume, they found that the essential aspects of fission could be explained by considering the total energy of a nucleus to be the sum of a surface energy US proportional its sur-face area plus an electrostatic contribution UC arising from the Coulombic inter-potentials of the protons. B&W were able to derive a general expression for (Z2/A)lim of the form (Z2/A)lim = 2(aS /aC), where aS and aC
are surface and Coulomb energy parameters whose val-ues are about 18 MeV and 0.72 MeV, respectively. B&W’s algebra involved complicated expansions and integrals of Legendre polynomials and so their work is usually considered to be far too complex for presentation to undergraduates. Many texts skirt the detailed calcula-tions by presenting simplified partial derivacalcula-tions of the
Z2/A limit by modeling nuclei as ellipsoids and invoking
an expression for the self-potential of such a geometry that is itself not trivially derived [3]. The full algebra of the (Z2/A)lim calculation can be found in a paper recently
With the rapid development of electronic computers in the postwar era, numerical simulations naturally came to the fore, and models of fissioning nuclei involving up to tenth-order polynomials were being published as early as 1947 [5]. The modeling of nuclear masses and barrier energies is now a very complex field of work, where shell effects, pairing corrections, energy levels, and de-formation and mass asymmetries all play roles. For ex-ample, in a well-known paper, Myers and Swiatecki de-veloped a seven-parameter model for nuclear masses [6]. In addition to the usual Coulomb and surface energies, they included a volume-energy term dependent on A, a parity term, and three parameters for describing shell effects; only the Coulomb and surface terms are incor-porated in the present simple model.
As a result of such complexities, many texts simply skip over the details of barrier energetics. It would thus appear that a model that could demonstrate the presence of the fission barrier while being tractable at an under-graduate level would be a useful contribution to physics pedagogy. The purpose of the present paper is to develop a straightforward numerical integration scheme for in-vestigating the fission barrier. This scheme is based on a simplified model of fission where the nucleus divides symmetrically into two identical daughter products. In reality, symmetric fission is actually quite uncommon; the most likely mass ratio for the products is about 1.6. However, while a symmetric model does represent some sacrifice of physical reality, it does possess one very important redeeming feature: the shape of the nucleus can be modeled in such a way that its radius of curvature is never discontinuous. The significance of this can be appreciated on recalling that nuclear physicists model surface energies in a manner akin to describing surface tension: a discontinuous curvature would correspond to an infinite force. Despite the simplified approach adopted here, the model proves to give results in fairly respectable agreement with much more sophisticated analyses and so serves its educational purpose.
The model is developed in section 2 below. Section 3 describes the development and results of computer pro-grams written to simulate the fission process.
2. SYMMETRIC FISSION MODEL
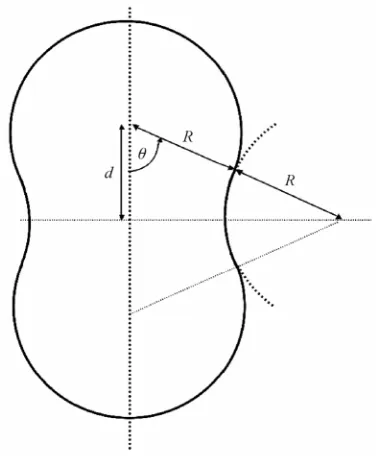
Suppose that our nucleus begins as a sphere of radius
[image:2.595.329.517.78.306.2]RO. As a consequence of some disturbance, it begins to distort in a manner that is at all times both axially and equatorially symmetric, as illustrated in Figure 1. It is assumed that, at any moment, the ends of the distorted nucleus can be modeled as spheres of radius R whose centers are separated by distance 2d and which are con-nected by an equatorial ‘neck’. The outer edge of the neck is taken to be defined by a circular arc of radius R
Figure 1. Model of symmetric fission process.
which is part of a circle that just tangentially touches the spheres which constitute the product nuclei; imagine rotating the figure around the central vertical axis. As described above, modeling the fission process in this way allows us to avoid introducing any curvature dis-continuities into the shape of the distorted surface; this would be very difficult to do if the process were not both axially and equatorially symmetric. As the spheres move apart, R must decrease to conserve nuclear volume as nuclei are considered to be incompressible fluids. The radius of the neck will decrease and eventually reach zero, at which point the teardrop-shaped products will break contact and fly apart due to mutual repulsion. A convenient coordinate for parameterizing the process is the angle θ, which is measured counterclockwise from the polar axis to a line joining the centers of the upper sphere and the imaginary one that defines the equatorial neck. θdecreases from π/2 at the start of the process to
π/6 at the moment of fission.
2.1. Volume and Surface Areas; Volume
Conservation
The volume of the partially-fissioned nucleus is given by [7]
3
4 π
3 V
V R f (1)
where
2
1 7 sin cos 2cos 3
sin π 2 sin 2 2
V
f
Demanding conservation of volume, Eqs.1 and 2 give the radius R in terms of the initial radius RO and θ as
1 3
V O
R f R . (3)
The center-to-center separation of the spheres at any moment is
2d 4R cos . (4)
The surface area S of the distorted nucleus is given by
2
4π S
S R f , (5) where
1 cos 2sin cos sin 2 4 2 π 4
S
f
. (6)
At the moment when the equatorial neck has shrunk to zero radius (θ= π/6), the radii of the spherical caps is
1 3
2 0.790
3 3 2 π
fiss O O
R R R
. (7)
The separation of the centers at this time will be 2dfiss 2 3Rfiss 2.737RO, and the full height of the distorted nucleus will be 2Rfiss + 2dfiss ~ 4.317RO.
2.2. Surface Energy
The surface energy of the deformed nucleus is as-sumed to be directly proportional to its surface area S at any moment. To formulate this in terms of atomic and mass numbers, it is helpful to invoke the empirical result that nuclear radii behave as R ~ aoA1/3, with ao ~ 1.2 fm. Invoking this result along with Eqs.3, 5, and 6 gives the surface area as
2 2 3
4π o S
S a A , (8) where
2 3
S fS fV
. (9)
S
is purely a function of the emergence angle θ. If we introduce as the value of the conversion factor from surface area to energy in MeV, the product 4π 2
o
a is the surface energy parameter aS ~ 18 MeV discussed in the Introduction above. We can then write the surface energy as
2 3
S S S
U a A . (MeV) (10)
2.3. Coulomb Energy
The Coulomb energy of the deformed nucleus of Fig-ure 1 is determined by direct numerical integration: The fissioning nucleus is imagined to be situated within a lattice of volume elements, and the self-energy is
com-puted by adding up the Coulomb energies of all pairs of elements that find themselves within the nucleus. While this procedure is conceptually straightforward, there are various practical issues to deal with, such as ensuring that the number of cells is sufficiently large to obtain reasonable accuracy without rendering the computation prohibitively time-consuming, taking advantage of the axial symmetry of the situation to minimize the number of computations, and adopting a convenient system of units.
It was decided to imagine surrounding the configura-tion of Figure 1 with a cylindrical lattice of N cells comprising NZ vertical layers, each of which consists of
NR radial rings and N angular wedges: NN N NZ R .
The lattice remains of constant volume throughout the integration (as do the individual cells), and is set to have a radius equal to that of the initial undeformed nucleus (RO) and a height just great enough to accommodate the just-fissioned system, h = βRO, where β is the factor 4.317 … discussed just after Eq.7. The bottom of the lower sphere is taken at every step in the calculation to be sitting at (x, y) = (0, 0). RO is used as the unit of dis-tance for the numerical integration. The radial rings are set up to become thinner with increasing radius in order that all cells are of the same volume; the radius of the
i’th ring (in units of RO) is given by ri i NR.
Suppose that the nucleus contains Z protons. Its charge density will be 3 4π 3
O
eZ R
, and, from the
radius, height, and number of cells in the cylinder as described above, the charge contained in a cell that lies within the nucleus will be Q = 3eZβ/4N. The Coulomb potential between any two ‘occupied’ cells (i, j) sepa-rated by distance rij will be Q Qi j 4πo ijr . On again setting RO = ao A1/3, writing rij = RO dij, and summing over all pairs of cells, the total Coulomb potential energy emerges as 2 2 1 3 15 16
C C C
Z U a N A
, (11)
where aC is the Bohr-Wheeler Coulomb energy parame-ter 2 3 0.72 MeV 20π C o o e a a
, (12)
and where
1
1 1
N N i j
C
i j i dij
, (13)2 2
2 3 15
16
C
Total S S C
S
a Z
U a A
a A N
. (14)
With aS = 18 MeV and ao = 1.2 fm, 15aC/16aS ~ 0.0375. These values are assumed in what follows.
3. PROGRAMS AND RESULTS
Two double-precision FORTRAN programs, ANGLE and FISSION, have been developed to carry out the cal-culations described above. Since the geometry of the process depends only on the emergence angle θ, it is convenient to have one program (ANGLE) generate a tabulation of R, d, and S as functions of θ, and a sec-ond one (FISSION) carry out the numerical integration for C. The programs need only be run once, after which the run of total energy for any (A, Z) as a function of θcan be obtained by scaling S and C according as Eq.14. ANGLE is written to step in increments of
−0.01 radians from π/2 at the start of the process down to π/6 at the moment of fission.
FISSION has been written to take advantage of the axial symmetry of the model. The internal and inter-pair potentials of the N angular wedges need not be
com-puted for all individual and pairs of wedges since the internal potentials of all wedges will be identical and the potentials between all possible pairs of wedges can be determined by computing the potential between any one and half of all the others. The equatorial symmetry of the model was not built into the program in the anticipation that it might later be used to simulate non-symmetric fissions. After some experimentation, it was found that choosing (NZ, NR, N) = (200, 100, 100) provided for
[image:4.595.313.536.80.211.2]both reasonably expedient run times and sensible accu-racy; a complete run requires about 12 hours on a Mac-intosh G5 and typically returns a starting-configuration energy accurate to better than 0.1% (see below).
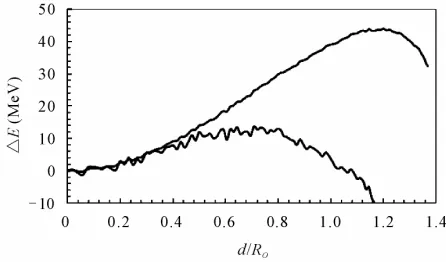
Figure 2 shows results for (A, Z) = (90, 40) and (235, 92), that is, nuclides of zirconium and uranium, respec-tively. The ordinate is the change in total configuration energy in the sense (deformed nucleus – original nu-cleus). Zirconium is used as an example because for real nuclei, much more sophisticated models, such as that of Myers and Swiatecki [6], reveal that fission barriers peak at a value of ~ 55 MeV for nuclei with A ~ 90. While there is some noise in the simulation due to the finite number of lattice cells, the computed maximum of ~ 47 MeV for zirconium is in good agreement with this peak value. For uranium, the computation gives a barrier of ~ 13 MeV, somewhat high compared to the true value of ~ 6 MeV but still respectably accurate considering the simplicity of the model. At the moment of fission, ∆E in the case of uranium has dropped to about −45 MeV. One
Figure 2. Evolution of (deformed - initial) configuration en-ergy for nuclides with (A, Z) = (90, 40) (zirconium; upper curve) and (235, 92) (uranium; lower curve). (aS, aC, ao) =
(0.72 MeV, 18 MeV, 1.2 fm). The limiting value of d/RO is
about 1.3685.
feature to note in Figure 1 is that in the case of uranium the maximum distortion energy is reached at about the middle of the fission process, whereas for zirconium the maximum occurs at very near the end of the process.
The numerical precision achieved with the model can be judged by examining how well it reproduces the con-figuration energy for the initial undeformed nucleus. This can be computed analytically as
2 2 3
1 C
start S
S
a Z
U a A
a A
. (15)
For (A, Z) = (235, 92) and (aC, aS) = (0.72 MeV, 18 MeV), this gives Ustart = 1673.0 MeV; the simulation gives 1673.74 MeV, only 0.04% high.
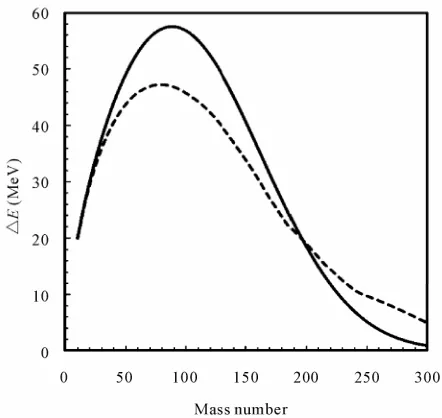
Figure 3 shows how the results of the present model compare to those Myers and Swiatecki’s seven-parame- ter model. For the present model, this plot was formed by computing ∆E() for values of A = 10, 15, 20, ···, 300 and searching for the maximum value of ∆E for each A; the curve is interpolated. In computing these maximum ∆E values it was assumed that the atomic number Z for a given value of A could be modeled as Z ~ 0.627A0.917 (1 < Z < 98), a purely empirical result based
on the (Z, A) trend of 352 nuclides with half-lives > 100 years [8]. The Myers and Swiatecki curve was generated by fitting the empirical formula
p A Aon E CA e
Figure 3. Comparison of results of present model (dashed line) with those of Myers and Swiatecki (solid line; Ref. [6]). See discussion of Eq. 16.
successfully reproduce the overall trend of ∆E(A). The key conclusions here are that the simulation is physically appealing, convincingly demonstrates the existence of fission barriers, reproduces the trend of bar-rier heights with mass number, and gives plausible val-ues for the barrier heights for interesting nuclides like uranium.
4. SUMMARY
A model for simulating symmetric fission with a desk- top computer has been developed. This model convinc-ingly demonstrates both the presence of and
approxi-mately correct magnitudes for fission barriers of real nuclides. The only physical concepts involved are Cou-lomb and areal self-energies, and, as such, the model is presentable to undergraduates in order to help them un-derstand this important phenomenon. A spreadsheet giving results for S and C as functions of θwhich users can employ to run calculations for any desired (A,
Z) values is freely available for download [9].
REFERENCES
[1] Fermi, E. (1950) Nuclear physics. University of Chicago Press, Chicago.
[2] Bohr, N. and Wheeler, J.A. (1939) The mechanism of nuclear fission. Physical Review, 56,426-450.
[3] Bernstein, J. and Pollock, F. (1979) The calculation of the electrostatic energy in the liquid drop model of nuclear fission—a pedagogical note. Physica, 96A, 136-140. [4] Reed, B.C. (2009) The Bohr-Wheeler spontaneous
fis-sion limit: An undergraduate-level derivation. European Journal of Physics, 30, 763-770.
[5] Frankel, S. and Metropolis, N. (1947) Calculations in the liquid-drop model of fission. Physical Review, 72, 914-
[6] Myers, W.D. and Swiatecki, W.J. (1966) Nuclear masses and deformations. Nuclear Physics, 81, 1-60.
[7] Reed, B.C. Details of the calculations of the volume and surface area.
http://othello.alma.edu/~reed/FissionGeometry.pdf [8] Reed, B.C. (2003) Simple derivation of the Bohr-
Whee-ler spontaneous fission limit. American Journal of Phys-ics, 71, 258-260.
[9] Reed, B.C. The spreadsheet.