inorganic papers
Acta Cryst.(2007). E63, i1–i2 doi:10.1107/S1600536806051737 Ben Zarkounaet al. LiTb(PO
3)4
i1
Acta Crystallographica Section E Structure Reports
Online
ISSN 1600-5368
LiTb(PO
3)
4Emna Ben Zarkouna,aKarima
Horchani-Naifer,bMokhtar
Fe´ridb and Ahmed Drissa*
aLaboratoire de Mate´riaux et Cristallochimie,
Faculte´ des Sciences, Universite´ Tunis-El Manar, 2092 El Manar, Tunis, Tunisia, andbLaboratoire
des Mate´riaux, Institut National de Recherche Scientifique et Technique, BP 95 - 2050 Hammam-Lif, Tunisia
Correspondence e-mail: [email protected]
Key indicators
Single-crystal X-ray study
T= 293 K
Mean(P–O) = 0.003 A˚
Rfactor = 0.020
wRfactor = 0.054
Data-to-parameter ratio = 11.6
For details of how these key indicators were automatically derived from the article, see http://journals.iucr.org/e.
Received 27 November 2006 Accepted 29 November 2006
#2007 International Union of Crystallography
All rights reserved
The lithium terbium polyphosphate LiTb(PO3)4was prepared
by the flux method using a large excess of H3PO4. It was
structurally characterized by single-crystal X-ray diffraction
and found to be isotypic with LiYb(PO3)4. The basic structural
units are endless spiral chains, (PO3)n, along the b-axis
direction. The Li+and Tb3+cations alternate on twofold axes
and are four- and eight-coordinated, respectively. The results of an optical study of this material are also given and discussed.
Comment
The level of activity directed to the chemistry of lanthanide phosphates has steadily increased during the past three decades owing to their remarkable optical properties and high
luminescence efficiency (Bimberget al., 1975; Hashimotoet al.,
1991; Obaton et al., 2000). In particular, in our laboratories
much attention has been focused on the preparation and characterization of double phosphates combining monovalent and lanthanide cations in order to determine their structural,
optical and electrical features (Fe´rid, 2006; Ben Zarkouna et
al., 2006). In this context, we report here the chemical
preparation and structural and optical investigation of the
lithium terbium polyphosphate, LiTb(PO3)4.
The title compound is found to be isotypic with LiYb(PO3)4
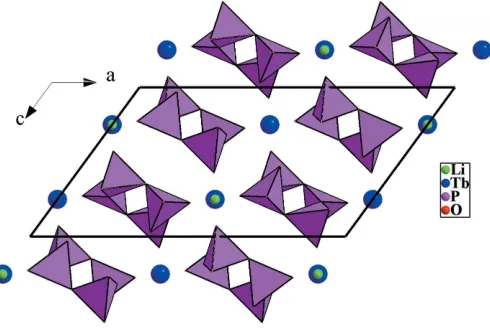
(Ben Zarkouna & Driss, 2004). The basic structural units are
endless chains, (PO3)n, spiraling around the 21screw axes, in
theb-axis direction, with a period of four tetrahedra (Fig. 1).
These chains have a 21internal symmetry, so they are built up
by only two crystallographically independent PO4tetrahedra.
[image:1.610.211.456.551.719.2]The bond lengths and angles within the phosphate chains are
Figure 1
The structural arrangement of LiTb(PO3)4 viewed along the [010]
typical of those observed in polyphosphates (Rzaigui, 1983) and, as expected, the longest P—O distances are found for the bridging P—O bonds, while the shortest are the ones involving
the terminal O atoms. As in KDyP4O12(Horchaniet al., 2002),
the alkali and lanthanide cations are located on twofold axes in thez=1
4and 3
4planes. However, in LiTb(PO3)4, the Li+and
Tb3+ cations alternate at almost equal spacings [3.51 (1) and
3.54 (1) A˚ ], compared with the quite different spacings of K+
and Dy3+ [3.743 (2) and 8.597 (2) A˚ ] in KDyP4O12. The
coordination environments of Li+ and Tb3+, in the present
structure, are formed by four and eight terminal O atoms,
respectively, in the shape of a distorted tetrahedron for Li+,
and an irregular dodecahedron for Tb3+; the mean Li—O and
Tb—O distances are 1.980 (7) and 2.412 (3) A˚ , respectively. It
can be noted that the TbO8 dodecahedra are isolated from
each other since they have no common O atom. The shortest
Tb Tb distance has a value of 5.598 (1) A˚ , somewhat greater
than that of the corresponding Yb Yb distance [5.545 (1) A˚ ]
in LiYb(PO3)4(Ben Zarkouna & Driss, 2004).
Under an UV excitation of 254 nm, LiTb(PO3)4 exhibits
green emission corresponding to the 5D4 ! 7Fj(j= 3,4,5,6)
electronic transitions of the Tb3+ ions; the dominant green
emission is around 545 nm and originates from the5D
4!7F5
transition. No blue emission from the 5D
3 level is observed.
This is typical of luminescent materials with a high
concen-tration of Tb3+, and it is due to the well known effect of
cross-relaxation, which results from a resonant energy transfer
between the 5D3!
5
D4and 7
F6 !
7
F0,1transitions of Tb
3+
ions (Berdowskiet al., 1985).
Experimental
A mixture of Li2CO3(2 g), Tb4O7(0.4 g) and H3PO4(85%, 16 ml) was slowly heated, in a vitreous carbon crucible, up to 620 K and held at this temperature for 10 d. After cooling to room temperature and removal of the excess phosphoric flux by boiling water, colourless crystals of LiTb(PO3)4 were gathered. Optical properties of LiTb(PO3)4were investigated at room temperature by means of a Jobin Yvon THR 1500 monochromator and a 254 nm Hg lamp as excitation source. The optical signal was detected by a Hamamatsu R928 photomultiplier.
Crystal data
LiTb(PO3)4
Mr= 481.74
Monoclinic,C2=c a= 16.358 (2) A˚ b= 7.050 (2) A˚ c= 9.629 (2) A˚
= 126.15 (1)
V= 896.7 (4) A˚3
Z= 4
Dx= 3.569 Mg m 3
MoKradiation
= 8.67 mm1
T= 293 (2) K Plate, colourless 0.280.160.08 mm
Data collection
Enraf–Nonius CAD-4 diffractometer
!/2scans
Absorption correction: scan (Northet al., 1968) Tmin= 0.236,Tmax= 0.646
974 independent reflections 951 reflections withI> 2(I) Rint= 0.016
max= 26.9
2 standard reflections frequency: 120 min
Refinement
Refinement onF2 R[F2> 2(F2)] = 0.020
wR(F2) = 0.054 S= 1.08 974 reflections 84 parameters
w= 1/[2
(Fo2) + (0.0344P)2
+ 5.8217P]
whereP= (Fo2+ 2Fc2)/3
(/)max< 0.001
max= 1.38 e A˚ 3
min=1.15 e A˚ 3
Extinction correction:SHELXL97 Extinction coefficient: 0.0025 (2)
Table 1
Selected geometric parameters (A˚ ,).
Li—O2i
1.974 (8) Li—O6 1.987 (7) Tb—O3 2.312 (3) Tb—O1i
2.374 (3) Tb—O2ii
2.432 (3) Tb—O6 2.530 (3) P1—O1 1.488 (3)
P1—O6 1.502 (3) P1—O4 1.591 (3) P1—O5iii
1.596 (3) P2—O2 1.488 (3) P2—O3 1.490 (3) P2—O5 1.586 (3) P2—O4 1.606 (3)
O1—P1—O6 118.7 (2) O1—P1—O4 106.7 (2) O6—P1—O4 111.1 (1) O1—P1—O5iii 111.5 (2) O6—P1—O5iii
105.0 (1) O4—P1—O5iii
102.8 (1) O2—P2—O3 119.6 (2)
O2—P2—O5 107.9 (1) O3—P2—O5 111.9 (2) O2—P2—O4 104.8 (1) O3—P2—O4 109.8 (1) O5—P2—O4 101.0 (2) P1—O4—P2 131.5 (2) P2—O5—P1iv 134.6 (2)
Symmetry codes: (i)x;yþ1;z1
2; (ii)x;y;z 1
2; (iii) xþ 1 2;yþ
1 2;zþ
3 2; (iv)
xþ1 2;y
1 2;zþ
3 2.
The highest peak is located 0.90 A˚ from the Tb atom and the deepest hole is located 1.18 A˚ also from the Tb atom.
Data collection:CAD-4 EXPRESS(Duisenberg, 1992; Macı´cˇek & Yordanov, 1992); cell refinement:CAD-4 EXPRESS; data reduction:
XCAD4(Harms & Wocadlo, 1995); program(s) used to solve struc-ture:SHELXS97(Sheldrick, 1997); program(s) used to refine struc-ture:SHELXL97(Sheldrick, 1997); molecular graphics:DIAMOND
(Brandenburg, 1998); software used to prepare material for publi-cation:SHELXL97.
References
Ben Zarkouna, E. & Driss, A. (2004).Acta Cryst.E60, i102–i104. Ben Zarkouna, E., Driss, A. & Fe´rid, M. (2006).Acta Cryst.C62, i64–i66. Berdowski, P. A. M., Lammers, M. J. J. & Blasse, G. (1985).Chem. Phys. Lett.
113, 387–390.
Bimberg, D., Robbins, D. J., Wight, D. R. & Jeser, J. P. (1975).Appl. Phys. Lett. 27, 67–68.
Brandenburg, K. (1998).DIAMOND. Version 2.0. Crystal Impact GbR, Bonn, Germany.
Duisenberg, A. J. M. (1992).J. Appl. Cryst.25, 92–96.
Fe´rid, M. (2006). Etude des proprie´te´s cristallochimiques et physiques de phosphates condense´s de terres rares. Paris: Publibook.
Harms, K. & Wocadlo, S. (1995).XCAD4. University of Marburg, Germany. Hashimoto, N., Takada, Y., Sato, K. & Ibuki, S. (1991).J. Lumin.48–49, 893–
897.
Horchani, K., Fe´rid, M., Gaˆcon, J. C., Lecocq, S., Trabelsi-Ayadi, M. & Gregora, I. (2002).Mater. Res. Bull.37, 1259–1267.
Macı´cˇek, J. & Yordanov, A. (1992).J. Appl. Cryst.25, 73–80.
North, A. C. T., Phillips, D. C. & Mathews, F. S. (1968).Acta Cryst.A24, 351– 359.
Obaton, A. F., Parent, C., Le Flem, G., Thony, P., Brenier, A. & Boulon, G. (2000).J. Alloys Compd.300–301, 123–130.
Rzaigui, M. (1983). PhD thesis, University of Tunis, Tunisia.
supporting information
sup-1 Acta Cryst. (2007). E63, i1–i2
supporting information
Acta Cryst. (2007). E63, i1–i2 [https://doi.org/10.1107/S1600536806051737]
LiTb(PO
3)
4Emna Ben Zarkouna, Karima Horchani-Naifer, Mokhtar F
é
rid and Ahmed Driss
lithium terbium polyphosphate
Crystal data
LiTb(PO3)4
Mr = 481.74
Monoclinic, C2/c
Hall symbol: -C 2yc
a = 16.358 (2) Å
b = 7.050 (2) Å
c = 9.629 (2) Å
β = 126.15 (1)°
V = 896.7 (4) Å3
Z = 4
F(000) = 896
Dx = 3.569 Mg m−3
Mo Kα radiation, λ = 0.71069 Å Cell parameters from 25 reflections
θ = 10.7–14.7°
µ = 8.67 mm−1
T = 293 K Plate, colourless 0.28 × 0.16 × 0.08 mm
Data collection
Enraf–Nonius CAD-4 diffractometer
Radiation source: fine-focus sealed tube Graphite monochromator
ω/2θ scans
Absorption correction: ψ scan (North et al., 1968)
Tmin = 0.236, Tmax = 0.646
1324 measured reflections
974 independent reflections 951 reflections with I > 2σ(I)
Rint = 0.016
θmax = 26.9°, θmin = 3.1°
h = −20→17
k = −1→8
l = −1→12
2 standard reflections every 120 min intensity decay: 1%
Refinement
Refinement on F2
Least-squares matrix: full
R[F2 > 2σ(F2)] = 0.020
wR(F2) = 0.054
S = 1.08 974 reflections 84 parameters 0 restraints
Primary atom site location: heavy-atom method
Secondary atom site location: difference Fourier map
w = 1/[σ2(F
o2) + (0.0344P)2 + 5.8217P]
where P = (Fo2 + 2Fc2)/3
(Δ/σ)max < 0.001
Δρmax = 1.38 e Å−3
Δρmin = −1.15 e Å−3
Extinction correction: SHELXL97, Fc*=kFc[1+0.001xFc2λ3/sin(2θ)]-1/4
Extinction coefficient: 0.0025 (2)
Special details
Refinement. Refinement of F2 against ALL reflections. The weighted R-factor wR and goodness of fit S are based on F2,
conventional R-factors R are based on F, with F set to zero for negative F2. The threshold expression of F2 > σ(F2) is used
only for calculating R-factors(gt) etc. and is not relevant to the choice of reflections for refinement. R-factors based on F2
are statistically about twice as large as those based on F, and R- factors based on ALL data will be even larger.
Fractional atomic coordinates and isotropic or equivalent isotropic displacement parameters (Å2)
x y z Uiso*/Ueq
Li 0.0000 0.705 (1) 0.2500 0.018 (2)
Tb 0.0000 0.20252 (3) 0.2500 0.0065 (1)
P1 0.13795 (7) 0.5530 (1) 0.6151 (1) 0.0064 (2)
P2 0.14715 (7) 0.1520 (1) 0.6974 (1) 0.0068 (2)
O1 0.1137 (2) 0.7167 (4) 0.6825 (4) 0.0121 (6)
O2 0.0719 (2) 0.0871 (4) 0.7268 (4) 0.0106 (5)
O3 0.1286 (2) 0.1149 (4) 0.5286 (3) 0.0116 (5)
O4 0.1578 (2) 0.3762 (4) 0.7340 (3) 0.0108 (5)
O5 0.2555 (2) 0.0801 (4) 0.8536 (3) 0.0104 (5)
O6 0.0653 (2) 0.5027 (4) 0.4280 (3) 0.0097 (5)
Atomic displacement parameters (Å2)
U11 U22 U33 U12 U13 U23
Li 0.024 (6) 0.016 (6) 0.016 (5) 0.000 0.013 (5) 0.000 Tb 0.0053 (2) 0.0071 (2) 0.0066 (2) 0.000 0.0031 (1) 0.000 P1 0.0045 (4) 0.0069 (5) 0.0069 (4) −0.0004 (3) 0.0029 (4) −0.0002 (3) P2 0.0047 (4) 0.0079 (4) 0.0075 (4) 0.0000 (3) 0.0035 (4) 0.0011 (3) O1 0.011 (1) 0.012 (1) 0.016 (1) −0.000 (1) 0.009 (1) −0.003 (1) O2 0.006 (1) 0.011 (1) 0.017 (1) 0.000 (1) 0.008 (1) 0.002 (1) O3 0.012 (1) 0.012 (1) 0.009 (1) 0.001 (1) 0.005 (1) 0.000 (1) O4 0.016 (1) 0.007 (1) 0.010 (1) −0.000 (1) 0.008 (1) 0.000 (1) O5 0.006 (1) 0.016 (1) 0.010 (1) 0.001 (1) 0.005 (1) 0.002 (1) O6 0.005 (1) 0.012 (1) 0.008 (1) −0.002 (1) 0.002 (1) 0.000 (1)
Geometric parameters (Å, º)
Li—O2i 1.974 (8) Tb—O2vi 2.432 (3)
Li—O2ii 1.974 (8) Tb—O6 2.530 (3)
Li—O6iii 1.987 (7) Tb—O6iii 2.530 (3)
Li—O6 1.987 (7) P1—O1 1.488 (3)
Li—Tbiv 3.509 (10) P1—O6 1.502 (3)
Li—Tb 3.541 (10) P1—O4 1.591 (3)
Tb—O3iii 2.312 (3) P1—O5vii 1.596 (3)
Tb—O3 2.312 (3) P2—O2 1.488 (3)
Tb—O1i 2.374 (3) P2—O3 1.490 (3)
Tb—O1ii 2.374 (3) P2—O5 1.586 (3)
Tb—O2v 2.432 (3) P2—O4 1.606 (3)
supporting information
sup-3 Acta Cryst. (2007). E63, i1–i2
O2i—Li—O6iii 119.23 (11) O4—P1—O5vii 102.8 (1)
O2ii—Li—O6iii 125.26 (11) O2—P2—O3 119.6 (2)
O2i—Li—O6 125.26 (11) O2—P2—O5 107.9 (1)
O2ii—Li—O6 119.23 (11) O3—P2—O5 111.9 (2)
O6iii—Li—O6 88.4 (4) O2—P2—O4 104.8 (1)
O1—P1—O6 118.7 (2) O3—P2—O4 109.8 (1)
O1—P1—O4 106.7 (2) O5—P2—O4 101.0 (2)
O6—P1—O4 111.1 (1) P1—O4—P2 131.5 (2)
O1—P1—O5vii 111.5 (2) P2—O5—P1viii 134.6 (2)