yiGou: A Semantic Text Similarity Computing System Based on SVM
Yang Liu, Chengjie Sun, Lei Lin, and Xiaolong Wang
School of Computer Science and Technology
Harbin Institute of Technology, China
{yliu,cjsun,linl,wangxl}@insun.hit.edu.cn
Abstract
This paper describes the yiGou system we de-veloped to compute the semantic similarity of two English sentences, which we submitted to the SemEval 2015 Task 2 (English subtask). The system uses a support vector machine model with literal similarity, shallow syntactic similarity, WordNet-based similarity and la-tent semantic similarity to predict the seman-tic similarity score of two short texts. In our experiments, WordNet-based and LSA-based features performed better than other features. Out of the 73 submitted runs, our two runs ranked 38th and 42th, with mean Pearson
corre-lation 0.7114 and 0.6964 respectively.
1
Introduction
Semantic Text Similarity (STS) plays an important role in many Natural language processing tasks, such as Question Answering (Narayanan and Harabagiu, 2004), Machine Translation (Beale et al., 1995), Automatic Summarization (Wang et al., 2008) and Word Sense Disambiguation (Navigli and Velardi, 2005). Since STS is an essential chal-lenge in NLP, that has attracted a significant amount of attention by the research community. SemEval has held tasks about STS for four years in a row, from which we can see the importance and difficulty of this challenge. Particularly, SemEval focuses on semantic similarity of short texts as a lot of researches about long texts have been done in past years and the demand of finding new meth-ods to measure short texts similarity has become stronger in many new applications.
In this paper, we proposed a SVM-based solu-tion to compute the semantic similarity between two sentences which is the goal of SemEval 2015
Task 2. Knowledge-based and corpus-based fea-tures were involved in our solution. We used the combination of the word similarity to estimate sen-tence similarity. And the training data of SemEval 2012 (Agirre et al., 2012) was used to train our model. In our experiments, WordNet-based and LSA-based features performed better than other features. Out of the 73 submitted runs, our two runs ranked 38th and 42th, with mean Pearson
cor-relation 0.7114 and 0.6964 respectively. The eval-uation results showed that our solution has good generalization ability on the test dataset of SemEval 2015 which is very different from our training set in terms of the sources of the sentences. Some of the relatively new technologies such as Word2Vec (Mikolov et al., 2013) and Sen-tence2Vec (Le and Mikolov, 2014) are potential methods to represent sentences and will be includ-ed in our further works.
2
Data and Metrics
In SemEval 2015, the trial dataset comprises the 2012, 2013 and 2014 datasets, which can be used to develop and train models. Because of the limita-tion of the time, we only used the training data of SemEval 2012 as our training set. The training data of SemEval 2012 contained 2000 sentence pairs from existing paraphrase datasets and machine translation evaluation resources, while the test set of SemEval 2015 coming from image description, news headlines, student answers paired with refer-ence answer, answers to questions posted in stack exchange forums and English discussion forum data exhibiting committed belief. The evaluation metric of SemEval 2015 task 2 is mean Pearson correlation, which is calculated by averaging the Pearson correlations of each subset in the test set.
3
Feature engineering
Considering the training set used in our system, we were trying to generate features which have little relation with the sources where the sentences came from. Four kinds of features are included in our model. They are literal similarity, shallow syntactic similarity, WordNet-based similarity and latent semantic similarity.
3.1
Literal SimilarityIntuitively, a pair of sentences that look similar to each other may be similar semantically. For exam-ple:
S1: A boy is playing a guitar. S2: A man is playing a guitar.
S3: Someone is drawing.
Apparently, S1 and S2 look more similar and they are closer in semantics than S1 and S3. We chose the Edit Distance (also known as Levenshtein Dis-tance) over characters to measure the similarity between two sentences. The higher the value is, the less similar the two sentences are. As this measure is case sensitive, we lowercase all letters in the sentences before computing the similarity. Alt-hough this method may draw opposite conclusions to our expectations in some specific occasions (For example, I hate it VS I have it, the Edit Distance of this pair of sentences is two, but they express very different meaning), the feature was still kept as we observed that it contributed to the overall perfor-mance in our experiments.
3.2
Shallow Syntactic SimilarityIt is quite a common phenomenon that two sen-tences only differ in one or two syntactic constitu-ents and have very similar syntactic structures. For example (example comes from training set):
S1: A man is peeling a potato.
S2: A man is slicing a potato.
This pair of sentences got very high score in gold-en standard file. As we can see, only the predicates of the two sentences are different, and the rest of the sentences are the same. This gives us a clue that using syntactic similarity to build the feature could be feasible. Moreover, two sentences may express exactly the same meaning, but use differ-ent English voices. This situation was also consid-ered in our model. Jaccard Distance was chosen to compute this feature, which is defined as follows:
ܬሺܵଵǡ ܵଶሻ ൌ
ȁܵଵת ܵଶȁ ȁܵଵ ܵଶȁ
Where ܵଵand ܵଶ are the collections of Part-Of-Speech tags of each sentence. We used the NLTK toolkit (Bird, 2006) to tag each sentence. Since Jaccard distance measure only cares about the ap-pearance of the tags, and ignores the order of them, it can reduce the impact of the tense change.
3.3
WordNet-based SimilarityWordNet (Miller, 1995) is a widely used lexical database for English, and it’s a convenient tool to find synonyms of nouns, verbs, adjectives and ad-verbs. WordNet supports numerous lexical similar-ity measures (Pedersen et al., 2004). In this work, we explore using two of these similarity measures: res_similarity and path_similarity. The core idea behind the path_similarity measure is that the simi-larity between two concepts can be derived from the length of the path linking the concepts and the position of the concepts in the WordNet taxonomy. (Meng et al., 2013). While res_similarity (Resnik, 2011) is a similarity measure based on information content. The result of res_similarity is dependent on the corpus that generates the information con-tent.
Figure 1 An example of word alignment using maxi-mum path_similarity. The upper part of the figure is showing the alignment candidates for tomato scored with path_similarity and the lower part of the figure is showing the max path_similarity alignment for the con-tent words in the sentence pair.
In our system, we used the NLTK WordNet API to compute WordNet-based similarity. Based on WordNet and Brown corpus, the computing of res_similarity and path_similarity involve follow-ing steps:
x Partition a pair of sentences into two lists of tokens.
x Part-of-speech tagging.
Features MSRpar MSRvid SMTeuroparl Sur.OnWN Sur.SMTnews Mean
All 0.51237 0.83766 0.48213 0.67070 0.47941 0.596454
w/o res_similarity 0.50939 0.83920 0.47976 0.66406 0.47976 0.594434
w/o path_similarity 0.37667 0.78555 0.38714 0.64145 0.45963 0.530088
[image:3.612.76.537.89.150.2]w/o WN-based sim 0.37583 0.79046 0.38930 0.64348 0.45767 0.531348
Table 1 Results of comparing the importance of res_similarity and path_similarity on test set of SemEval 2012. The WN-based sim included both res_similarity and path_similarity.
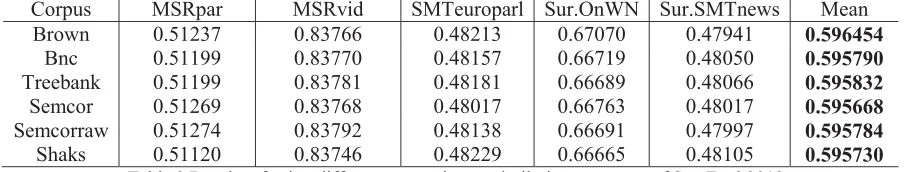
Corpus MSRpar MSRvid SMTeuroparl Sur.OnWN Sur.SMTnews Mean
Brown 0.51237 0.83766 0.48213 0.67070 0.47941 0.596454
Bnc 0.51199 0.83770 0.48157 0.66719 0.48050 0.595790
Treebank 0.51199 0.83781 0.48181 0.66689 0.48066 0.595832
Semcor 0.51269 0.83768 0.48017 0.66763 0.48017 0.595668
Semcorraw 0.51274 0.83792 0.48138 0.66691 0.47997 0.595784
[image:3.612.77.530.185.271.2]Shaks 0.51120 0.83746 0.48229 0.66665 0.48105 0.595730
Table 2 Results of using different corpus in res_similarity on test set of SemEval 2012.
results into two lists S1 and S2.
x For every word w in S1, find out the word in S2 that has the maximum res_similarity/ path_similarity with w. Adding all of the simi-larity values together, and then average this value with the length of S1.
x For every word w in S2, find out the word in S1 that has the maximum res_similarity/ path_similarity with w. Adding all of the simi-larity values together, and then average this value with the length of S2.
x Computing the harmonic mean of the two av-erage values, and the result is the value of this feature.
Figure 1 is an example shows how we find the corresponding word which has the maximum res_similarity/path_similarity with the words in the second sentence. In this example, potato has the maximum path_similarity score with tomato, compared to girl and slicing (0.33 vs. 0.0077 and 0.0). In the bottom part of the figure, each word in the first sentence would find one word which has the maximum similarity score in the second sen-tence, these scores would then be used to compute this feature.
To compare the importance of the two measures, we separately exclude one of the two features from all the features used in our solution to train two models and compare their performance. The results are shown in Table 1. As we can see from the table, path_similarity contributes more to our overall performance than res_similarity. According to the definition of res_similarity, we changed the corpus to find out the influence of the corpus on our
over-all performance. The results are showed in Table 2, from which we can see that the results varied very little with different corpora. In our submitted mod-el, Brown corpus (Francis and Kucera, 1979) was used to compute information content.
3.4
Latent Semantic SimilarityAll of the features generated above contained little semantic information. While sentences from some sources such as headlines and image descriptions are always have various forms which may not be easily compared through some string match measures or shallow syntactic oriented measures. So, a new feature that measures similarity in se-mantic space is necessary. Latent sese-mantic analysis (Landauer et al., 1998) is a very popular technique to convert the term-document matrix which de-scribes the occurrences of terms in document into three smaller matrixes like follows:
ܺ ൌ ܷߑ்ܸ
Where ܷ could be preserved as the semantic space of words. Each word could be represented as a row vector inܷ. When measuring semantic similarity of two sentences, all word vectors appeared in the sentence were summed and then averaged with the length of the sentences. Thus we can get vector representations of the two sentences V1 and V2. With V1 and V2, the similarity of the two sentences can be measured with cosine similarity. Cosine similarity defined as follows:
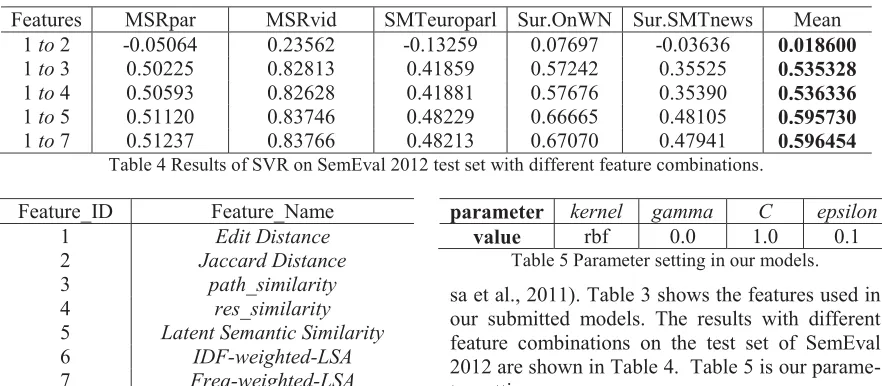
Features MSRpar MSRvid SMTeuroparl Sur.OnWN Sur.SMTnews Mean
1 to 2 -0.05064 0.23562 -0.13259 0.07697 -0.03636 0.018600
1 to 3 0.50225 0.82813 0.41859 0.57242 0.35525 0.535328
1 to 4 0.50593 0.82628 0.41881 0.57676 0.35390 0.536336
1 to 5 0.51120 0.83746 0.48229 0.66665 0.48105 0.595730
[image:4.612.88.529.85.278.2]1 to 7 0.51237 0.83766 0.48213 0.67070 0.47941 0.596454
Table 4 Results of SVR on SemEval 2012 test set with different feature combinations.
Feature_ID Feature_Name
1 Edit Distance
2 Jaccard Distance
3 path_similarity
4 res_similarity
5 Latent Semantic Similarity
6 IDF-weighted-LSA
7 Freq-weighted-LSA
Table 3 All features we used in our submitted model.
In our experiment, we directly used the LSA model provided by SEMILAR1. A word is represented as
a row vector in the LSA model (Niraula et al., 2014), and the model was decomposed from the whole Wikipedia articles.
We also developed two weighted LSA features to further use semantic information, they are IDF-weighted-LSA and Freq-weighted-LSA. IDF-weighted-LSA weighted the words (one word is represented as a 200-dimension vector generated from LSA) using inverse document frequency and then summed up all the weighted vectors of words which appeared in the sentence to be the represen-tation of the sentence. The cosine distance of two sentence representations is the value of this feature. Freq-weighted-LSA used word frequency to weight the words and following the same steps mentioned above. In our experiment, the IDF and Word-Frequency values were calculated on Wikipedia corpus dumped in December of 2012 (Jin et al., 2014). These features were only included in our second run yiGou-midbaitu. Unfortunately, this system got worse performance than the first run in official estimation. This may be caused by the overfitting of our model on the training data.
4
Experiments and Results
Due to the limitation of the time, in our submitted system, we trained Support Vector Regression (SVR) models using Scikit-learn toolkit (Pedrego
1 http://www.semanticsimilarity.org/
parameter kernel gamma C epsilon
value rbf 0.0 1.0 0.1 Table 5 Parameter setting in our models. sa et al., 2011). Table 3 shows the features used in our submitted models. The results with different feature combinations on the test set of SemEval 2012 are shown in Table 4. Table 5 is our parame-ter settings.
The performance of the best system in SemEval 2012 is 0.67 (Mean) with 19 features, and our best performance is 0.596 (Mean) with 7 features. In SemEval 2015, out of the 73 submitted runs, our two runs ranked 38th and 42th (with mean Pearson correlation 0.7114 and 0.6964 respectively). And the best performance in 2015 is 0.8015.
5
Conclusions and Future Work
In this paper, we presented our system that partici-pated in the Semantic Text Similarity task in SemEval 2015. We proposed a method using SVR to combine various features to evaluate the similar-ity between two sentences. We found that Word-Net based and LSA-based features are very useful for semantic similarity computing. For future work, we would like to further explore features about semantic representations of words, generate more features related to sentence structures and try to employ some new technologies such as Word2Vec and Sentence2Vec in our model. Besides, using a single model is not adequate to get a better accura-cy, other models will be tried and compared in our further work.
Acknowledgments
References
Eneko Agirre, Mona Diab, Daniel Cer, & Aitor Gonzalez-Agirre. (2012). Semeval-2012 task 6: A pilot on semantic textual similarity. In Proceedings of the First Joint Conference on Lexical and Computational Semantics-Volume 1: Proceedings of the main conference and the shared task, and Volume 2: Proceedings of the Sixth International Workshop on Semantic Evaluation.
Stephen Beale, Sergei Nirenburg, & Kavi Mahesh. (1995). Semantic analysis in the Mikrokosmos machine translation project. In Proceedings of the 2nd Symposium on Natural Language Processing. Steven Bird. (2006). NLTK: the natural language toolkit.
In Proceedings of the COLING/ACL on Interactive presentation sessions.
W Nelson Francis, & Henry Kucera. (1979). Brown corpus manual. Brown University Department of Linguistics.
Pedregosa, F., Varoquaux, G., Gramfort, A., Michel, V., Thirion, B., Grisel, O., ... & Duchesnay, É. (2011). Scikit-learn: Machine learning in Python. The Journal of Machine Learning Research, 12, 2825-2830.
Meng, L., Huang, R., & Gu, J. (2013). A review of
semantic similarity measures in
wordnet. International Journal of Hybrid Information Technology, 6(1), 1-12.
Xiaoqiang Jin, Chengjie Sun, Lei Lin, & Xiaolong Wang. (2014). Exploiting Multiple Resources for Word-Phrase Semantic Similarity Evaluation Chinese Computational Linguistics and Natural Language Processing Based on Naturally Annotated Big Data (pp. 46-57): Springer.
Thomas K Landauer, Peter W Foltz, & Darrell Laham. (1998). An introduction to latent semantic analysis. Discourse processes, 25(2-3), 259-284.
Quoc V Le, & Tomas Mikolov. (2014). Distributed Representations of Sentences and Documents. arXiv preprint arXiv:1405.4053.
Tomas Mikolov, Kai Chen, Greg Corrado, & Jeffrey Dean. (2013). Efficient estimation of word representations in vector space. arXiv preprint arXiv:1301.3781.
George A Miller. (1995). WordNet: a lexical database for English. Communications of the ACM, 38(11), 39-41.
Srini Narayanan, & Sanda Harabagiu. (2004). Question answering based on semantic structures. In Proceedings of the 20th international conference on Computational Linguistics.
Roberto Navigli, & Paola Velardi. (2005). Structural semantic interconnections: a knowledge-based approach to word sense disambiguation. Pattern
Analysis and Machine Intelligence, IEEE Transactions on, 27(7), 1075-1086.
Nobal B Niraula, Vasile Rus, Rajendra Banjade, Dan Stefanescu, William Baggett, & Brent Morgan. (2014). The dare corpus: A resource for anaphora resolution in dialogue based intelligent tutoring systems. Proceedings of Language Resources and Evaluation, LREC.
Ted Pedersen, Siddharth Patwardhan, & Jason Michelizzi. (2004). WordNet:: Similarity: measuring the relatedness of concepts. In Proceedings of the Demonstration Papers at HLT-NAACL 2004. Philip Resnik. (2011). Semantic similarity in a
taxonomy: An information-based measure and its application to problems of ambiguity in natural language. arXiv preprint arXiv:1105.5444.
Sheldon Ross. (2009). A First Course in Probability 8th Edition: Pearson.
Frane Šarić, Goran GlavaУ, Mladen Karan, Jan Šnajder, & Bojana Dalbelo Bašić. (2012). Takelab: Systems for measuring semantic text similarity. In Proceedings of the First Joint Conference on Lexical and Computational Semantics-Volume 1: Proceedings of the main conference and the shared task, and Volume 2: Proceedings of the Sixth International Workshop on Semantic Evaluation. Dingding Wang, Tao Li, Shenghuo Zhu, & Chris Ding.