MS
C THESIS
R
ECOGNITION OF THE EMOTION IN ABSTRACT EXPRESSIONISTIC
PAINTINGS USING A MACHINE LEARNING APPROACH
E. Brinkman
Department of Human Media Interaction, Twente University, Enschede, The Netherlands
Supervisors: Z. Ruttkay, M. Poel, D. Heylen
A
BSTRACT
The topic of the research described in this master thesis is: “A machine learning approach to emotion classification of abstract expressionistic paintings.” Emotion in paintings is a result of the sum off all the elements within a painting. In abstract expressionist paintings abstract shapes, expressive colors and textures depict emotion in the painting. The research involves the abstract expressionistic art movement, evaluation of human emotions and machine learning algorithms.
The main points of interest within this research is the relation between abstract expressionistic paintings and the emotion they are assumed to evoke at human observers. This leads to the following research question: “Is it possible to predict how people would react emotionally when observing an abstract expressionistic painting?”
The steps followed to conclude on this research are as following. An emotion corpus on how human observers react emotionally when observing abstract expressionistic paintings is collected and analyzed. This emotion corpus contains ratings on three emotion dimensions; arousal, dominance and valence. Image features on a set of abstract expressionist paintings are extracted and analyzed. Next the relation between the image features and the emotion corpus is analyzed. Machine learning algorithms are used to evaluate their ability to classify abstract expressionistic paintings on how people would react emotionally when observing these paintings.
The results show that prediction of the evoked emotion by classification algorithms give a correct classification of 73.33% (MAE 0.16) on the arousal dimension, 46.67% (MAE 0.28) on the dominance dimension and 73.33% (MAE 0.28) on the valence dimension. It shows that the arousal dimension the easiest emotion dimension to predict an evoked emotion on. These results are found after applying feature selecting to reduce the number of image features used to train the classifier. This results in a number of image features that are most valuable when predicting the emotion of an abstract expressionistic painting.
On the arousal emotion dimension, edges found in the paintings’ images are believed to be a fair predictor. Also diversity within the intensity of a color does seem to have a strong relation to emotion and color by itself does not. This is in contradiction as what is commonly believed, e.g. to see red as an angry color and yellow as a happy color.
The dominance emotion dimension does not show good results when predicting with the classifiers. Also most of its related image features are also used in relation to the arousal emotion dimension. It is questionable if the dominance dimension is a good measure for emotion in abstract expressionistic paintings.
P
REFACE
Dit werk is geschreven als onderdeel van de masteropleiding “Human Media Interaction”. Deze opleiding wordt door mij gevolgd aan de Universiteit Twente te Enschede. Mijn interesse voor het onderwerp dat hier wordt belicht komt voort uit mijn ervaring met informatica en automatisering op een professioneel gebied. Ook de overvloedige aanwezigheid van allerlei media in mijn omgeving heeft bijgedragen aan mijn beslissing om mij binnen dit gebied te verdiepen. Waar bij velen de interesse voor een bepaald gebied voortkomt uit waardering is dit in mijn geval niet zo. Persoonlijk had ik vooral een afkeer van nieuwe media en de daaraan gerelateerde consumptie en gedragspatronen. Het is dan ook vooral het onbegrip en het niet begrijpen van het waarom wat mij ertoe heeft aangezet mij te willen verdiepen in dit gebied.
Een ander vlak wat mij heeft bewogen om dit werk te maken is mijn waardering voor artiesten en de werken die door deze gemaakt zijn. De overtuiging van een artiest is vaak in een kunstwerk terug te vinden. Deze eerlijkheid en verdieping herbergt een grote schoonheid. Op het vlak van de abstract expressionisme hebben de werken naar mijn persoonlijke mening een zware emotionele uitwerking. Naar aanleiding van deze ervaringen is het voor mij interessant om dit werk te schrijven.
Een laatste motivatie voor het onderzoeken van de relatie tussen emoties en beeld is de aandacht die door de opleiding is gegeven aan het menselijke aspect binnen mens en media interactie. De emoties van de mens spelen hierbij een grote rol, deze rol heeft dan ook terecht veel aandacht gekregen binnen het vakgebied.
Van mijn kant wil ik dan ook de opleiding bedanken voor een zeer actuele visie op de huidige ontwikkelingen binnen het vakgebied. Ook de kunde van de medewerkers binnen de opleiding is opvallend van een hoog niveau. Mijn begeleiders wil ik graag bedanken voor hun geduld en hulp tijdens het proces van totstandkoming van dit werk.
T
ABLE OF CONTENTS
Abstract...2
Preface ...3
Table of contents...4
List of figures...5
List of tables ...5
1. Introduction...6
1.1. Background... 6
1.1.1. Abstract expressionism ... 6
1.1.2. Image features of paintings ... 8
1.1.3. Emotion recognition and stimuli classification related... 9
1.2. Structure of the report ...11
2. Methodology ...12
3. Data acquisition...14
4. Feature extraction ...15
5. Data evaluation and cleaning ...18
6. Machine learning...19
7. Test results ...21
7.1. Diversity of paintings ...21
7.2. Evaluation of the emotion corpus ...21
7.3. Correlation analysis...26
7.4. Comparison of machine learning algorithms...30
8. An example on the emotion classification of websites ...33
9. Conclusions and recommedations...34
References...36
L
IST OF FIGURES
Figure 1 - distribution of ratings ...22
L
IST OF TABLES
Table 1 - emotion dimension, rating scales and their meaning...14Table 2 - kappa values on 5 categories ...21
Table 3 - agreement and distribution on the arousal scale...22
Table 4 - agreement and distribution on the valence scale ...23
Table 5 - agreement and distribution on the dominance scale...23
Table 6 - words related to emotion dimensions ...24
Table 7 - P-values on correlation between the mode and statistics of target data ...25
Table 8 - P-values on correlation between the mean and statistics of target data...25
Table 9 - P-values on correlation between the standard deviation and statistics of target data ...25
Table 10 - P-values on the correlation between entropy values of colors and emotion dimensions ...26
Table 11 - P-values on the correlation between mean values of colors and emotion dimensions ...27
Table 12 - P-values on the correlation between standard deviation of colors and emotion dimensions ...27
Table 13 - numbers of correlating features ...29
Table 14 - classifier efficiency...32
Table 15 - accuracy and MAE on human raters ...32
Table 16 - accuracy and MAE of emotion classification of websites ...33
1.
I
NTRODUCTION
Emotion in paintings is a result of the sum off all the elements within a painting. Classic paintings often depict human beings where facial expressions, gestures and scenes evoke most of the emotion at the observer. In abstract expressionist paintings abstract shapes, expressive colors and textures depict emotion in the painting. The placing of the shapes and selection of the colors and textures seem random but are as often carefully arranged by the artist.
The topic of the research described in this document is: “A machine learning approach to emotion classification of abstract expressionistic paintings.” This can be explained as using computer algorithms to automatically judge an abstract expressionistic painting on the emotion as it would be evoked at human observers. The word automatically applies the use of computer algorithms that are in some extend able to learn, hence a machine learning approach to emotion classification. The research involves the abstract expressionistic art movement, evaluation of human emotions and machine learning algorithms.
1.1.
B
ACKGROUND
This section contains work that is related with abstract expressionism, image features of paintings, evaluation of emotions and automatic classification of images.
1.1.1.
A
BSTRACT EXPRESSIONISM
The history of abstract expressionism starts around 1910. The painter Wasily Kandinsky was one of the first western painters who made non-figurative and non-objective paintings. He was also the first to use the term ‘abstract expressionism’ in 1918. In his work the emotion within the artwork and the artist’s inner need are central subjects. For Kandinsky color was his language and the most important voice of the painting as tone is for music. Some quotes by Kandinsky give a good impression of his vision.
“I applied streaks and blobs of colors onto the canvas with a palette knife, and I made them sing with all the intensity I could...”
“Color provokes a psychic vibration. Color hides a power still unknown but real, which acts on every part of the human body.”
Also Kandinsky relates color to emotions, giving meaning to the color, as the following quotes tell.
“Almost without exception, blue refers to the domain of abstraction and immateriality.”
“As a picture painted in yellow always radiates spiritual warmth, or as one in blue has apparently a cooling effect, so green is only boring.”
“Absolute green is the most restful color, lacking any undertone of joy, grief, or passion. On exhausted men this restfulness has a beneficial effect, but after a time it becomes tedious.”
Due to the World War II many European artists fled to the United States of America. Among them were surrealistic painters who’s ideas influenced a young generation of painters who were struggling to find a voice for American art. This influence caused a new movement, later known as abstract expressionism. Important names within this movement are Marc Rothko, Willem de Kooning and Jackson Pollock. The movement was exceptionally successful and still an influence for many artists today.
The philosophy of abstract expressionism has been discussed many times within the movement. As the following quote from Hans Hoffman and Willem de Kooning on a three-day closed conference shows, dated April 20-23, 1950.
De Kooning: ”I wonder about the subject matter of the Crucifixion scene – was the crucifixion the subject matter or not? What is the subject matter? Is it an interior subject matter?”
Hoffman: “I think the question goes all the time back to subject matter. Every subject matter depends on how to use meaning. You can use it in a lyrical or dramatic manner. It depends on the personality of the artist. Everyone is clear about himself, as to where he belongs, and in which way he can give aesthetic enjoyment. Painting is aesthetic enjoyment. I want to be a ‘poet’. As an artist I must conform to my nature. My nature has a lyrical as well as a dramatic disposition. Not one day is the same. One day I feel wonderful to work and I feel an expression which shows the work. Only with a very clear mind and on a clear day I can paint without interruptions and without food because my disposition is like that. My work should reflect my moods and the great enjoyment which I had when I did the work.”
Color field and gestural painters are both seen as abstract expressionistic painters. Both share an identical philosophy, but their approach differs. The following quote is from Meyer Schapiro, an art historian, dated 1956.
“Each seeks an absolute in which a receptive viewer can lose himself, the one in compulsive movement, the other in an all-pervading, as internalized, sensation of dominant color. … The result in both is a painted world with a powerful immediate impact.”
On the approach of gestural painters, a quote from Jackson Pollock.
“when I am in my painting. I’m not aware of what I’m doing. It is only after a sort of ‘get acquainted’ period that I see what I have been about. I have no fears about making changes, destroying the image, etc., because the painting has a life of its own. I try to let it come through.”
To illustrate the approach of color field painters, some quotes from Marc Rothko.
"I am not an abstract painter. I am not interested in the relationship between form and color. The only thing I care about is the expression of man's basic emotions: tragedy, ecstasy, destiny."
“only in expressing basic human emotions — tragedy, ecstasy, doom, and so on. And the fact that a lot of people break down and cry when confronted with my pictures shows that I can communicate those basic human emotions . . . The people who weep before my pictures are having the same religious experience I had when I painted them. And if you, as you say, are moved only by their color relationship, then you miss the point.”
use a more conscious approach as Kandinsky and Rothko, others as Pollock use a more unconscious approach. This research can be seen as a more scientific reflection on the art movement and their urge to express themselves.
1.1.2.
I
MAGE FEATURES OF PAINTINGS
This section discusses image features of paintings as they are used by painters, not the features that can automatically be extracted from an image. It can be seen as an introduction of the visual language a painter uses in a painting.
The basic features of paintings that are of interest for this research are color, texture, shape, composition and contrast. Features that are related to figurative paintings as narrative content and symbolism are not discussed here. These are outside of the scope of the research. Although figures like a head or a building can be seen in some abstract expressionistic paintings, it is most likely not the painters intention to paint these figures.
Color - Painters often use a color model named RYB, an abbreviation of red yellow and blue. These colors are subtractive primary colors. By mixing these primary colors the secondary colors violet orange and green are made. By mixing a secondary color with a primary color the tertiary colors are made, examples are orange-red, red-violet and blue-green. Mixing a color with a complementary color gives a shade of gray. Brighter colors are made by mixing a color with white. Darker colors can be made by mixing a color with black or a complementary color.
The meaning of a color depends on it’s context and the culture of the context. For example, color preferences of Korean people differ from the preferences of English people. Korean people prefer soft , bright and pastel tone colors, whereas English people prefer strong, dark, dull and intense colors [CHOI].
Texture - Texture in the art of painting is the feel of the canvas. Texture is based on the paint and its application or addition of materials such as paper, metal, wood, silicon, sand, etc. Texture in a painting stimulates two different senses, vision and touch. This makes it a unique element of art. Ocvirk et.al. describe 4 types of texture in art: actual texture, simulated texture, abstract texture, and invented texture [OCVIRK].
• Actual Texture, the actual texture of how the work of art looks and feels to the touch.
• Simulated Texture, creating a visual effect of texture without actually adding texture.
• Abstract Texture, texture that does not seem to match the object its connected with.
• Invented Texture, the creative way of adding alternate materials to create an interesting texture.
Shape - A shape is the appearance of something defined by its outline. For example, a yellow area on a red canvas creates two shapes. The outline is found between the yellow and red areas.
Composition - Composition is the arrangements of elements in an artwork, it defines the position and size of shapes and colors.
composition. The effects of these theories tend to differ between cultures and fashions [ITTEN].
Jocobson and Bender discuss that although it is possible that one viewer’s perception of color may be very different from another’s, the relationships between colors are, in many respects, universal. They describe a model of color experience that is based on types of interactions among colors. It adjusts attributes as hue, value, saturation and their contrasts, as well as size and proportion [JACOBSON].
1.1.3.
R
ELATED
WORK
ON
EMOTION
RECOGNITION
AND
STIMULI
CLASSIFICATION
This section discusses work related to this research that uses computer algorithms to predict the emotional value or classify other features of a stimuli. These works are found in the field of speech and language and image processing.
On emotion models
Emotion models are developed to represent an emotion or a feeling of humans, not how emotion and feeling arise.
Basic emotions - In general the models that use words to differentiate emotion categories were traditionally used for psychological studies. For example; Ekman describes basic or universal emotions; anger, fear, sadness, happiness and disgust. These are emotions that can be found within every human and are believed to be primary, innate, and are universal [EKMAN].
The advantage is that basic emotions are well known by the people. The disadvantage is that one can feel other emotions than those basic ones, which have to be mapped on the model’s categories and leads to some distortion of the actual impression. Further, different researchers might use different basic emotion categories, which makes comparing studies difficult. Also, they are found to be problematic, especially when dealing with cultural differences and translations.
Emotion dimensions - Models that use a dimensional approach to represent the emotion are found to overcome cultural difficulties. This because translations of the words that describe the emotion categories can have a different meaning in other languages. By using the dimensions of arousal and valence the measurement of the felt emotion can be very accurate. The disadvantage is that the dimensions are labeled with rather abstract terms and requires understanding by the rater.
The dimensional model represents emotional states in terms of multiple dimensions, arousal and valence. Arousal measures how dynamic the emotional state is. For instance, exhilaration involves a very high level of arousal, boredom involves a very low one. Valence is a measure of the positive or negative feeling associated with the emotional state. For instance, happiness involves a very positive valence, despair involves a very negative one. Many techniques converge on the conclusion that to a first approximation, emotion terms can be understood as referring to points within a circular space defined by those two dimensions [SCHLOSBERG, PLUTCHIK, ROSEMAN, RUSSEL].
The two-dimensional model can be extended with other dimensions, an often used dimension is the control level (or the dominance-submission dimension) [COWIE]. It is said to make it possible to distinct fear from anger [KEHREIN].
Related is the research done on emotion recognition in non-acted speech by Steidl et. al.[STEIDL]. They use an entropy-based measure to find the unanimity of the human raters and machine classifiers. This because human raters do not agree on one common class in most cases. They show that in their case, a classifier which achieves a recognition rate of only 60% performs as well as five human raters on average.
Petrushin [PETRUSHIN] did research on agents for emotion recognition in speech and their application to a real world problem. The agents can recognize five emotional states with the following accuracy: normal or unemotional state - 55-75%, happiness - 60-70%, anger - 70-80%, sadness - 75-85%, and fear - 35-55%. The total average accuracy is about 70%.
Batliner et. al.[BATLINER] used realistic, spontaneous speech data from an AIBO corpus. The emotional annotations of five labelers, transformed into a confusion matrix, were used in a non-metrical multi-dimensional scaling to display two dimensions, the first being valence. The second, however, not arousal but interaction, i.e., addressing one self (angry, joyful) or the communication partner (motherese, reprimanding). They show that it depends on the specifity of the scenario and on the subjects conceptualizations whether this new dimension can be observed, and discuss impacts on the practice of labeling and processing emotional data.
In the context of a prototype voice portal Burkhardt et.al.[BURKHARDT] describe methods to search for training data, report on the performance of the classier under real world conditions and explore the use of dialog information for anger prediction. The results show that, although significantly worse than under laboratory conditions, anger detection still works well above chance level and can be used to enhance real world voice-portal usability.
On images
Art and paintings - Research on comparing art by computer classification is mostly focused on identification of the painter of an artwork [HERIK, KEREN, WIDJAJA, SABLATNIG] and authentication [KRONER, LYU] of an artwork. Some work is done on classification of paintings on art movements [ICOGLU] and style[KIRCH].
Sablatnig et. al. proposes a method that relates to certain characteristics of an art work to a specific artist. In order to study this personal style, they examine brush strokes in particular in portrait miniatures.
Image retrieval - The research field of content based image retrieval and image classification did a lot of work on feature extraction of images [SMEULDERS]. Most of the methods extract features on color, shape and texture information.
Some interesting feature extraction methods use the histogram of an image. Based on this approach the correlogram [HUANG], a three dimensional histogram that holds the spatial distance between color pairs and the geometric histogram [RAO] that combines the histogram and the correlogram are developed.
Wang et. al. [WANG05] propose an approach to classify art paintings into emotional categories (dynamic vs. static). The key points are feature selection and classification algorithms. According to the strong relationship between notable lines of an image and human sensations, a novel feature vector WLDLV (weighted line direction-length vector) is proposed, which includes both orientation and length information of lines in an image.
On facial expressions
Bartlett et.al. present a systematic comparison of machine learning methods applied to the problem of fully automatic recognition of facial expressions. The facial expressions are coded into 7 dimensions in real time: neutral, anger, disgust, fear, joy, sadness and surprise. The best results were obtained by selecting a subset of Gabor filters using AdaBoost and than training support vector machines on the outputs of the selected filters. The generalization performance to new subjects for recognition of full facial expressions in a 7-way forced choice was 93% correct [BARTLETT].
1.2.
S
TRUCTURE OF THE REPORT
2.
M
ETHODOLOGY
The methodology of this research contains the research goals, a definition of the scope of the project, a number of research questions and the design of the research.
The main points of interest within this research is the relation between abstract expressionistic paintings and the emotion they possibly evoke at human observers. By using computer technologies this research aims at a machine learning approach that can be used to automatically classify these paintings on the emotion they evoke. This research can be of use in any domain where abstract non-figurative images are presented to human observers. Think about judging interiors of buildings, backgrounds of computer games and designs of websites.
The scope is the field of abstract expressionistic paintings. These paintings are used because of the link between the philosophy of the movement and human emotions; they are created because of the inner need of the painter to express his feelings within the artwork. Also, most of these paintings do not contain figurative images as facial expressions, human gestures or dramatic scenes. These figurative images do effect the emotion evoked on the human observer. By using the scope of abstract expressionistic paintings this research can focus on features as color, shape, contrast and composition and their relation to the emotion evoked.
The research topic with respect to the stated goals leads to the following research questions:
- Is it possible to predict how people would react emotionally when observing an abstract expressionistic painting?
The research question involves the following sub questions:
- How do human observers react emotionally when observing an abstract expressionistic painting?
- How are the features of abstract expressionistic paintings related to the evoked emotion at the human observers?
These research questions are made with one assumption: abstract expressionistic paintings do evoke an emotion at their observers. This is assumable because of the popularity of the art movement, its philosophy and reviews by art critics.
To be able to conclude on the research questions the following methodology is used. It describes a number of steps to follow and the way they are implemented. This includes possible alternative methods that can be used within these steps and assessments on alternatives. The methodology includes the following steps:
- Data acquisition
o To collect an emotion corpus on how human observers react emotionally when observing abstract expressionistic paintings.
- Image feature extraction
o To collect image features on a set of abstract expressionist paintings. - Data evaluation and cleaning
o To analyze the emotion corpus on how human observers react emotionally when observing abstract expressionistic paintings.
o To analyze the relation between the image features and the corpus.
- Machine learning
o To evaluate the ability of machine learning algorithms to classify abstract
expressionistic paintings on how people would react emotionally when observing an these painting.
o To evaluate the ability of machine learning algorithms to classify images
outside the scope of abstract expressionistic paintings on how people would react emotionally when observing these images.
3.
D
ATA ACQUISITION
Knowing the emotion evoked by paintings at human observers is most important for this research. When attempting to use a machine learning approach to conclude on the possibility to predict the evoked emotion, the evaluation data must have some agreement between the observers.
Also, a machine learning approach demands training data on the subjects, hence the paintings. Therefore this experiment will be used to gather an emotion corpus as training data; the evoked emotion as rated by the human observers.
A questionnaire is used to gather data on the evoked emotions. This form is chosen because it can be implemented online and thus gives the opportunity to reach a large amount of people. Also, it can generate quantitative data that can be evaluated statistical and be used for machine learning. Another option would be to do interviews with observers, which costs a lot more time and the data will have a qualitative character.
The experiment requires a set of paintings, large enough to train a machine learning algorithm. The size of the subject set is set to 15. The selected paintings must be abstract expressionistic paintings and have to be divers in their appearance. The size of the on screen images of the paintings must be high enough to reveal detail and small enough to be presented online in a browser window. The size of the screen images are set to be 600 pixels in height. The paintings are found at the Deviant Art web site, the largest artist’s community in the world. These paintings are free to use with respect to their license.
The evaluation environment is a website within a browser window on a computer screen. The website contains no colors except shades of gray, this to minimize the diversion from the subject. The observer is guided through the website in the English or Dutch language and introduced to the questionnaire to be taken on each subject of the paintings.
The questionnaire uses the arousal and valence dimensions of the appraisal theory [ROSEMAN]. Examples on implementations on the arousal and valence dimensions are found at the tools Feeltrace [COWIE] and Geneva Emotion Wheel [SCHERER]. The dominance dimension is an addition to these dimensions, it is said to make it possible to distinct fear from anger [KEHREIN]. Therefore the questionnaire does also include the dominance dimension.
[image:15.612.88.510.570.639.2]The design of the questionnaire on the emotion dimensions is as the following. The three emotion dimensions arousal, valence and dominance contain a rating on the evoked emotion. These dimensions can be rated on a 5 level scale from 1 to 5. The following table gives an overview of these dimensions, their scales and meaning.
Dimension Scale Meaning
Arousal 1 to 5 From passive to active
From weak to strong
Valence 1 to 5 From unpleasant to pleasant
From unattractive to attractive
Dominance 1 to 5 From submissive to dominant
Table 1 - emotion dimension, rating scales and their meaning
4.
F
EATURE EXTRACTION
Features are extracted from the images of the paintings. These features contain information about, for example colors and textures found in the image. Together the extracted features are called the feature vector. The used features are discussed below.
Before extracting features from the image, the image is indexed as a RGB image and a HSV image. An RGB indexed image contains information on the amount of red, green and blue of each pixel of the image. An HSV indexed image contains information on the hue, saturation and value of each pixel of the image.
Color
There is a range of color models to notate a color, e.g. RGB, HSV, HSL, CMYK and CIE XYZ. The RGB and CMYK models are used for technical reproduction of colors. The CIE XYZ model is based on direct measurements of the human eye, and serves as the basis for the HSV and HSL models. The HSV and HSL models closely model the human experience of a color and are useful tools for artists.
According to the HSV model color holds information on hue, saturation (also known as chroma or purity) and value. Hue is the part of the color described with names as yellow, red, blue, etc. Saturation is the intensity of a specific hue. Colors with a high saturation value are seen as vivid colors and colors with a low saturation value are seen as a shade of grey. The value tells if a color is dark, light or somewhere in between.
Color histograms are used as a feature on the color distribution of an image. Histograms derived from a RGB indexed image contain histograms on the red, green and blue distributions. A HSV indexed image contain histograms on the hue, saturation and value distributions. These histograms contain 10 bins, this number is gained by comparing a 256 bins histogram with histograms of a decreased number of bins. The 10 bins histogram still shows the same peaks as a 256 bins histogram.
Statistics and histograms on both RGB and HSV models are included in the feature vector used. This because the HSV model closely models the human experience of colors and the RGB model is related to the three color receptors in the human eye.
Texture
The three approaches used to describe texture are statistical, structural and spectral. Of these approaches only the statistical one is used, because it is available within the Matlab application.
Statistical techniques calculate texture by the statistical features of the grey levels of a image. These properties are computed from the grey level histogram or grey level co-occurrence matrix of the surface. Features often used are entropy, correlation, energy, contrast (inertia) and entropy homogeneity [HARALICK], these are explained below.
• Entropy, a measurement on a color distribution that gives a value on the amount of information the distribution contains. Images with a constant value on a color feature have an entropy of zero bits on the respective feature. Images that have a random distribution on a color feature have a high entropy on the respective feature.
o Correlation, a measure of how correlated a pixel is to its neighbor over the whole image. Correlation is 1 or -1 for a perfectly positively or negatively correlated image.
o Energy, gives the sum of squared elements in the GLCM. Energy is 1 for a constant image.
o Contrast, a measure of the intensity contrast between a pixel and its neighbor over the whole image. Contrast is 0 for a constant image.
o Entropy homogeneity, a value that measures the closeness of the
distribution of elements in the GLCM to the GLCM diagonal. Homogeneity is 1 for a diagonal GLCM.
Structural techniques calculate texture as being composed of simple texture elements, that are regularly arranged on a surface according to a set of grammar rules.
Spectral techniques are based on properties of the Fourier spectrum and describe global periodicity of the grey levels of a surface by identifying high energy peaks in the spectrum.
Shape
A shape is obtained by characterizing the border of the shape by for example Fourier descriptors, invariant moments, shape measures, skeletons and edge abruptness.
Shape does not refer to the shape of an image but to the shape of a particular region within the image. Shapes will often be determined by first applying segmentation or edge detection to an image. In some cases accurate shape detection will require human intervention because methods like segmentation are very difficult to completely automate.
Algorithms that can be used for edge detection are Canny [CANNY] and Sobel. These algorithms provide a grayscale or monochrome image with the edge found in the original image. Statistics as mean and standard deviation on the grayscale images are included in the feature vector.
Feature vector
Because at this point it is uncertain which features will perform better than others, al the features described above are included to the feature vector for now. The feature vector contains the following features:
• Statistical features
o A 10 bins histogram on the red distribution of RGB indexed pixels o A 10 bins Histogram on the green distribution of RGB indexed pixels
o A 10 bins Histogram on the blue distribution of RGB indexed pixels
o A 10 bins Histogram on the hue distribution of HVS indexed pixels o A 10 bins Histogram on the saturation distribution of HVS indexed pixels
o A 10 bins Histogram on the value distribution of HVS indexed pixels
o Entropy of the red distribution of RGB indexed pixels
o Entropy of the green distribution of RGB indexed pixels
o Entropy of the saturation distribution of HSV indexed pixels
o Entropy of the value distribution of HSV indexed pixels
o Mean of the red distribution of RGB indexed pixels o Mean of the green distribution of RGB indexed pixels
o Mean of the blue distribution of RGB indexed pixels o Mean of the hue distribution of HSV indexed pixels
o Mean of the saturation distribution of HSV indexed pixels
o Mean of the value distribution of HSV indexed pixels
o Standard deviation of the red distribution of RGB indexed pixels
o Standard deviation of the green distribution of RGB indexed pixels o Standard deviation of the blue distribution of RGB indexed pixels
o Standard deviation of the hue distribution of HSV indexed pixels
o Standard deviation of the saturation distribution of HSV indexed pixels o Standard deviation of the value distribution of HSV indexed pixels • Texture features on the hue, saturation and value part of HSV indexed pixels
o Crontrast derived from the GLCM at 0, 45, 90 and 135 degrees
o Correlation derived from the GLCM at 0, 45, 90 and 135 degrees
o Energy derived from the GLCM at 0, 45, 90 and 135 degrees o Homogeneity derived from the GLCM at 0, 45, 90 and 135 degrees • Edge features on the hue, saturation and value part of the HSV color distribution
o Mean of the grayscale distribution of the Sobel edge enhanced image on
the horizontal, vertical and both directions
5.
D
ATA EVALUATION AND CLEANING
The gathered data on the evoked emotions is evaluated on the following statistic measurements:
- Agreement on the paintings between observers on each of the emotion dimensions
- Histograms of rating distributions on each of the emotion dimensions
- Correlation between evaluated emotion dimensions
- Comparison of the subjective adjective given by raters in relation with the emotion dimensions
- Correlation between images features and the emotion dimensions
Agreement is calculated by using the Fleiss’ kappa statistics [FLEISS, COHEN]. A measured agreement above 0 gives an indication that the agreement between observers is above chance level. A measured agreement of 1 indicates a perfect agreement between observers.
The correlation between the evaluated emotion dimensions tells something about the distinction between these dimensions as they are evaluated by human raters.
The histograms of rating distributions of the emotion dimensions will give information on the paintings if they are rated as evoking distinct emotions or not.
The subjective adjectives given in the textual field are compared to the data from the rated emotion dimensions. This will tell something about the observers’ interpretation of the meaning of the emotion dimensions. It can be that this meaning as interpreted by the observers differs from the actual meaning of these dimensions.
To find any relation between the features of abstract expressionistic paintings and the evoked feeling as evaluated, correlations between extracted features from the paintings and the evaluation data are examined. In case no correlation is found between the extracted features and the evaluation data, predicting the evoked emotion based on these features will be difficult. This can mean that the used features are wrong. Correlations that are found can give significant information about the effect the correlating features have on the evoked emotion. The correlating features will be used as input data for the machine learning algorithms.
6.
M
ACHINE LEARNING
A set of machine learning algorithms (classifiers) are used to predict the emotional value of a painting. A classifier is trained by the emotion corpus as gathered from the previous steps as target data and the feature vectors extracted from the paintings as input data. Evaluation is done on each of the arousal, valence and dominance emotion dimensions.
The outcome of the evaluation will tell something about the ability of a classifier to evaluate an abstract painting as humans do. This with respect to the agreement on the evaluation of evoked emotions between human observers. By comparing the results between human observers and the classifiers it is possible to conclude on the research question.
There are many machine learning methods available that apply to classification problems like this one. It is not certain which method will perform best as they depend largely on the characteristics of the data used. Van der Walt and Barnard did show this by investigating very specific artificial data sets to determine conditions under which certain classifiers perform better and worse than others [WALT]. Selecting a machine learning methods applicable to this problem is a matter of trial and error.
The program Weka [WITTEN] is used for evaluation of the classifiers. Some well known machine learning algorithms are applied; Bayes Net, Naïve Bayes, Multi Layer Perceptron, Random Forest, Naïve Bayes Tree, Decision Stump and Decision Stump with Ada Boost.
Training and evaluating the algorithms are done by n-fold cross-validation experiments, also known as leave-one-out cross-validation. This approach is often used when the size of the training set is relatively small. The classifier can be trained using the complete data set. The method evaluates the classifier n times, where n is the number of entries in the training set. The resulting estimations are the averages of n evaluations.
The majority voting of all human observers serves as hard reference to determine the accuracy (the percentage of correct classifications) of the classifiers. A correct classification on a emotion dimension for a painting holds the same predicted value as is gained by taking the mode of all ratings given by the observers on the same emotion dimension and painting.
Next to the accuracy of the classifiers, the MAE (mean absolute error) is measured. This gives an idea on how wrong a classifier is when it is wrong. The closer the MAE is to zero, the better the performance of the classifier. Usually this measurement only applies to regression problems, but because the classifiers have to predict a nominal value it is also applicable to this classification problem.
To increase the performance of the classifiers the size of the feature vector can be decreased in iterations. A large set of features in relation with the number of training data entries can be a cause of poor performance of the classifiers. The methods used to evaluate the features are Information Gain, Relief Attribute Evaluation, SVM Attribute Evaluation and Symmetrical Uncertain Attribute Evaluation from the WEKA application. The results from these methods give a ranking on each of the features. A number of best ranking features on each of the emotion dimensions are used in the next iteration of machine learning. This approach will result in a used feature set with only features that are relevant to an emotion dimension and thus an optimal performance.
7.
E
XPERIMENT RESULTS
This chapter describes the results found by conducting the experiments and evaluating the gathered data. The topics discussed in this section are; ‘Diversity of paintings’, ‘Evaluation of the emotion corpus’, ‘Correlation analysis’ and ‘Comparison of machine learning algorithms’.
7.1.
D
IVERSITY OF PAINTINGS
The input data is expected to be divers. The diversity can be found by analyzing the distributions of the extracted features. Features that are expected to hold information on the diversity of the paintings are; the mean of the HSV color attributes and the entropy of the color’s value attribute. These distributions can be found in the appendicle “Image features”.
The distributions on the features of input images show a divers distribution on the features. According to this data the set of input data can be seen as divers and be used for the next steps of the experiment.
7.2.
E
VALUATION OF THE EMOTION CORPUS
The results of the questionnaire make the emotion corpus, evaluation of this corpus is done in the following section.
Overall agreement
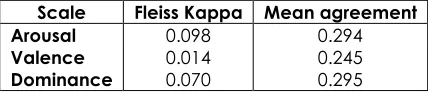
Measurement on agreement is done by applying the Fleiss Kappa calculation on the data. Agreements are calculated for the three evaluation scales; the valence, arousal and dominance dimensions. These dimensions all have 5 categories. Also displayed is the mean agreement as calculated by taking the mean of the percentage agreement values for each emotion dimension. See Table 3, Table 4 and Table 5 for the values of the percentage agreement on the paintings.
Scale Fleiss Kappa Mean agreement
Arousal 0.098 0.294
Valence 0.014 0.245
[image:22.612.90.304.464.511.2]Dominance 0.070 0.295
Table 2 - kappa values on 5 categories
The results show a slight agreement between the raters on the dimensions arousal and dominance. The valence scale shows a poor agreement between raters. There is a notable difference between the Fleiss Kappa values and the mean agreement. This can be explained, the Fleiss Kappa measures the extent of the amount of agreement among observers to what would be expected if all observers made their ratings completely randomly. So when using 5 categories the agreement expected if all raters made their ratings completely random is 0.2. For the arousal category the extend given by Fleiss Kappa is 0.098 which makes sense given the mean agreement is 0.294.
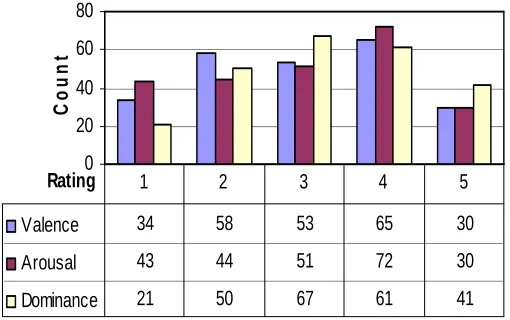
0 20 40 60 80
Rating
C
o
u
n
t
Valence 34 58 53 65 30
Arousal 43 44 51 72 30
Dominance 21 50 67 61 41
[image:23.612.116.371.86.246.2]1 2 3 4 5
Figure 1 - distribution of ratings
Agreement per painting
The following tables display the agreement on each painting on each emotion dimension. Displayed is the percentage agreement, the mean and the standard deviation as the result from the emotion corpus. For each of the emotion dimensions it shows a moderate agreement on each of the paintings.
Arousal
Painting Agreement Mean StdDev
Post Consumer by Erkonom. 0.21 2.67 1.25
Rainforest by Blakewood 0.22 2.95 1.18
Open Mind by nighty 0.22 2.51 1.17
Europa by greycom 0.25 2.23 1.19
Elctricwiresscrossroads by easyfloat 0.25 3.13 1.11
Orange Burn by Violetlove 0.26 2.56 1.08
Red Boat by Eyepegus 0.27 3.41 1.13
This Kiss Could Feed A Family by TomSoya 0.28 3.59 0.90
Untitled 16 by Arthurx7 0.29 2.03 0.89
Sunset by Artbyelm 0.32 1.92 1.07
OMINOUS by Loci 0.33 4.10 0.78
No 21 0.33 1.92 1.05
Colorblind by Urban Paradox 0.35 3.44 0.93
Other II by Jarmen 0.41 3.82 0.81
The Trees by Danmorelle 0.42 4.31 0.76
[image:23.612.91.418.398.595.2]Valence
Painting Agreement Mean StdDev
Post Consumer by erkonom 0.21 3.13 1.22
Orange Burn by Violetlove 0.21 3.03 1.21
Sunset by Artbyelm 0.21 3.05 1.18
Europa by Greycom 0.21 2.74 1.41
OMINOUS by Loci 0.23 3.36 1.12
Colorblind by Urban Paradox 0.23 2.79 1.14
The Trees by Danmorelle 0.24 3.23 1.10
No 21 0.24 3.33 1.09
Other II by Jarmen 0.26 2.62 1.12
Open Mind by Nighty 0.26 3.21 1.20
Elctricwiresscrossroads by Easyfloat 0.26 3.41 1.08
Untitled 16 by Arthurx7 0.26 3.41 0.98
This Kiss Could Feed A Family by TomSoya 0.27 2.64 1.03
Rainforest by Blakewood 0.29 3.41 1.17
[image:24.612.92.420.89.286.2]Red Boat by Eyepegus 0.30 2.95 0.85
Table 4 - agreement and distribution on the valence scale
Dominance
Painting Agreement Mean StdDev
Sunset by Artbyelm 0.21 2.92 1.21
Open Mind by Nighty 0.21 2.49 1.30
Orange Burn by Violetlove 0.22 2.79 1.14
Europa by Greycom 0.25 2.90 1.22
No 21 0.25 2.41 1.10
Rainforest by Blakewood 0.27 3.31 0.94
Electricwiresscrossroads by Easyfloat 0.27 3.26 0.93
Untitled 16 by Arthurx7 0.28 2.31 0.96
Post Consumer by Erkonom 0.29 2.51 0.87
Red Boat by Eyepegus 0.31 3.72 0.81
Colorblind by Urban Paradox 0.32 3.44 0.87
This Kiss Could Feed A Family by TomSoya 0.33 3.92 0.89
OMINOUS by Loci 0.39 3.90 0.67
Other II by Jarmen 0.41 3.56 0.81
[image:24.612.92.418.324.521.2]The Trees by Danmorelle 0.42 4.10 0.78
Table 5 - agreement and distribution on the dominance scale
When comparing each of the emotion dimensions, the arousal and dominance dimension both have a similar lowest and highest agreement. The lowest agreement on the valence dimension is just as low as for the other, but the highest agreement is lower. Agreement between raters does not only depend on the emotion dimension as suggested by the kappa results but also on the painting self.
Subjective descriptive words used by raters
attractive, a dominance value of 1 means submissive and 5 means dominant. The words are given in order of their frequency.
Arousal
1 rust, stilte, kalm, dromerig, elegant, melancholisch, agressief, druk
2 herfst, droomeffect, verschillige rust, warmte, energie, beetje organisch,
samenhangend onverschillig, te veel door elkaar, vaag, subtiel, rustgevend, strak, evenwicht, simpelheid, obscure, controle
3 passief levendig, ruige achtergrond, trieste vrolijkheid, rustige warmte, zoekend,
saai, agressief, natuur, rommeltje, depressief, destructief, evenwicht
4 druk, levendig, ongeordend, chaos, agressief, zooitje, kermis, frisheid, warrig,
duizelig, warm, passievol
5 gejaagd, fantasie, vrij, belegering, stress, agressie
Valence
1 vind ik niks, niet echt wat, te vaag, te rommelig, onlogisch, deprimerend, niets
zeggend, koud, somber, destructief, te druk, ongeordend, kermis, bah
2 agressief, verschillig, vleeswond, niet bijzonder mooi, strak, rommeltje, zooitje, vaag,
warrig, nietszeggend
3 beetje melancholisch, lekker rustig, belemmerd, niet indrukwekkend, evenwicht,
controle, trieste vrolijkheid, beetje saai, briljant eigenlijk
4 wel mooi, aantrekkelijk, beschadiging, leuk, geweldige uitdrukking, wel tof, vrolijk,
aandacht, frisheid, warm, passievol, vrij
5 elegant, aangenaam, vet, mooi, warmte, prachtig, warmte, stressvol
Dominance
1 doet mij niet veel, verschillig
2 vaag, rustgevend, rommeltje, warme rust, lekker rustig, controle, beschadiging,
lichte kalmte, lichte rust, te abstract, elegant, aangenaam, droomeffect, subtiel
3 niets zeggend, zoekend, agressief, warrig, evenwicht, sleur, herfst, passief levendig,
natuur
4 onlogisch, chaos, agressief, druk, slecht voor humeur, bosbrand, briljant, belegering,
duisternis, onverschillig, obscuur, kapot, hoge bomen, warm, passievol, stress, prachtig
5 duivel aan een kruis, gejaagdheid, agressie, vleeswond, melancholisch, aandacht,
3D
Table 6 - words related to emotion dimensions
Overall the emotion dimensions and the related words do not point at a misunderstanding of the emotion dimensions. Although for example the words ‘agressief’ (aggressive) and ‘druk’ (busy) are used in relation with a low arousal value, words as ‘rust’ (peace) and ’stilte’ (quietness) are used more often in the same relation.
Correlation between emotion dimensions
dimensions. The tables below show the correlation between the mode, mean and standard deviation of the results within the emotion corpus.
Mode
Arousal Valence Dominance
Mode arousal 1.00 0.67 0.00
Mode valence 0.67 1.00 0.57
Mode dominance 0.00 0.57 1.00
Mean arousal 0.00 0.89 0.00
Mean valence 0.73 0.00 0.18
Mean dominance 0.00 0.61 0.00
Stdev arousal 0.11 0.89 0.03
Stdev valence 0.08 0.32 0.15
[image:26.612.92.400.120.254.2]Stdev dominance 0.00 0.50 0.00
Table 7 - P-values on correlation between the mode and statistics of target data
Mean
Arousal Valence Dominance
Mode arousal 0.00 0.73 0.00
Mode valence 0.89 0.00 0.61
Mode dominance 0.00 0.18 0.00
Mean arousal 1.00 0.46 0.00
Mean valence 0.46 1.00 0.27
Mean dominance 0.00 0.27 1.00
Stdev arousal 0.01 0.70 0.03
Stdev valence 0.27 0.62 0.24
[image:26.612.90.400.296.429.2]Stdev dominance 0.00 0.97 0.00
Table 8 - P-values on correlation between the mean and statistics of target data
Standard deviation
Arousal Valence Dominance
Mode arousal 0.11 0.08 0.00
Mode valence 0.89 0.32 0.50
Mode dominance 0.03 0.15 0.00
Mean arousal 0.01 0.27 0.00
Mean valence 0.70 0.62 0.97
Mean dominance 0.03 0.24 0.00
Stdev arousal 1.00 0.20 0.02
Stdev valence 0.20 1.00 0.05
Stdev dominance 0.02 0.05 1.00
Table 9 - P-values on correlation between the standard deviation and statistics of target data
[image:26.612.90.403.472.606.2]This means the arousal and dominance dimensions are interpreted in more or less the same way by the raters. The valence dimension is interpreted in a different way as the arousal and dominance dimensions.
The correlation between the standard deviation of the arousal and dominance dimensions and their mean and mode values shows that the agreement between observers is higher when the painting is evaluated as highly arousing or highly dominant.
7.3.
C
ORRELATION ANALYSIS
Correlation analysis is done between the extracted features of a painting and evaluation data on the emotion dimensions. This is done to find relations between features of a painting and the emotion dimensions. All the extracted image features from the previous proposed feature vector are analyzed. The tables below show the results on the p-values (the strength) of their correlations.
Entropy of color distributions Entropy
Red Green Blue Hue Sat. Value
Mode arousal 0.13 0.12 0.01 0.20 0.32 0.03
Mode valence 0.21 0.21 0.44 0.57 0.55 0.34
Mode dominance 0.55 0.22 0.10 0.31 0.64 0.20
Mean arousal 0.10 0.08 0.01 0.08 0.21 0.04
Mean valence 0.40 0.44 0.64 0.52 0.94 0.53
Mean dominance 0.06 0.03 0.01 0.03 0.07 0.02 Stdev arousal 0.43 0.63 0.41 0.05 0.65 0.32
Stdev valence 0.51 0.57 0.34 0.35 0.27 0.46
[image:27.612.91.444.262.408.2]Stdev dominance 0.19 0.19 0.01 0.14 0.85 0.05
Table 10 - P-values on the correlation between entropy values of colors and emotion dimensions
The entropy value of a color distribution gives a number on the amount of information the distribution contains. The entropy on the green distribution shows a relation with the mean of the dominance dimension. The entropy on the blue distribution shows a relation with the mode arousal, mean arousal, mean dominance and the standard deviation of the dominance dimension. The entropy on the hue distribution shows a relation with the mean of the dominance and the standard deviation of the arousal dimension. The entropy on the value distribution shows a relation with the mode and mean of the arousal, the mean and standard deviation of the dominance dimension.
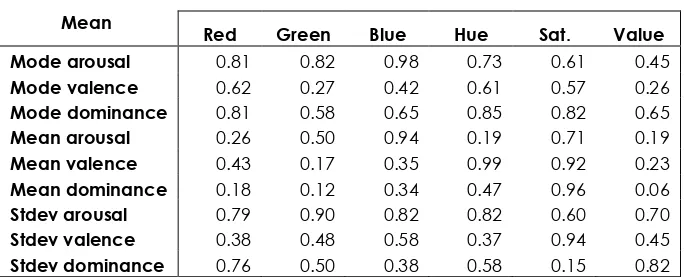
Mean of color distributions Mean
Red Green Blue Hue Sat. Value
Mode arousal 0.81 0.82 0.98 0.73 0.61 0.45
Mode valence 0.62 0.27 0.42 0.61 0.57 0.26
Mode dominance 0.81 0.58 0.65 0.85 0.82 0.65
Mean arousal 0.26 0.50 0.94 0.19 0.71 0.19
Mean valence 0.43 0.17 0.35 0.99 0.92 0.23
Mean dominance 0.18 0.12 0.34 0.47 0.96 0.06
Stdev arousal 0.79 0.90 0.82 0.82 0.60 0.70
Stdev valence 0.38 0.48 0.58 0.37 0.94 0.45
[image:28.612.92.436.85.224.2]Stdev dominance 0.76 0.50 0.38 0.58 0.15 0.82
Table 11 - P-values on the correlation between mean values of colors and emotion dimensions
The mean values of the colors in a painting show almost no correlation with the emotion dimensions. This means that the quantity of a color alone has almost no effect on the felt emotion.
Standard deviation of color distributions Standard deviation
Red Green Blue Hue Sat. Value
Mode arousal 0.06 0.00 0.00 0.14 0.01 0.00
Mode valence 0.88 0.91 0.75 0.09 0.89 0.95
Mode dominance 0.09 0.00 0.02 0.09 0.08 0.01
Mean arousal 0.07 0.00 0.00 0.18 0.00 0.01
Mean valence 0.99 0.99 0.56 0.11 0.57 0.91
Mean dominance 0.03 0.00 0.00 0.02 0.00 0.00 Stdev arousal 0.03 0.03 0.04 0.62 0.33 0.02 Stdev valence 0.49 0.29 0.36 0.47 0.15 0.41
Stdev dominance 0.13 0.00 0.00 0.29 0.16 0.01
Table 12 - P-values on the correlation between standard deviation of colors and emotion dimensions
The standard deviation on a color distribution tells something about the width of a distribution. The standard deviation on the hue distribution holds information about the range of colors used within an image. The standard deviation on the red, green and blue distributions do not tell us about the diversity of the colors in the image , but about the range of the intensity of these colors and thus about the range of the intensity within the image itself. So results on the correlation of the standard deviation of the red, green and blue distributions can also be seen on the value distribution.
The standard deviation on the red, green and blue distributions show a relation with the mode, mean and standard deviation of the arousal and dominance dimensions. This is also true for the standard deviation on the value distribution. The standard deviation on the saturation distribution relates with the mode and mean of the arousal and dominance dimensions, but not with the standard deviation of these dimensions. The standard deviation on the hue distribution does relate to the mean of the dominance dimension.
Color histograms
The results of the correlation analysis on the RGB and HSV histograms can be found in the appendix of this document. Because a histogram contains a number of bins and for correlation analysis these bins are analyzed separately, absence of correlation does not mean a histogram in total has no relation to the emotion dimensions. Correlations on the arousal dimension are found in the red part of the RGB distribution and the hue part of the HSV distribution. Correlations on the valence dimension are found in the green part of the RGB distribution and the hue part of the HSV distribution. Correlations on the dominance dimension are found in the red and green parts of the RGB distribution and the value part of the HSV distribution.
Gray level co-occurrence matrices
The results of the correlation analysis on statistics derived from the gray level co-occurrence matrices (GLCM) can be found in the appendix of this document. Statistics derived from GLCM’s are used to describe texture features of an image. The GLCM’s are calculated with a given direction (0, 45, 90 and 135 degrees) on the parts of the HSV color distribution. From these GLCM’s statistics are derived, contrast, correlation, energy and homogeneity. This results in a total of 48 features. Correlations are found on the arousal and dominance dimensions and only few on the valence dimension. The standard deviation on the valence dimension correlates with the correlation feature on the value part of the HSV color distribution. On the arousal and dominance dimension correlations are found with the contrast, energy and homogeneity features on the saturation and value parts of the HSV color distribution. The hue part of the HSV color distribution does only correlate with the dominance dimension, on the features contrast and energy.
Edges
Correlation analysis between the Sobel and Canny edge features on the parts of the HSV color distribution and emotion dimensions can be found in the appendix of this document, it gives the following results. The Sobel edge features on the hue distribution do not show any correlations with the emotion dimensions. Correlations are found between the mean of the arousal and dominance dimensions and the Canny edges of saturation and value distributions. Extracting the Sobel edge features in a horizontal or vertical direction does not add any correlations opposed the features extracted in both directions. Sobel edge features extracted in both directions do show correlation with the standard deviation of the dominance dimension. The Canny edge features do not show any correlation. The differences in the amount of correlating features is probably because the Canny algorithm tends to have a higher recall than the Sobel algorithm and produces more dense images. It is possible that other statistics on the images produced by the Canny algorithm do show other correlations.
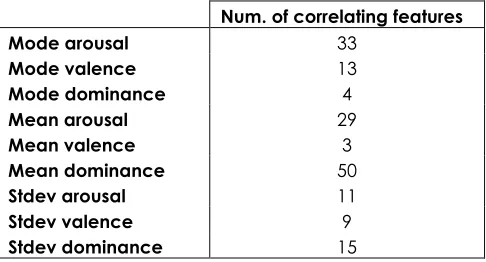
Totals
Num. of correlating features
Mode arousal 33
Mode valence 13
Mode dominance 4
Mean arousal 29
Mean valence 3
Mean dominance 50
Stdev arousal 11
Stdev valence 9
[image:30.612.93.336.90.221.2]Stdev dominance 15
Table 13 - numbers of correlating features
The table shows a high number of features that correlate with the arousal and dominance dimensions and less with the valence dimension. It is possible there are less image features that relate to the valence emotion dimension in general or just that most of the extracted features are related to the arousal and dominance dimensions. The number of features related to the standard deviations of the emotion dimensions show that there is a possible relation of a number of image features and agreement between raters.
Correlating feature vector
The results of the correlation analysis between the extracted features of a painting and evaluation data on the emotion dimensions show the features that are somehow related to the emotion dimensions, only these features will be used for machine learning. The feature vector as it will be used for machine learning contains the following features:
• Statistical features
o A 10 bins histogram on the red distribution of RGB indexed pixels
o A 10 bins Histogram on the green distribution of RGB indexed pixels
o A 10 bins Histogram on the blue distribution of RGB indexed pixels o A 10 bins Histogram on the hue distribution of HVS indexed pixels
o A 10 bins Histogram on the saturation distribution of HVS indexed pixels o A 10 bins Histogram on the value distribution of HVS indexed pixels
o Entropy of the red distribution of RGB indexed pixels
o Entropy of the green distribution of RGB indexed pixels o Entropy of the blue distribution of RGB indexed pixels
o Entropy of the hue distribution of HSV indexed pixels o Entropy of the saturation distribution of HSV indexed pixels
o Entropy of the value distribution of HSV indexed pixels
o Standard deviation of the red distribution of RGB indexed pixels o Standard deviation of the green distribution of RGB indexed pixels
o Standard deviation of the blue distribution of RGB indexed pixels
o Standard deviation of the saturation distribution of HSV indexed pixels
o Standard deviation of the value distribution of HSV indexed pixels • Texture features on the hue part of HSV indexed pixels
o Contrast derived from the GLCM at 0, 45, 90 and 135 degrees
o Energy derived from the GLCM at 0, 45, 90 and 135 degrees
• Texture features on the saturation part of HSV indexed pixels
o Contrast derived from the GLCM at 0, 45, 90 and 135 degrees
o Energy derived from the GLCM at 0, 45, 90 and 135 degrees o Homogeneity derived from the GLCM at 0, 45, 90 and 135 degrees • Texture features on the value part of HSV indexed pixels
o Crontrast derived from the GLCM at 0, 45, 90 and 135 degrees
o Correlation derived from the GLCM at 0, 45, 90 and 135 degrees
o Energy derived from the GLCM at 0, 45, 90 and 135 degrees o Homogeneity derived from the GLCM at 0, 45, 90 and 135 degrees • Edge features on the saturation and value part of HSV indexed pixels
o Mean of the grayscale distribution of the Sobel edge enhanced image on the horizontal, vertical and both directions
7.4.
C
OMPARISON OF MACHINE LEARNING ALGORITHMS
The program Weka is used for machine learning and classification. Some well known machine learning algorithms are used; Bayes Net, Naïve Bayes, MultiLayer Perceptron, Random Forest, Naïve Bayes Tree and Decision Stump with AdaBoost.
The configuration parameters of these classifiers can be found in the appendix “Weka classifiers and configuration”.
As test mode a 15 fold cross-validation is used, each classifier is tested 100 times, this results in 1500 classifications on each emotion dimension per classifier.
To increase the accuracy the size of used feature vector is decreased in iterations. The first vector contains 114 features. In relation with the size of the corpus, this can be a cause for poor accuracy of the classifiers. The methods used to evaluate the features are Information Gain, Relief Attribute Evaluation, SVM Attribute Evaluation and Symmetrical Uncertain Attribute Evaluation from the WEKA application. The results from these methods give a ranking on each of the features. The overall best ranking features on each of the emotion dimensions are used in the next iteration of machine learning. The results can be found in the appendix “Feature selection on the emotion dimensions”.
Accuracy is measured by the percent of correct classifications. The MAE iscomputed by summing the absolute difference between the actual and predicted target value for each instance and then taking the average.
The results are discussed for each of the emotion dimensions, arousal, dominance and valence. The results are discussed for classifiers trained with the best performing number of features.
On the arousal emotion dimension
The result on the arousal dimension show that most classifiers have an accuracy around 50% to 70%. The classifiers with the best accuracy are; the Naive Bayes classifier trained with 2 features (accuracy 73.33%, MAE 0.16) and the Decision Stump with Ada Boost classifier trained with 1 feature (accuracy 73.33%, MAE 0.27). The Naïve Bayes classifier shows a decrease on performance when leaving out the feature ‘standard deviation on the green part of the RGB distribution’ where the other classifiers show an increase. The overal best performing classifier is the Naive Bayes classifier trained with the features ‘Sobel edge in both directions on the value part of the HSV distribution’ and ‘standard deviation on the green part of the RGB distribution’.
On the dominance emotion dimension
The results on the dominance dimension show a highest accuracy of 46.67% for the classifier Naive Bayes. The rest of the classifiers score below 40% on accuracy. The MAE shows the best performance for the Naive Bayes classifier. The Naïve Bayes classifier trained with 5 and 3 features both reach an accuracy of 46.67%, the MAE on 5 features is 0.28 and on 3 features is 0.29. This makes the Naive Bayes classifier trained with 5 features the best performing classifier on the dominance dimension (accuracy 46.67%, MAE 0.28). The used features are; ‘standard deviation on the saturation part of the HSV distribution’, ‘Sobel edge in both directions on the value part of the HSV distribution’, ‘standard deviation on the green part of the RGB distribution’, ‘energy of the GLCM on 135 degrees on the hue part of the HSV distribution’ and ‘standard deviation on the blue part of the RGB distribution’.
On the valance emotion dimension
The results on the valence emotion dimension show a highest accuracy of 73.33% for the classifiers Naïve Bayes Tree trained with 1 feature and Decision Stump with Ada Boost trained with 10 to 1 features, the other classifiers all have an accuracy below 60%. On the MAE measures the best performing classifiers are Naive Bayes trained with 4 and 3 features (MAE 0.25) and Random Forest trained with 3 features (MAE 0.25), followed by Naive Bayes Tree trained with 1 feature (MAE 0.28). This makes the Naïve Bayes Tree trained with the feature ‘contrast of the GLCM on 90 degrees on the value part of the HSV distribution’ the preferred classifier for the valence emotion dimension.
On computation costs
Classifier CPU time
Bayes Net 0.04001706
Naive Bayes 0.00432605
Multilayer Perceptron 1.10086279
Random Forest 0.57783088
Naïve Bayes Tree 0.07789188
[image:33.612.91.315.90.184.2]Decision Stump with Ada Boost 0.03780720
Table 14 – classifiers and computation costs
Compared to human observers
To compare the classifiers algorithms to human raters, the overall accuracy and mean absolute error of the human raters is calculated on the corpus. They are found in the table below.
Emotion dimension Accuracy Mean absolute error
Arousal 41.71% 0.86
Dominance 41.71% 0.78
Valence 37.44% 0.97
Table 15 - accuracy and MAE on human raters
Compared to the classifier algorithms the human raters have a lower accuracy on all dimensions, also the MAE is much higher than that of the classifier algorithms.