ORIGINAL RESEARCH
BRAIN
Whole-Brain Diffusion Tensor Imaging in Correlation to
Visual-Evoked Potentials in Multiple Sclerosis: A Tract-Based
Spatial Statistics Analysis
D. Lobsien, B. Ettrich, K. Sotiriou, J. Classen, F. Then Bergh, and K.-T. Hoffmann
ABSTRACT
BACKGROUND AND PURPOSE: Functional correlates of microstructural damage of the brain affected by MS are incompletely under-stood. The purpose of this study was to evaluate correlations of visual-evoked potentials with microstructural brain changes as deter-mined by DTI in patients with demyelinating central nervous disease.
MATERIALS AND METHODS: Sixty-one patients with clinically isolated syndrome or MS were prospectively recruited. The mean P100 visual-evoked potential latencies of the right and left eyes of each patient were calculated and used for the analysis. For DTI acquisition, a single-shot echo-planar imaging pulse sequence with 80 diffusion directions was performed at 3T. Fractional anisotropy, radial diffusivity, and axial diffusivity were calculated and correlated with mean P100 visual-evoked potentials by tract-based spatial statistics.
RESULTS:Significant negative correlations between mean P100 visual-evoked potentials and fractional anisotropy and significant positive correlations between mean P100 visual-evoked potentials and radial diffusivity were found widespread over the whole brain. The highest significance was found in the optic radiation, frontoparietal white matter, and corpus callosum. Significant positive correlations between mean P100 visual-evoked potentials and axial diffusivity were less widespread, notably sparing the optic radiation.
CONCLUSIONS: Microstructural changes of the whole brain correlated significantly with mean P100 visual-evoked potentials. The distribution of the correlations showed clear differences among axial diffusivity, fractional anisotropy, and radial diffusivity, notably in the optic radiation. This finding suggests a stronger correlation of mean P100 visual-evoked potentials to demyelination than to axonal damage.
ABBREVIATIONS:AD⫽axial diffusivity; FA⫽fractional anisotropy; FMRIB⫽Functional MR Imaging of the Brain; mVEP⫽mean P100 visual-evoked potentials latencies; RD⫽radial diffusivity; VEP⫽visual-evoked potentials
M
R imaging plays a pivotal role in establishing the diagnosis and follow-up of MS.1,2Besides conventional MR imaging,an advanced technique frequently used in MS studies is DTI.3By
measuring the diffusion directions of water molecules, DTI is capable of detecting microstructural changes not visible on standard MR im-aging. Common parameters obtained from DTI to assess these
changes are fractional anisotropy (FA) and mean diffusivity. Re-cently, mean diffusivity was further analyzed and divided into radial diffusivity (RD) and axial diffusivity (AD), parameters that allow a more specific approach to the underlying microstructural changes.4,5
AD was shown to be the primary correlate for histologic markers of axonal integrity,4while RD was suggested to provide a specific tool to
assess demyelination, distinct from axonal damage.5
Pattern reversal visual-evoked potentials (VEP) are an estab-lished tool for the evaluation of the optic pathway within the diagnostic work-up of MS, especially as a marker of the integrity of the prechiasmal part.6-8However, they failed to provide
reli-able results in predicting lesions of the retrochiasmal part.9,10
Evoked potentials, in general, and combined evoked potential analysis, in particular, seem to correlate well with the long-term disability of patients with MS. Correlations of evoked potentials and MR imaging are reported controversially. While some studies showed no correlations between evoked potentials and MR imag-ing,11other studies reported significant correlations between VEP
and T2 lesion load.12However, to the best of our knowledge, a
correlation of DTI with VEP has not been published.
Received January 14, 2014; accepted after revision May 16.
From the Departments of Neuroradiology (D.L., K.-T.H., K.S.) and Neurology (B.E., F.T.B., K.S., J.C.), University and University Hospital Leipzig, Leipzig, Germany.
D. Lobsien and B. Ettrich contributed equally to this work. F. Then Bergh and K.-T. Hoffman contributed equally to this work.
This work was supported by the German Federal Ministry of Education and Re-search (PtJ-Bio, 0313909, to B.E. and F.T.B.) and the Hellenic Society of Neurology (to K.S.).
Paper previously presented in part as a poster at: Annual Meeting of the American Academy of Neurology, April 21–28, 2012; New Orleans, Louisiana.
Please address correspondence to Donald Lobsien, MD, Department of Neuroradi-ology, University and University Hospital Leipzig, Liebigstr 20, 04103 Leipzig, Germany; e-mail: [email protected]
Indicates open access to non-subscribers at www.ajnr.org
The aim of our study was, therefore, to evaluate the correlation of VEP with parameters derived from DTI with the following objectives: 1) to identify potential relations of VEP to microstruc-tural changes, and 2) to analyze whether such changes reflect de-myelination or axonal damage.
MATERIALS AND METHODS
The study was approved by the local ethics committee of the Uni-versity of Leipzig.
Patients
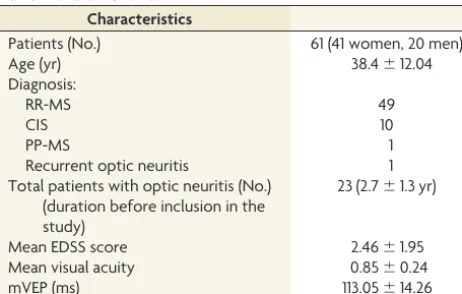
[image:2.594.54.285.54.201.2]Sixty-one patients (41 women, 20 men) with clinically isolated syndrome or MS were prospectively recruited from the Neuroim-munology Clinic of the Department of Neurology. Ten patients were classified as having clinically isolated syndrome, 49 had def-inite MS with a relapsing-remitting course, 1 had primary-pro-gressive MS, and 1 had recurrent optic neuritis but did not fulfill the criteria for neuromyelitis optica. The mean age was 38.4⫾ 12.0 years, and the mean Expanded Disability Status Scale score was 2.46⫾1.95. All patients underwent a neurologic examina-tion, a standard VEP examinaexamina-tion, and brain MR imaging, in-cluding DTI at 3T (see below). Clinical data are shown in the Table. All clinical, electrophysiologic, and imaging examinations in each patient were performed within 3 months. Patients were free of an acute relapse as defined by clinical criteria (history and neurologic examination) for at least 6 months before the first examination and during the study period. None of the patients had a gadolinium-enhancing lesion on T1-weighted images after contrast administration.
Visual-Evoked Potentials
All VEP were recorded by using the same electrophysiologic de-vice (Medelec Synergy; Oxford Instruments, Oxfordshire, United Kingdom). Stimulation was performed according to standard protocols by checkerboard pattern reversal by using a computer screen at a distance of 1.25 m with a check size of 60 minutes of arc. Latencies of N70 and P100 and N70/P100 amplitudes were determined for all recordings with identifiable VEP. Normal mean laboratory values for P100 latency were determined previ-ously in 30 healthy, 20- to 60-year-old controls at 101.0⫾6.0 ms. The mean P100 VEP latencies (mVEP) of the right and the left eyes of each patient were calculated.
MR Imaging
DTI scans were acquired on a clinical 3T MR imaging scanner (Magnetom Trio; Siemens, Erlangen, Germany). A single-shot, echo-planar imaging pulse sequence with the following parame-ters was performed in all patients: TR, 2700 ms; TE, 93 ms; flip angle, 90°; parallel imaging; 80 diffusion-encoding gradient direc-tions; 1 B0 image;b⫽1000 s/mm2; matrix size, 128⫻128; voxel
size, 1.8⫻1.8⫻5 mm. Additionally, standard diagnostic MR imaging sequences were applied, including FLAIR and a T1-weighted axial sequence, after the administration of gadolinium contrast at a standard dosage. A 12-channel head coil was used for all sequences.
DTI Data Analysis
DTI analysis was performed in a standardized, voxel-based, rater-independent manner by applying tract-based spatial statistics, which belongs to the Functional MRI of the Brain Software Li-brary (FMRIB [FSL; http://www.fmrib.ox.ac.uk/fsl]).13
Images were preprocessed by using eddy_correct, the Brain Extraction Tool, and DTIFit in FSL to correct motion and eddy current artifacts, extract the brain, and calculate FA, AD, and RD. All subjects’ FA data were then aligned to a 1⫻1⫻1 mm stan-dard space (FMRIB58_FA) and averaged, and the mean FA image was skeletonized. The skeleton was then thresholded at an FA value of 0.2. Following this step, each FA image was projected onto the mean FA skeleton common to all subjects. The same nonlinear transformations derived from the FA maps were ap-plied to the AD and RD maps.
The imaging data were subsequently analyzed by using the Randomise Tool (http://www.fmrib.ox.ac.uk/fsl/randomise/). We set up the General Linear Model design with mVEP as a con-tinuous variable of interest and tested for correlations with diffu-sion parameters (FA, RD, AD), controlled for the effect of age and sex (covariates of noninterest). All the data were mean-centered. Cluster-like structures were enhanced by using the threshold-free cluster enhancement method. Statistics were built over 10,000 permutations with the maximum threshold-free cluster enhance-ment recorded at each permutation. The 95th percentile of this distribution was used as a threshold-free cluster enhancement threshold, and the significance level was calculated from this dis-tribution. Thus, significant clusters were fully corrected for fam-ily-wise error atP⬍.05.
Additionally, we calculated the mean FA, RD, and AD in 2 manually selected ROIs of the skeleton. These ROIs correspond to the thalamic radiations (including the optic radiations) according to the ICBM DTI-81 Atlas (http://www.loni.usc.edu/ICBM/ Downloads/Downloads_DTI-81.shtml), which is included in the FMRIB Software Library package. The results of each subject (1 value per patient and parameter, ie, the mean of the 2 ROIs) and each DTI-derived parameter were correlated with the mVEP by using the Spearman rank coefficient. The correlation was per-formed with GraphPad Prism 4 software (GraphPad Software, San Diego, California).
Lesion Maps
The T2-FLAIR datasets of all patients were coregistered to a 1⫻ 1⫻1 mm standard space (Montreal Neurological Institute 156)
Patient characteristics Characteristics
Patients (No.) 61 (41 women, 20 men)
Age (yr) 38.4⫾12.04
Diagnosis:
RR-MS 49
CIS 10
PP-MS 1
Recurrent optic neuritis 1
Total patients with optic neuritis (No.) (duration before inclusion in the study)
23 (2.7⫾1.3 yr)
Mean EDSS score 2.46⫾1.95
Mean visual acuity 0.85⫾0.24
mVEP (ms) 113.05⫾14.26
by using the FMRIB Linear Image Registration Tool to assess white matter lesions. Hyperintense lesions on the T2-FLAIR im-ages of all patients were manually segmented and transformed into binary masks by using FSLView (http://fsl.fmrib.ox.ac.uk/fsl/ fslview/). Afterward, the masks were summarized with FMRIB’s fslmaths and plotted by using a colorized scale to indicate regions with a high or low incidence of lesions among the subjects. The resulting maps were merged with the results of the tract-based spatial statistics analysis to qualitatively identify whether changes were related to normal-appearing white matter or to lesions.
RESULTS
Whole-Brain Fractional Anisotropy
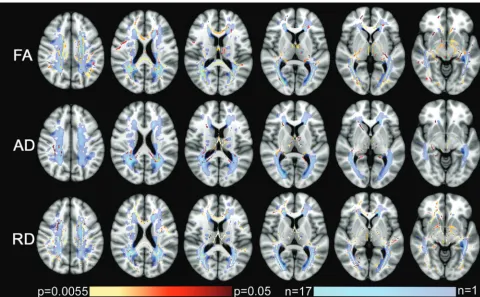
Significant negative correlations were found between FA and mVEP (the longer the mVEP, the more decreased was the FA) in widespread regions of the brain. The most significant regions (up toP⬍.0055) were located in the optic radiation, frontoparietal white matter, medial thalamus, fornix bilaterally, and splenium of the corpus callosum. The correlations within the splenium of the corpus callosum and in the fornix included areas of predomi-nantly normal-appearing white matter. Further significant corre-lations (P ⬍ .05) were found in multiple locations along the skeleton, including the genu of the corpus callosum, the fronto-parietal white matter, and the internal capsule bilaterally. In the
genu of the corpus callosum and the adjacent frontal white mat-ter, a slight asymmetry was detected with a more significant relation on the right side, while, in the internal capsule, the cor-relations were a little more significant on the left side. Results are shown in Fig 1.
Whole-Brain Radial Diffusivity
Multiple significant correlations were found between RD and mVEP (the longer the mVEP the more increased was the RD) along the skeleton. Correlations with the highest significance (up toP⬍.0055) were found in the corpus callosum and bilaterally in the frontoparietal white matter, thalamus, fornix, internal cap-sule, and optic radiation. In the corpus callosum and the right frontal white matter and the left frontotemporal white matter, these correlations were located in normal-appearing white mat-ter. Voxels of lower significance could be found as well in all these areas. There was a slight asymmetry with more significant corre-lations in the right frontal white matter. Results are shown in Fig 1.
Whole-Brain Axial Diffusivity
Compared with the widespread regions in which FA and RD cor-related to mVEP, much more restricted areas showed a positive correlation between AD and mVEP. Correlations with the highest
[image:3.594.54.535.46.343.2]significance (P⬍.0055) were found only in the fornix and thala-mus bilaterally. Correlations of lower significance were found bi-laterally in the splenium of the corpus callosum, the periventricu-lar parietal white matter, the frontoparietal white matter, the right frontal white matter, and the anterior limb of the right internal capsule. There were no correlations in the optic radiations. Re-sults are shown in Fig 1.
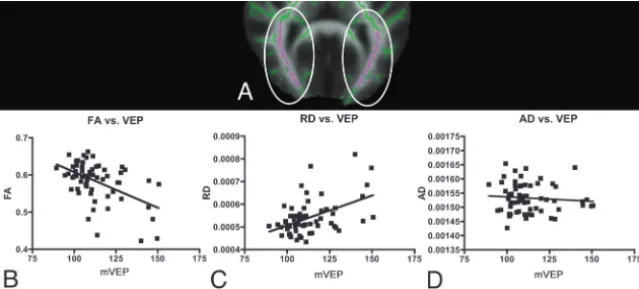
Optic Radiation Region-of-Interest Analysis
There was a highly significant correlation in the ROIs along the skeleton corresponding to the optic radiation between mean RD and mVEP, a highly negative correlation between mean FA and mVEP, and no correlation between mean AD and mVEP. The results are shown in Fig 2.
DISCUSSION
We analyzed the relationship between VEP latencies and cerebral microstructure as measured by different parameters of DTI in 61 subjects with demyelinating diseases. A strong positive correla-tion was found between mVEP and RD, and a strong negative correlation, between mVEP and FA in various areas of the brain, whereas very few positive correlations were found between AD and mVEP.
Analysis of Whole-Brain Correlation Patterns
We found far more correlations of the mVEP with RD and FA than with AD. Similar patterns of RD, AD, and FA were reported previously, despite different study designs or correlations with different clinical parameters.
For example, in a study by Liu et al,14the degree of disability of
patients with MS correlated strongly with RD and FA but not with AD in disseminated areas of the brain, including the thalamus and optic radiation. Additionally, they found correlations among RD, FA, and disease duration, which, in turn, correlated poorly with AD. Sbardella et al15reported a strong correlation between
mul-tiple sclerosis functional composite subscales and FA in various
areas of the brain regarding almost the whole skeleton, while Onu et al16found
significant correlations between clinical motor scores and both FA and RD but not AD.
The widespread correlations of mVEP in our study can be considered an in vivo equivalent to the observations in a post-mortem study by Klawiter et al,17 in
which RD was predominantly associated with demyelination and, to a much lesser degree, with axonal loss; hence, RD was postulated as a marker of overall tissue in-tegrity within MS lesions. AD, conversely, seemed to be a less sensitive marker be-cause it showed a poor correlation with axonal loss in the same study. Further-more, postmortem studies suggested that RD and FA could be considered surro-gates of cerebral myelin content in pa-tients with MS.18In mice, RD was
identi-fied as a demyelination marker, and AD was identified as an axonal damage marker.5
In accordance with the literature, our results seem to support the hypothesis that RD could possibly serve as an overall marker for tissue damage caused by MS that correlates not only with clinical parameters of cognitive and motor impairment but also with results of electrophysiologic examinations of the visual sys-tem. The prolonged VEP latency might be caused mainly by de-myelination, which seems reasonable, because myelination is a main determinant in the speed of action-potential propagation along the axon.
Analysis of the Visual Tract
We found a strong correlation between mVEP and RD as well as FA, but not with AD, when focusing on the optic radiation, sim-ilar to whole-brain analysis. In the literature, simsim-ilar patterns of RD, AD, and FA have been reported, despite different study de-signs and correlations with different clinical parameters.
Liu et al19found significant differences between patients and
controls in the optic radiation that were present bilaterally in RD and mean diffusivity but only unilaterally in the AD analysis. In another study, they also found significant differences in the optic radiation between patients and controls for RD and FA but not for AD.14 Rueda Lopes et al20 also found significant differences
within the optic radiation for RD and FA but not for AD in their study of patients with neuromyelitis optica. Roosendaal et al21
found a significantly lower FA within the optic radiation, includ-ing areas with MS lesions and normal-appearinclud-ing white matter in patients with MS in comparison with healthy controls. Onu et al16
found a significant difference between patients with MS and con-trols for RD and FA in the optic radiation. However, in a recent study, Kolbe et al22found no correlation of visual acuity in optic
neuritis with DTI parameters within the optic radiation but did find a correlation within prefrontal and temporal brain regions.
Optic pathway involvement is common in MS, in the acute phase and in chronic stages.23VEP show a correlation with
mea-sures of visual acuity and disease severity, though there are
[image:4.594.54.374.48.192.2]troversies regarding the correlation with the clinical course of the disease.8If we take these aspects into account, the relation
be-tween the electrophysiologic function (mVEP) and the micro-structural damage (DTI) we found seems very reasonable.
Analysis of Normal-Appearing White Matter and Deep Gray Matter of the Fornix and Thalamus
In contrast to most other areas that showed correlations to mVEP, we found a highly significant correlation of mVEP with both an AD and RD increase and with an FA decrease in the fornix bilat-erally and in the medial aspects of the thalamus, all being areas of normal-appearing white or deep gray matter, respectively.
Concerning changes of the fornix in MS, the literature is lim-ited. Kern et al24found significantly reduced FA in patients with
MS compared with healthy controls in the fornix in a study of verbal memory function. Higher FA values correlated with a bet-ter performance in verbal memory tests in patients. The authors concluded that successful functional compensation of hippocam-pal involvement might be limited in part by damage to the fornix, consistent with the critical role of this pathway in the clinical expression of memory impairment in MS. This limitation could be a direct consequence of demyelination and an indirect result of primary hippocampal damage.25
Roosendaal et al21found clearly reduced FA in both fornices
by using a tract-based spatial statistics– based analysis, mainly fo-cusing on normal-appearing white matter. Similar to Kern et al,24
they assumed at least 2 reasons for this: 1) secondary degeneration caused by disseminated focal demyelination of the hippocampus, and 2) direct demyelination of the fornix, both of which had been demonstrated in postmortem studies of patients with MS. Exper-imental studies in rats identified important functions of hip-pocampal projections for spatial-visual perception, and animals with fornix lesions performed substantially worse than healthy ones in visual shape recognition.25,26
It is unclear why in our study, mVEP correlated so significantly with all 3 DTI metrics in this specific white matter tract that is not directly associated with visual function. A hypothesis is that sec-ondary and primary pathologic changes might play a role in this structure; therefore, both demyelination and axonal damage are present. This hypothesis could explain the significant correlation with AD, RD, and FA in the fornix in contrast to the correlation patterns in most other brain structures.
Regarding the thalamus in MS, there is very little literature dealing specifically with DTI. Extensive, confluent, subependy-mal thalamic demyelination is relatively common as is diffuse microglial activation in normal-appearing thalami, indicating di-rect and secondary tissue damage.27This finding seems to support
ours of rather mixed changes with a correlation pattern pointing to various causes of thalamic tissue alterations in demyelinating disease (ie, both primarily and secondarily induced damage).
Limitations
There are some limitations of our study. The patient sample was not homogeneous in terms of sex. Although reflecting the normal sex distribution of MS, an implication on the results is possible because sex-specific differences in various aspects of DTI analyses were found in other studies.28Therefore, we corrected for sex as a
covariate of noninterest. However, because our major aim was to analyze the correlation between mVEP and DTI and not to eval-uate sex differences, we did not perform subgroup analyses.
Concerning technical aspects, the DTI sequence used has a relatively low resolution on the z-axis. This could bias the detec-tion of correladetec-tions, especially in small structures, to an unknown extent. However, the technique used is in line with recent litera-ture referring to this topic, which is relatively heterogeneous. For example, in the literature, section thickness ranges from approx-imately 2–5 mm; some studies use gaps between sections and varying field strengths, and various numbers of diffusion gradi-ents (among other parameters) are applied.16,19,21Finally, the
ex-act histopathologic processes responsible for changes detected by DTI are understood only in part; therefore, conclusions must be interpreted with caution.
CONCLUSIONS
Our results show that widespread microstructural changes of the whole brain in MS correlate significantly with VEP. Clear differ-ences among AD, FA, and RD, notably in the optic radiation, suggest a stronger correlation of mVEP with demyelination than with axonal damage. In conjunction with the literature, our re-sults support the hypothesis that the parameters FA, RD, and AD could serve potentially as relevant imaging markers for demyeli-nating disease staging and burden quantification beyond the ap-plication in clinical studies.
ACKNOWLEDGMENTS
We thank Alfred Anwander, MD, for helpful technical hints with DTI data analysis.
Disclosures: Barbara Ettrich—RELATED:Grant: Federal Ministry of Education and Re-search, through the Translational Centre for Regenerative Medicine.* Konstantinos Sotiriou—RELATED:Grant: Hellenic Neurological Society,Comments: I received a grant from the Hellenic (Greek) Neurological society, for my fellowship in the Neuroradiology Department of the University Hospital in Leipzig, Germany. Florian Then Bergh— RELATED:Grant: Federal Ministry of Education and Research through the Translational Centre for Regenerative Medicine,*UNRELATED:Board Membership: I received per-sonal compensation for activities with Bayer, Biogen Idec, Novartis, Merck-Serono, and Sanofi-Aventis Pharmaceuticals as a speaker and/or member on an advisory board, Grants/Grants Pending: I received research support from Bayer Pharmaceuticals Cor-poration* and Teva Neuroscience,*Payment for Lectures (including service on Speakers Bureaus): I received personal compensation for activities with Bayer, Biogen Idec, No-vartis, Merck-Serono, and Sanofi-Aventis Pharmaceuticals as a speaker and/or member on an advisory board. *Money paid to the institution.
REFERENCES
1. Ciccarelli O, Toosy AT, Hickman SJ, et al.Optic radiation changes after optic neuritis detected by tractography-based group mapping.
Hum Brain Mapp2005;25:308 –16
2. Vigeveno RM, Wiebenga OT, Wattjes MP, et al.Shifting imaging targets in multiple sclerosis: from inflammation to neurodegenera-tion.J Magn Reson Imaging2012;36:1–19
3. Filippi M, Rocca MA, De Stefano N, et al.Magnetic resonance tech-niques in multiple sclerosis: the present and the future.Arch Neurol
2011;68:1514 –20
4. Budde MD, Xie M, Cross AH, et al.Axial diffusivity is the primary correlate of axonal injury in the experimental autoimmune enceph-alomyelitis spinal cord: a quantitative pixelwise analysis.J Neurosci
2009;29:2805–13
5. Song SK, Yoshino J, Le TQ, et al.Demyelination increases radial diffusivity in corpus callosum of mouse brain. Neuroimage
6. Halliday AM, McDonald WI, Mushin J.Visual evoked response in diagnosis of multiple sclerosis.Br Med J1973;4:661– 64
7. Lascano AM, Brodbeck V, Lalive PH, et al.Increasing the diagnostic value of evoked potentials in multiple sclerosis by quantitative topo-graphic analysis of multichannel recordings.J Clin Neurophysiol
2009;26:316 –25
8. Weinstock-Guttman B, Baier M, Stockton R, et al.Pattern reversal visual evoked potentials as a measure of visual pathway pathology in multiple sclerosis.Mult Scler2003;9:529 –34
9. Benbadis SR, Lancman ME, Wolgamuth BR, et al.Value of full-field visual evoked potentials for retrochiasmal lesions.J Clin Neuro-physiol1996;13:507–10
10. Plant GT, Kermode AG, Turano G, et al.Symptomatic retrochiasmal lesions in multiple sclerosis: clinical features, visual evoked poten-tials, and magnetic resonance imaging.Neurology1992;42:68 –76 11. Schlaeger R, D’Souza M, Schindler C, et al.Combined evoked
poten-tials as markers and predictors of disability in early multiple scle-rosis.Clin Neurophysiol2012;123:406 –10
12. Kantorova´ E, Ziak P, Kurca E, et al.Visual evoked potential and magnetic resonance imaging are more effective markers of multiple sclerosis progression than laser polarimetry with variable corneal compensation.Front Hum Neurosci2014;8:10
13. Smith SM, Jenkinson M, Johansen-Berg H, et al.Tract-based spatial statistics: voxelwise analysis of multi-subject diffusion data. Neuro-image2006;31:1487–505
14. Liu Y, Duan Y, He Y, et al.Whole brain white matter changes re-vealed by multiple diffusion metrics in multiple sclerosis: a TBSS study.Eur J Radiol2012;81:2826 –32
15. Sbardella E, Petsas N, Tona F, et al.Assessing the correlation be-tween grey and white matter damage with motor and cognitive im-pairment in multiple sclerosis patients.PloS One2013;8:e63250 16. Onu M, Roceanu A, Sboto-Frankenstein U, et al.Diffusion
abnor-mality maps in demyelinating disease: correlations with clinical scores.Eur J Radiol2012;81:e386 –91
17. Klawiter EC, Schmidt RE, Trinkaus K, et al.Radial diffusivity
pre-dicts demyelination in ex vivo multiple sclerosis spinal cords. Neu-roimage2011;55:1454 – 60
18. Schmierer K, Wheeler-Kingshott CA, Boulby PA, et al.Diffusion ten-sor imaging of post mortem multiple sclerosis brain.Neuromage
2007;35:467–77
19. Liu Y, Duan Y, He Y, et al.A tract-based diffusion study of cerebral white matter in neuromyelitis optica reveals widespread patholog-ical alterations.Mult Scler2012;18:1013–21
20. Rueda Lopes FC, Doring T, Martins C, et al.The role of demyelin-ation in neuromyelitis optica damage: diffusion-tensor MR imag-ing study.Radiology2012;263:235– 42
21. Roosendaal SD, Geurts JJ, Vrenken H, et al.Regional DTI differences in multiple sclerosis patients.Neuroimage2009;44:1397– 403 22. Kolbe SC, Marriott M, Walt Av, et al.Diffusion tensor imaging
cor-relates of visual impairment in multiple sclerosis and chronic optic neuritis.Invest Ophthalmol Vis Sci2012;53:825–32
23. Jasse L, Vukusic S, Durand-Dubief F, et al.Persistent visual impair-ment in multiple sclerosis: prevalence, mechanisms and resulting disability.Mult Scler2013;19:1618 –26
24. Kern KC, Ekstrom AD, Suthana NA, et al.Fornix damage limits verbal memory functional compensation in multiple sclerosis.
Neuroimage2012;59:2932– 40
25. Gaffan EA, Bannerman DM, Warburton EC, et al.Rats’ processing of visual scenes: effects of lesions to fornix, anterior thalamus, mamil-lary nuclei or the retrohippocampal region. Behav Brain Res
2001;121:103–17
26. Thomas AG, Koumellis P, Dineen RA.The fornix in health and disease: an imaging review.Radiographics2011;31:1107–21 27. Minagar A, Barnett MH, Benedict RH, et al.The thalamus and
mul-tiple sclerosis: modern views on pathologic, imaging, and clinical aspects.Neurology2013;80:210 –19