Marjon Pol
HEINEKEN9/19/2014
Improving the continuous flow
Author
M.J. (Marjon) Pol
Student number
s1005472
University
University of Twente
Master Program
Industrial Engineering & Management
Specialization
Production Logistics & Management
Graduation Date
19 September 2014
Graduation Committee
Dr. Ir. L.L.M. van der Wegen First supervisor
University of Twente
Dr. Ir. A. Al-Hanbali I. Schrama, MSc.
Second supervisor Company supervisor
Preface
After months of hard work, I am really proud to present this report which concludes my master Industrial Engineering and Management at the University of Twente. This master thesis marks the end of five years of studying, in which I developed myself and became what I am today. During my final internship at Heineken, I realized what I want in the future and what I stand for, and I owe my gratitude for this to many people.
First of all, I want to thank Heineken for giving me the opportunity for doing this research during five months at the brewery in Zoeterwoude. Everyone was really open and tried to help me out whenever they could. Soon after I started, I felt at home at the ‘five’, the packaging line at which my research took place. This is thanks to the operators, who welcomed me with their arms wide open, but special thanks goes out to Dennis Schoonveld and my day-to-day supervisor Inge Schrama. They involved me in the daily processes, which made me feel part of the team. Inge introduced me to everyone on the first day of my internship, and kept on thinking with me how to get the most out of these six months, not only for my research, but also looking at the future and my personal development. I also owe my gratitude to ‘my V-graph team’. Our work together the previous months was useful for my research, but we also really gained something for line 51. Improvements have been made, and a lot of these things would not have been possible without their input, support, contacts, and all the information about the process and Heineken.
Next to Heineken, also the University of Twente helped making this research possible. My first supervisor, Leo van der Wegen, has been involved almost from the very beginning, and his feedback helped to get this research to a higher level. My second supervisor, Ahmad Al-Hanbali gave his critical advice, mostly on the literature, which forms one of the foundations of this research. Although we decided that it was better to perform a simulation study instead of using analytical methods, Ahmad his feedback was really helpful. I am very grateful to both of my supervisors for their critical feedback, but also for the motivational words.
Next to that I want to thank the people who supported me, not only during my master thesis, but also during the rest of my study. A special thanks goes out to Freek, he listened to me every evening, came up with ideas and was not afraid to give his critical advice. Thank you for that, it really helped me to keep the goal in mind, but also find time to relax and enjoy everything.
After all these words of gratefulness, the only thing left is to wish you a pleasant time of reading this report.
Management Summary
To stay ahead of the competition on the competitive beer market, Heineken needs to increase efficiency continuously. Mainly, this means producing more in the same time, preferably with fewer resources than currently, to save costs and remain competitive in industry. One of the packaging lines for which this holds is line 51 of the Heineken brewery in Zoeterwoude, which fills and packages bottles of the Heineken brand for the USA market. The current performance of this line is below the target stated by management, and therefore improvements are necessary. Therefore, the objective of this research is to determine how the operational performance of packaging line 51 can be improved. As safety and quality are really important, the research is bounded by some constraints. This leads to the research question:
How can the performance of packaging line 51 of the Heineken Brewery in Zoeterwoude be improved, while taking into account the quality and safety regulations?
First the current performance is analysed, as the performance is below the target, which is mainly caused by lower output than expected, due to blocking and starvation of the machines in the process. The filling machines are the bottleneck, and over the first part of 2014 we see that the fillers are quite some time of the available production time not working due to breakdowns, blocking and starvation of the machines. To increase output and avoid as many disruptions as possible, a continuous flow should be created in the process. This flow is related to the availability and speed of machines in the process.
In the main part of the process, the speed of the machine is determined by the fill rate of the buffer in front of the machine. If the buffer is almost empty, the machine works on low speed, while the machine works on high speed when the buffer is (almost) full. To ensure a continuous flow on the line, which increases the output and therefore efficiency, it is important to determine right buffer strategy for the packaging line. The buffer strategy contains the settings for the different machines speeds (low, nominal, and high) and the fill rates at which the speed changes (buffer strategy).
To determine the buffer strategy for packaging line 51 a simulation model is developed and validated with current data, and using expert-knowledge from the process. The model is used to run experiments, which represent different scenarios. In the model, the packaging process is represented from the filling machines until the box packers. Five experimental factors are used:
• Fill rate at which the labellers change to nominal speed
• Fill rate at which the labellers change to high speed
• Fill rate at which the box packers change to nominal speed
• Fill rate at which the box packers change to high speed
First of all, 16 experiments are conducted which use different combinations of the settings for the fill rates at which machine speeds are changed (first 4 experimental factors). From these experiments we conclude:
• The moment of speed change for the labellers should be kept the same.
• The moment of speed change for the box packers should be changed, change to nominal and high speed at a lower fill rate than in the current settings.
• Implementing these changes reduces blocking time of the filling machines leading to annual savings.
The experiments where the high speed of box packer 511 is increased (experimental factor 5) are only conducted with the best scenarios from the first round of experiments. From these experiments we can conclude:
• Additional annual savings can be realized by increasing the speed of the box packer, not taking into account the effect the repair works have on the number of breakdowns.
• Buffer strategies should be adapted to the new speed for the labellers and box packers.
• Implementing these changes leads to an output increase of 1% per shift.
From the research, recommendations have been formulated. The main recommendations are:
• The advised buffer strategies should be implemented to increase the continuous flow on the packaging line.
• Repair works on the box packer 511 are beneficial for the process and should therefore be executed to increase the maximum speed.
• Optimizing buffer strategies on packaging lines have high benefits, and therefore more people should be educated in the process of changing the settings, so capacity is not impeding the implementation.
Table of Contents
Preface ... I
Management Summary ... II
Table of Contents ... IV
Abbreviations & Definitions ... VII
1. Introduction ... 1
1.1. Context description ... 1
1.1.1. Introduction Heineken ... 1
1.1.2. Introduction packaging department brewery Zoeterwoude ... 2
1.2. Research motivation ... 3
1.3. Problem description ... 3
1.4. Research objective ... 4
1.5. Scope of the research ... 4
1.6. Research approach ... 5
2. Packaging Line 51 ... 7
2.1. Packaging process ... 7
2.1.1. Machinery ... 7
2.1.2. Conveyers/buffers ... 8
2.2. Method ... 9
2.2.1. Quality checks ... 9
2.2.2. Efficiency measurement ... 10
2.2.3. Speed evaluation ... 11
2.2.4. Speed adjustment... 12
2.3. Organization ... 14
2.4. Current performance ... 15
2.4.1. Availability ... 15
2.4.2. V-graph ... 16
2.4.3. Speed changes ... 17
2.5. Conclusion ... 18
3. Literature ... 18
3.1. Classification of the packaging process ... 19
3.2. Variability ... 20
3.2.2. Controlling variability ... 21
3.2.3. Variability Pooling ... 21
3.3. Modelling variability and the effects ... 21
3.4. Analytical models ... 22
3.4.1. Effective process time variability... 23
3.4.2. Flow variability ... 23
3.4.3. Effects of variability - Queuing ... 24
3.5. Simulation models ... 27
3.5.1. Conducting a simulation study ... 27
3.5.2. Types of simulation models ... 29
3.6. Conclusion ... 29
4. Simulation study ... 31
4.1. Project specification ... 31
4.2. Model and input data ... 32
4.2.1. Simulation model ... 32
4.2.2 Input data ... 32
4.3 Model description ... 35
4.3.2 Model of the packaging line ... 35
4.3.2.2 Event control ... 38
4.3.2.3 Experimental factors ... 39
4.3.2.4 Performance measurement ... 39
4.3.3 Model validation ... 39
4.4 Experimental design ... 40
4.4.2 Experiment configuration ... 40
4.4.3 Warm-up period ... 42
4.4.4 Weekend ... 42
4.4.5 Number of replications ... 43
4.5 Analysis of results ... 43
4.6 Conclusion ... 47
5 Conclusion and recommendations ... 49
5.2 Conclusions ... 49
5.3 Discussion ... 51
5.4 Recommendations ... 52
5.6 Practical implications for Heineken ... 55
6 Bibliography ... 56
Appendix A: Definition OPI ... 57
Appendix B: Priority Chart 2014 ... 58
Appendix C: Layout of packaging line 51 ... 59
Appendix D: Detailed machinery description ... 60
Appendix E: Speed calculations V-graph... 64
Appendix F: States registration machines ... 65
Appendix G: Fitting distributions: Failure duration ... 66
Appendix H: Estimating buffer size ... 67
Appendix I: Warm-up period ... 68
Abbreviations & Definitions
Buffer strategy The machine settings which determine when the machine changes to another speed, and the speed it changes to.
CS&L Customer Service & Logistics
GSC Group Supply Chain
HNS Heineken Netherlands Supply
KPI Key Performance Indicator
MTBA Mean Time Between Assists
OEE Overall Equipment Effectiveness
OPI Operational Performance Indicator
OPI-NONA Operational Performance Indicator: No Orders, No Activity
Plano Flat folded empty carton box
1. Introduction
This chapter gives an overview of the research. Section 1.1 describes the research context by giving an introduction to the company and to the specific department in which the research is conducted. In the remainder of the chapter the research outline is given. This starts with the research motivation in Section 1.2, followed by the problem description (Section 1.3). In Section 1.4 the research objective is defined, after which the scope and approach of the research are described in Sections 1.5 and 1.6.
1.1. Context description
This section starts with a general introduction to Heineken, with a special focus on the location in Zoeterwoude. After the general introduction, the focus turns to the packaging department of the brewery in Zoeterwoude, where the research is conducted.
1.1.1. Introduction Heineken
Heineken is one of the leading companies in the brewery industry worldwide. They have an annual turnover of more than 18 billion euro and employ 76,191 people of which 4,053 FTE’s are working in the Netherlands.
The rich history of Heineken dates back from 1864, the year the brewery was founded in Amsterdam. In 1928 Heineken started to become a truly international player, starting with export to Asia in 1929 and to the United States in 1933. In the past 15 years numerous mergers and acquisitions changed the brewery landscape significantly, resulting in an increase in market share for the 4 main global players from 22% in 2000 to 41% in 2012.The most recent major acquisition was in 2012, when Heineken acquired Asian Pacific Breweries. Today, Heineken has 165 breweries worldwide, serving customers in no less than 178 countries. Besides Heineken, the world’s leading brand in the International Premium Segment IPS, the company offers an extensive range of products comprising approximately 250 brands, including various beers, cider and other beverages.
Since almost a century ago, Heineken is exporting beer and this created a solid foundation to become a strong international brand. In addition, Heineken has many global marketing campaigns that maintain its global and premium image and to outperform its competitors. This is why Heineken is by far the company with the highest export volume throughout the world, accounting for 29.1 million hectolitre.
More than 10 million hectolitres of beer is brewed within the Netherlands to be transported all over the globe. In total, this is about 7% of the Heineken beer volume worldwide. The beer is brewed and packed in three breweries (located in Zoeterwoude, Den Bosch and Wijlre) belonging to Heineken Netherlands Supply (HNS), and then transported to the customer by different means of transport. The breweries produce the Heineken brands in all kinds of packaging types and for all kinds of markets. Heineken Nederland Supply exports to more than 150 countries worldwide.
brewing and packaging. This research is conducted on the packaging department, which is introduced in the next section.
1.1.2. Introduction packaging department brewery Zoeterwoude
The packaging department of the brewery in Zoeterwoude consists of nine packaging lines, of which some are split up in several sub-lines. The lines are divided based on the type of packaging used and the destination of the products. An overview of the lines can be seen in Table 1. Each of these lines can both fill and package specific types of beer in specified packages. The nine packaging lines are divided over five rayons, which have a rayon manager as responsible. An overview of the organizational structure can be found in Figure 1. As this research will be conducted at Rayon 3, the organizational structure is split up in more detail for this rayon. At Rayon 3, production runs five days a week, 24 hours a day, and therefore three teams of operators are working on the packaging line.
Table 1: Overview of the packaging lines Heineken brewery Zoeterwoude
Figure 1: Organizational Structure Heineken Netherlands
Rayon Line number
Packaging Destination
1 1 Returnable bottles Local
9 50L kegs Local
2 2 (21,22) One way bottles Export
3 One way bottles Export
3 5 (51,52) One way bottles Export
4 6 Cans Export
4 (41,42) 4L kegs Local/Export
5 7 One way bottles Export
Rayon 3 produces one way bottles for the export market. The line is divided into two sub-lines, which both have two filling machines.
1.2. Research motivation
The beer market is a competitive market, with a few big global players. As one of these big global players, HNS needs to continuously realize efficiency improvements to reduce costs and stay ahead of the competition. Therefore, the production process has to be improved, as more products need to be produced, preferably with fewer resources, in less time, and with lower costs.
Within Heineken, the Overall Performance Indicator (OPI) is one of the key performance indicators (KPI) used. This OPI is determined as a product of availability, performance, and quality (see Appendix A) like the overall equipment effectiveness (OEE) in Total Productive Maintenance (TPM) Invalid source specified.. Every shift the OPI is measured and determined. Currently, the OPI of packaging line 51 is below the target for 2014 as stated by the head office, while this is one of the brewery’s priorities for 2014 (see Appendix B). To fulfil the demand from the market while keeping the costs as low as possible, efficient use of the available production hours is important for Heineken. Therefore, the OPI on packaging line 51 needs to be increased.
1.3. Problem description
Globally, Heineken is measuring the efficiency of the packaging lines using OPI. This is done based on the filling machines, which are seen as main machines and are the bottleneck in the process. The filling machines are the bottleneck machine to ensure the quality of the product. To ensure a high product quality, the filling machines should work as continuously as possible. Therefore, a packaging line is designed with the filling machine as machine with the lowest technical capacity.
For packaging line 51 of the Heineken brewery in Zoeterwoude, the availability and performance aspect of the OPI show room for improvement. As Heineken is operating in the food- and beverages industry, quality always has been focused on. Therefore, the current performance on the quality aspect of the OPI is on target. To reach the OPI target set by the head office, the availability and performance aspects need to be improved. Availability of the machines is related to breakdowns, which is a stop longer than 5 minutes as a result of mechanical, electrical/instrumentation failure on components, subassemblies or packaging line machinery and control systems (Heineken, 2011). The performance is determined by minor stops and speed losses, but also includes blocking and starvation of the machine (See Appendix A).
Efficient use of the available production hours is important for Heineken to fulfil the demand from the market. Therefore, both the time and frequency of breakdowns, minor stops, speed losses, blocking, and starvation should be reduced.
1.4. Research objective
Based on the problem description in Section 1.3, we can define the objective of this research:
The objective of this research is to determine how the operational performance of packaging line 51 can be improved.
To reach this research objective we need to determine the right speeds for the machines on production line 51 of Heineken to assure a continuous flow on the line. This speed is dependent on different factors, which have to be identified. Probably these are the buffer size, speeds of previous/next machines, chance of disruptions in the process, and the mean time to repair. Taking all necessary factors into account, the best machine speeds for packaging line 51 at the Heineken brewery in Zoeterwoude are determined.
Also, we look how continuous flow can be secured in case of disruptions. Several sensors are placed on the buffers of the line, which determine the fill level of the buffers. Based on these fill rates, machine speeds can be automatically adjusted to secure the continuous flow. Currently, the settings for these flow regulations are not optimal, as a lot of stop/start moments can be seen in the overview of actual machine speeds. Therefore, it is important to identify at which fill level of the buffers the machines should speed up or slow down.
1.5. Scope of the research
The research focuses on packaging line 51 of the Heineken brewery in Zoeterwoude, this choice is made by the company. Only the packaging process will be analysed, which starts with empty glass bottles entering the production floor, and ends when the pallets are ready to be transported to customers. This is the part which belongs to the filling/packaging department, while the brewing of the beer and the logistics of raw material and complete order handling are the responsibility of other departments. After completion of the research for line 51, we will also determine to which extend the results can be generalized to other packaging lines in the brewery in Zoeterwoude.
The research takes the current level of breakdowns as given, as this is the wish of Heineken. They want to improve the continuous flow with the current failure rate. Also, technical improvements are not in line with the study background in which this research is conducted. This means that we take the current level of failures and breakdowns as a restriction, and not focus on this reduction.
The second constraint is related to safety. The working environment has to be safe for the operators, and this bounds the possibilities. Heineken follows a zero accident policy, and therefore the safety levels of operations cannot be decreased.
1.6. Research approach
The research objective and the problem description, given in previous sections, lead to the following central research question:
How can the performance of packaging line 51 of the Heineken Brewery in Zoeterwoude be improved, while taking into account the quality and safety regulations?
To answer this research question, we divide the central question into several sub-questions. The answers of these sub-questions lead to a solution for the current problem as described in Section 1.3. In the description beneath the sub-questions the research method is briefly described.
The first step to answer the central research question is to understand the current process and the way Heineken measures performance on the packaging line. Therefore, Chapter 2 answers the question:
How is packaging line 51 currently performing?
This question is answered using information supplied by Heineken, its employees, and its information systems. Also, information is gathered by walking around on the production floor and gathering information from machines and operators. Chapter 2 discusses both the outline of the packaging line and the current performance as evaluated by Heineken.
Knowing the current performance, we need to determine which factors are important to create a continuous flow on the packaging line. Also, we need to evaluate how these factors can be modelled to analyse their influence on the continuous flow in the process. Therefore, we answer the question:
Which factors influence the continuous flow on a production line according to the literature, and
how can this be modelled to analyse the influence of these factors?
After the improvement areas for packaging line 51 are identified and a model is developed, we come up with changes necessary to increase the current performance and create a continuous flow on the packaging line. After identification of the possible improvements, a choice has to be made between the proposed changes. To make the right decision, evaluation of the influence on the organization and the impact on the process performance is necessary. The question answered in the second part of Chapter 4 is:
Which changes are most beneficial to increase the performance on packaging line 51?
2. Packaging Line 51
In this chapter, an overview of the process on packaging line 51 is given. We describe the packaging process in Section 2.1, after which the methods used on the packaging line, for measurement and system changes, are described in Section 2.2. Section 2.3 deals with the organization of the packaging line. The description is followed by an analysis of the current performance of the line and individual machines in Section 2.4.
2.1. Packaging process
Packaging line 51 in Zoeterwoude is a one-way bottle line. This means that the bottles used are new, directly from the manufacturer and will not return in the process after use. On line 51, only one type of bottles is used, named the 355K2. This means that the content of the bottles is 355 ml. There are several packaging options: carton boxes with six-packs, with interior partition, and trays. Independent of which packaging option is used in production, all the products are meant for export and will not appear on the domestic (Dutch) market. Mainly, this line produces for the USA market.
This section describes the process on line 51. The process description is divided into two parts: machinery (Section 2.1.1) and conveyers/buffers (Section 2.1.2).
2.1.1. Machinery
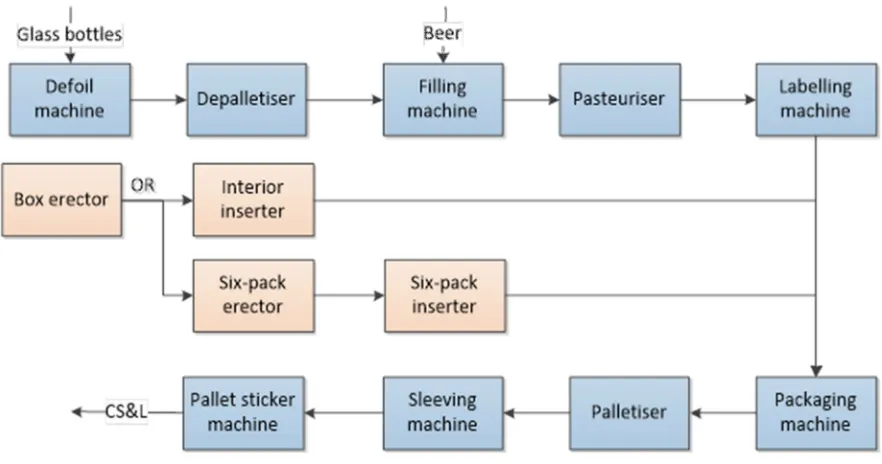
This paragraph gives a short process description of these main machines. Figure 2 shows the process of packaging line 51. The machines at the upper line of this figure are together named the ‘wet area’. The bottom line of the figure shows the machines in the ‘dry area’. The carton infeed also belongs to the dry area. Appendix C gives a layout overview of packaging line 51. Appendix D gives a detailed process description and indicates the main machines.
The packaging process starts with beer entering through pipes from the brewing process and pallets with new glass bottles entering from trucks. Then the protective foil is removed from the pallets by the defoil machine, after which the bottles are removed from the pallets by the depalletiser. The depalletiser puts every layer of bottles separately on the conveyer belt, leading to the rinsing/filling machines. Here the bottles are first rinsed with water, filled with beer, and then the bottles are closed with a crown cork. Next, they are transported to the pasteuriser, which heats the filled bottles to pasteurize the beer and increases the shelf life of the product. From there, the bottles continue to the labelling machine, after which they are ready for packaging.
On line 51, there are two ways of packaging. The first one is in carton boxes; the second one is to put the bottles on trays using the multipacker. As the multipacker is currently not used, we will only describe the packaging in carton boxes and the multipacker will be outside of the scope of the research.
by the closing machine. The closed boxes are transported to the palletiser, which puts seven layers of 12 boxes on a pallet. The pallet is covered with foil on the sleeving machine and is labelled by the sticker machine. Now the pallet is ready for transport, which is handled by Customer Service & Logistics (CS&L).
Figure 2: Process on packaging line 51, blue shows the flow of bottles, orange the infeed of carton
2.1.2. Conveyers/buffers
Between all machines in the process, conveyer belts are installed to transport the bottles or boxes to the next machine. These conveyers also function as buffers between the machines. The length and width of these conveyers determine the buffer capacity.
Some of the workstations along the line consist of single machines, but sometimes two machines are placed in parallel. To equalize the workload of parallel machines, the bottles are sometimes gathered together on one conveyer belt between the workstations, but split up again in front of the next machine. Division of workload over the machines is done based on congestion on the conveyer belt (See Figure 3 for an example).
Labeler 511
Labeler 512
Box packer 511
Box packer 512 20 %
80 %
50 % 50 %
[image:17.595.85.523.613.710.2]Speeds of the machines are partly related to the fill level of the buffers. Along the conveyer belts, sensors are placed to determine the fill level of the buffers. They are programmed to slow down or stop upstream machines when the buffer is (almost) full, and to speed up or start these machines when space is available in the buffer. Also the speed of downstream machines is managed using these sensors, but in the opposite way. The speed of the machine depends on the settings of the machine. How these are determined and adjusted is described in the next section.
2.2. Method
In this section, we describe the methods used at the line for measurement and system changes. As quality is the number one aspect at Heineken, we start with describing where in the process measurements for quality take place (Sections 2.2.1). Also, we describe the current methods used to evaluate overall efficiency and speed (Sections 2.2.2 and 2.2.3). In Section 2.2.4 we describe how the speed of machines can be adjusted.
2.2.1. Quality checks
In the packaging process several quality checks take place. Some of the checks are done automatically with the use of sensors, but some of the checks are done by the machine operators on the packaging line. At every automatic check, products outside the allowable range are emitted from the process. Out of range manual checks require an adjustment, but can also lead to a blockage of final products.
Wet area
Before entering the filler, every bottle is automatically checked on shape and content by a sensor. After the filling, bottles are checked again, this time on the fill level and pressure on the crown cork. The operators of the filler manually perform scheduled checks on the products. During these checks, they also check the fill level of the bottles. Next to that, they also measure the oxygen level of the beer. At the pasteuriser, no automatic quality checks are performed. Manual checks are performed by the operators on the quality of the water, mainly on the levels of chemicals. These chemicals are used to clean the bottles, keep the water clean, and make sure the crown corks are not corroding. After the labelling machines, a more precise automatic check is performed on the fill level of the bottle. Here the allowable range is smaller than at the filler. Also, the labels are checked for position on the bottle. The operators perform scheduled checks on the labels as well, especially looking whether there is air present under the labels.
Dry area
2.2.2. Efficiency measurement
At Heineken, efficiency is measured using the OPI (see Chapter 1 and Appendix A) on the production line. The OPI is determined by:
OPI = Availability * Performance * Quality
The quality is the fraction of time theoretically needed to make the ‘good product’ output, divided by the time needed for the total output created (including rework and rejected products). Heineken defines this as:
= + &
Performance is calculated by dividing the production time by the operating time. The production time is the time (theoretically) needed for the total number of products (good product + reject and rework). The operating time is the production time + the time for speed loss and minor stoppages (< 5 minutes), so the time the line has actually been in operation. Because these speed losses are especially hard to define, we also give the calculation starting with the total time:
= !"# "$%&"#' "$
()* = &+ "$ – #- "$ – ##&$ $&"##&# – . % . /"0"1 – ℎ&#' 0 "$ – +&## #"$ – 3&# "$
Here breakdown time only includes stops longer than 5 minutes.
The last part of the OPI, the availability is calculated as follows, where manned time is the total time – unused time (e.g. weekends).
456 =%&"#' "$7&## "$
To make these calculations clear, we provide an example with virtual numbers. Here we calculate the OPI as goals for the packaging lines are based on this measure.
Total time: 480 minutes
Meetings: 30 minutes Manned time: 450 minutes (480-30)
Change over time: 30 minutes
Planned downtime: 60 minutes
Breakdown time: 80 minutes Operating time: 280 minutes (450-30-60-80)
Speed loss and minor stoppages: 30 minutes Production time: 250 minutes (280-30)
From the numbers given we can calculate the OPI if we
The capacity of the packaging line is determined by the fillers, which can fill 120,000 bottles per hour. As a box contains 24 bottles, this means 5,000 boxes per hour. For a production of 20,000 boxes, theoretically 240 minutes are needed. This gives the following OPI:
%!8 = &0&"+&3"+"1 ∗ :$&# ∗ ;&+"1 =<=>?@>∗<@><=>∗<?><@>∗ 100% = 53%
Because the OPI requires a lot of calculations, we will only look at the output of the packaging line. The output has the highest impact on the OPI, which is used to determine performance at Heineken. From now on, if performance is mentioned, we mean output of the packaging line. An increase in output will automatically result in an improved OPI, as long as the manned time remains the same.
2.2.3. Speed evaluation
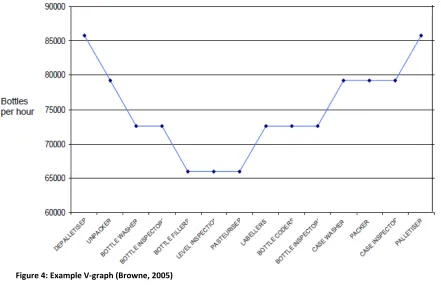
[image:20.595.73.514.449.734.2]At Heineken, a V-graph is used to determine how the speeds of different machines on the line should be balanced. The V-graph sets the capacity of the bottleneck machine as 100%, and the machines before and after the bottleneck are set on increasing percentages as further away they are from the bottleneck machine Invalid source specified.. A general example from the brewing industry is displayed in Figure 4. If the machines are set at the right speeds and the buffers are used in the right way, this reduces the blocking and starvation times of the bottleneck machine. Minor stops up- or downstream are covered by the buffers, so only longer stops influence other machines along the line, especially longer stops of the bottleneck machine Invalid source specified..
At the packaging lines the filling machine is the bottleneck machine, as explained in Section 1.3. This is already taken into account during design and acquisition of the line. During this phase, the group supply chain (GSC) of Heineken determines what the V-graph should look like. They use increasing percentages, which are not constant. The percentages are determined based on experiments conducted quite a while ago. Therefore, it is important to look critically at these percentages, as they are not determined especially for this line and almost independent of the available buffer capacities. Also, the V-graph is only determined for the main machines on which the bottles are processed, but the carton infeed is not taken into account.
Machine speeds are limited by several factors, of which one is the technical capacity. In general, it is not possible to set the machines on the maximum technical speed and still secure the quality. Also, working at this speed results in a lot of stops for the machine, which can increase the chance of breakdowns. Therefore, for every machine, the best processing speed should be determined. Currently, the set points of the machines at packaging line 51 are based on experience and historical results. Determining set points, operating on these speeds, and only changing this in rare cases when no other options are available, increases the efficiency of the packaging line by reducing speed loss and blocking and starvation times.
2.2.4. Speed adjustment
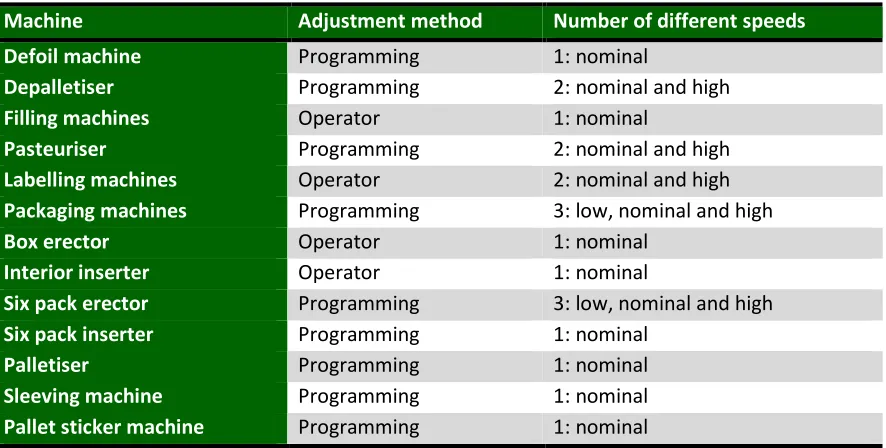
As already mentioned in Section 2.1.2, the speed of the machines is partly determined by the sensors along the conveyer belts, but also by the speed settings of the machine. Some of the machines have several speeds. Next to a nominal speed on which the machine normally works, they also have a low and/or high speed in case of high or low buffer fill levels.
Machine Adjustment method Number of different speeds
Defoil machine Programming 1: nominal
Depalletiser Programming 2: nominal and high
Filling machines Operator 1: nominal
Pasteuriser Programming 2: nominal and high
Labelling machines Operator 2: nominal and high
Packaging machines Programming 3: low, nominal and high
Box erector Operator 1: nominal
Interior inserter Operator 1: nominal
Six pack erector Programming 3: low, nominal and high
Six pack inserter Programming 1: nominal
Palletiser Programming 1: nominal
Sleeving machine Programming 1: nominal
[image:21.595.69.512.441.665.2]Pallet sticker machine Programming 1: nominal
Table 2: Speed adjustments of main machines
only possible by adjusting the software program. The second column of Table 2 shows which method is used for which machine.
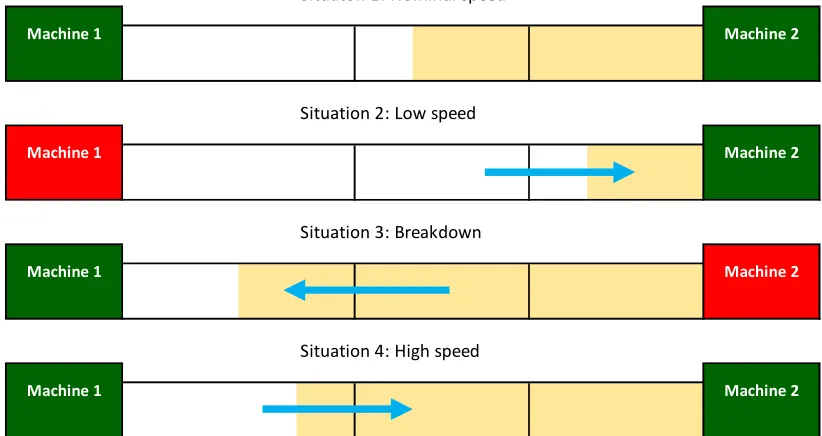
[image:22.595.97.508.297.515.2]The third column of Table 2 shows how many speeds the machine uses. Some of the machines use several different speeds while being in production. If we look for example to the packaging machines, we see that there are three speeds, which can be adjusted by programming. This means, that in the software program, three different set points exist, one for low speed, one for nominal speed, and one for high speed. When the machine is in production, it will always use one of these speeds. The current speed is determined by sensors along the conveyer belt in front of the machine. These sensors detect until which point the buffer is currently filled with bottles, and based on this fill rate, the speed is adjusted. Figure 5 displays this process, by showing two machines and the conveyer belt (buffer) in between. The speed of machine 2 is determined by sensors along this conveyer belt, represented by the vertical black lines.
Figure 5: Example of how sensors along the conveyer belts determine machine speed
In situation 1, we see the machines both in ‘normal’ state. They are both working at nominal speed and the buffer is in steady state. As soon as machine 1 breaks down, we go to situation 2. There is no supply of bottles, so the buffer gets empty. The sensor closest to machine 2 is no longer detecting bottles, and changes the speed of machine 2 to low speed. If machine 1 is not restarted before the buffer becomes empty, we call this starvation of machine 2. As soon as machine 1 starts working again and there is supply of bottles, the process goes (slowly) back to ‘steady-state’ as in situation 1. As soon as the sensor detects bottles again, the machine goes back to nominal speed.
Another option is a breakdown of machine 2, which is displayed in situation 3. As soon as this happens, the bottle supply continues, while there is no processing of bottles. In this situation the buffer gets fuller. If machine 2 does not start working again before the buffer is completely full, we speak of blocking of machine 1. As soon as machine 2 is restarted, we get to situation 4. If the sensor closest to machine 1 detects bottles, it changes the speed of machine 2 to high speed. This way, the
Situaton 1: Nominal speed
Situation 2: Low speed
Situation 3: Breakdown
Situation 4: High speed
Machine 1 Machine 2
Machine 1 Machine 2
Machine 2 Machine 1
buffer is emptied partly. As soon as the buffer is no longer filled until the sensor, the machine changes to normal speed and we are back in situation 1.
This way, the different speeds as displayed in Table 2 are assigned to the machines based on the fill rate of the buffer. The programmed fill rate for speed change determines the moment when the machine slows down or speeds up. The placement of the sensors along the conveyer belt determines for which fill rates this is possible.
2.3. Organization
As mentioned in Section 1.1.2, there is one rayon manager and there are three teams of operators on packaging line 51. In this section we discuss those stakeholders, but also other groups and people working on the line, that can influence, or are influenced by, the performance of the line. We start with the people directly involved in the daily operations, which are the rayon manager, the operators, but also the installation administrator. Next to that, we describe the interests of the company management, (in which we include all hierarchical levels above the rayon manager), the technology/quality department, the maintenance department, and the logistics department (CS&L).
The rayon manager is responsible for the performance of packaging line 51. She determines the strategy for the packaging line based on the line set by the management of Zoeterwoude and the global management of Heineken. Also, she manages the operators and the installation administrator. The installation administrator is responsible for all the machines and installations of the packaging lines. He is the first contact point for the operators when something is wrong with an installation and communicates this to the maintenance department. He collects and processes labels for repairs, modifications, and safety written by the operators.
On packaging line 51, there are three teams of operators, working in shifts of 8 hours, during 5 days, 24 hours a day. During the weekend, the line is normally not in use. The main task of the operators is to make sure the machines are running and high-quality products are produced. This means they have to make sure materials are available, clean the machines, check the quality, detect problems, and, when necessary and possible, troubleshoot failures. When they cannot fix a problem, they contact the installation administrator or someone from the maintenance department. The operators are important in the process of changes, as they are the ones taking care of the production, and they can influence the performance and output of the process. Therefore, support of the operators is needed when implementing changes.
The maintenance department consists of several sub-departments. On the line, mainly the all-round maintenance engineers and the electricians are needed to solve problems. These are the employees assisting the operators when problems occur on the line during production. When programs of the machines or conveyers need to be adjusted this is done by the programmers. Changes on the line often need to be done by the maintenance department, so they are important for the implementation.
safety issues, and reflect on the influences of changes to product quality when needed. Every week the quality is evaluated with the rayon manager, and actions are taken if necessary. When changes are made, it is important that the quality/technology department is informed to ensure the quality.
CS&L is also a stakeholder that needs to be taken into account. They are responsible for the supply of materials (empty bottles, carton, etc.) and the transport of completed products. When big changes occur, they need to be informed and their opinion should be taken into account. If materials are not supplied, or final products are not transported, this results in stops in the process.
At last, also the management is important. The management consist of several layers in the hierarchy, starting by the packaging manager. He should be involved to get his support for changes. Also, he is the final responsible to the local brewery manager concerning everything happening in the packaging department.
2.4. Current performance
This section describes the current performance of the process. We start with a description of the overall process performance. Several aspects will be discussed, based on how Heineken evaluates performance and speed as discussed in Section 2.2. As mentioned in Chapter 1, quality is not taken into account as a lot of focus is already on quality performance, and next to that, there is a separate quality department within Heineken to evaluate and improve this aspect of the OPI.
2.4.1. Availability
[image:24.595.93.502.503.739.2]In this section we evaluate the current performance and take a closer look at the losses in the availability and performance aspect of the OPI. Looking at Figure 6, we see an overview of the categories of unplanned downtime as percentage of effective working time (time the machine is theoretically available for processing, so not in stop for cleaning, unmanned time, etc.). The unplanned downtime has a direct influence on the performance, and should therefore be minimized.
The category “other” includes the time where the machine status is unknown, due to no or incomplete status registration. The remainder of the effective working time, the machine is in production. Internal stops include both breakdowns (> 5 minutes) and minor stops (< 5 minutes). Starvation is mostly due to bottles, but for the box packers there is a separate registration for starvation due to lack of boxes. Therefore, “starvation other” is added for this machine.
[image:25.595.98.507.355.588.2]Figure 7 focuses on the filling machines and shows the development over the weeks. We see a decline in the total unplanned downtime, which means that there is already an increase in performance. This is due to the fact that after the weeks of revision (weeks 2 till 4), always some start-up problems occur, but after a while, the process stabilizes. As the fillers are the bottleneck in the process, most of the analysis is done on these machines. We see that these breakdowns and minor stops form only a really small part of the downtime on the filling machines (on average x% of the effective working time). Especially blocking forms a main part of the downtime on the filling machines. Together, blocking and starvation account for a big part of the effective working time. The same accounts for Figure 6, for almost all machines blocking and starvation form the main part of the unplanned down time. This is generally unnecessary loss of efficiency, and therefore important to improve.
Figure 7: Unplanned downtime filling machines as percentage of effective working time
2.4.2. V-graph
the current line capacity, while the dotted grey line shows the line determined by the GSC. The graph shows a gap between the current performance and the ideal performance according to Heineken.
The flat V-graph in week 11 results in blocking and starvation, as described in the previous section. Even minor stops influence the machines up- and downstream, as there is almost no extra capacity to empty or fill buffers after a stop. In Chapter 3 we search in the literature for the related research to be able to determine the best speeds for the machines.
The biggest gap between the line of the GSC and the current performance can be seen at the palletiser. In 2013, Heineken introduced a new bottle, named the K2. This bottle is made of thinner glass, and also more light-weight carton is used for the packaging. As a result, transport costs decreased significantly, but the chance on broken bottles increased. The palletiser uses moving beams to move the boxes to the right place, and the impact of these beams on a box is high. Therefore, the machine is currently working at lower speed than should be possible according to the technical specifications. The technical specifications would be 120% of the filling machines capacity, so for this machine, the line of the GSC (135%) is not reachable without placing another or extra machine. Therefore, a technical team is currently looking at the possibilities to increase the capacity.
[image:26.595.62.470.472.710.2]The second pair of machines showing quite a gap between current and desired state, are the box packers. First of all, this is due to the fact that the machine can simply not work at the speed stated in the technical specifications. These specifications are quite general, and with the current boxes and bottles this speed cannot be reached. The distance between the machine and the box is too big, due to the relatively high K2 bottle. Therefore, the maximum reachable percentage compared to the bottleneck rate would be 122%. Also this percentage is currently not reached due to wear and tear of the machine.
Figure 8: V-graph of line 51, GSC line and the current line in week 11
In Section 2.2.4 we described the speed adjustments that can be made by the operators. Evaluating the data over the last seven weeks (the weeks after the last revision period) of the speeds that can be adjusted manually, we see that the speeds on the box erector and interior inserter are almost never changed. The speed of the interior inserters is changed twice on each machine, because of a test with another type of insert, and the speed of the box erector has not been changed at all.
The speeds of the fillers and labellers are changed quite regularly. Therefore, a trigger has been designed where the operators fill out the reason for increasing or decreasing the speed from the agreed set point. This trigger is used to see reasons why the speed is changed. On the fillers, we can see that the speed is (almost) always changed after a (long) period of no production. This is related to the temperature of the beer in the pipes from the brewery to the packaging department. The temperature influences the process, and therefore the operators need more control which is created by lowering the speed. For the labellers, it turns out that the placement of the sensors along the conveyers before the machines is not optimal, and therefore the speed is often increased manually to empty the buffers. This manual change has a positive effect on the continuity at the filling machines. This is an important observation in designing the new set points and buffer workings.
2.5. Conclusion
In this chapter we evaluated the current process and performance, from which we can conclude that most improvement can be obtained by reducing the amount of blocking and starvation of the filling machine. Blocking and starvation currently make up a big part of the total effective working time, while internal stops (breakdowns and minor stops) only account for a small percentage. As the filling machine is the bottleneck in the process, and therefore the lowest point on the V-graph, the blocking and starvation times should be minimal when the speed and buffer settings are according to the V-graph philosophy. This philosophy leads to a continuous flow on the packaging line, where disruptions only occur when machines up- or downstream from the fillers have breakdowns. For minor stops, the buffers should be able to prevent other machines from stoppages.
The focus of this research is on reducing blocking and starvation, by looking at the speed settings of machines and the use of buffers in the process. The research uses the current failure level as a given fact, and reducing the frequency and time of stops is outside the scope of this research. By reducing the time of blocking and starvation of machines, the continuity of the flow on the line will increase. In the research, we look at packaging line 51 of Heineken in Zoeterwoude. We focus on the part from the depalletiser to the palletiser, so we exclude the defoil machine, the sleeving machine and the pallet labeller.
To be able to give an advice for a more continuous flow on the line, Chapter 3 discusses the factors for continuous flow according to the literature. In Chapter 4, a more extensive analysis of the gaps between the current state and the desired state (which is based on the literature) is conducted to come up with alternatives and solutions to minimize the blocking and starvation time of the filling machines.
This chapter provides theory which can be used for analysing and improving the current performance at Heineken. First we classify the packaging process according to the literature in Section 3.1. This is necessary to determine which methods from the literature are applicable to the packaging line. After this classification, we study variability in Section 3.2, as this is the main source for the difference between effective throughput and theoretical throughput. Section 3.3 deals with how we can model variability and the effects of variability. Section 3.4 and 3.5 respectively discuss analytical models and simulation models. Section 3.6 describes a method to determine buffer sizes. The process has finite buffers, and therefore buffer sizes need to be known. The last section (Section 3.7) concludes, based on the literature, on which method we use in the remainder of the research.
3.1. Classification of the packaging process
This section describes the process from a theoretical view. We review the process based on existing classifications of manufacturing processes, to be able to use the literature which is applicable to the process at packaging line 51. Manufacturing processes can be divided into several categories. This section discusses some of the categories used for classification.
First of all, we can distinguish between discrete or continuous processes. In discrete manufacturing separate units are produced, where continuous manufacturing entails production in bulk quantities Invalid source specified.. But, as stated by Cooke, Bosma, and Härte Invalid source
specified., the error introduced by modelling the production as a continuous variable is small, due to
the high production rate of hundreds of bottles per minute. Therefore, models for continuous production can also be taken into account.
The second classification can be made looking at the machines in the process. The machines can either be reliable or unreliable, as well as form a synchronous or asynchronous line. Reliable machines are always up and ready for processing, whereas unreliable machines have downtime. In a synchronous process all workstation have the same production rate/capacity, whereas this is not the case for an asynchronous process Invalid source specified..
Another way to classify a system is whether it is open or closed. In closed systems, there is a constant number of ‘jobs’ present, while in an open system this number is an independent random variable Invalid source specified..
The packaging process at Heineken is a discrete manufacturing process, as the bottles are filled per piece. Also, it is an unreliable and asynchronous process. We can classify the packaging process as an open system, and mass production with asynchronous part transfer, which is very common for production lines.
the buffers at the beginning and the end of the process almost never cause blocking or starvation on any of the machines.
3.2. Variability
There is no manufacturing process without variability, which makes it important to know how to cope with variability and to determine the influence of the variability on the process. Variability can be either good (e.g. product variety) or bad for the company, but as stated in the variability law: ‘increasing variability always degrades the performance of a production system’ Invalid source
specified.. Therefore, variability reduction is necessary to increase performance.
To measure the variability of a random variable we use the coefficient of variation (CV, represented by c), which is the standard deviation (σ) divided by the mean (t). We can identify three classes, low variability ( < 0.75), moderate variability I0.75 ≤ < 1.33K, and high variability I > 1.33K. Sometimes, it is more convenient to use the squared coefficient of variation (SCV, represented by c2). The formulas are:
=NO <=NP
OP
Even if variability is not decreased, we can influence how it affects performance by using buffers. There are three options to buffer variability, which can be used in combination. These are: inventory (stock), capacity (overcapacity), and time (waiting time). Which buffering strategy is best, depends on the business environment Invalid source specified..
Variability is a result of several causes. In a manufacturing environment, the most common sources of variability are: natural variability, random variability, outages, setups, operator (un)availability, and rework Invalid source specified.. Random failures can be classified as pre-emptive outages (occur whether we want them or not), while setups and rework can be classified as non-pre-emptive outages (we can control when they happen).
Another type of variability in production processes is flow variability. This is the effect of variability at one station on another station in a line. The departures at one workstation are the arrivals at the next workstation, and therefore variability is transferred downstream the production line.
All the above mentioned sources of variability can cause time losses in the production, as they result in queues somewhere along the production line. As the effects of variability are related to arrivals and departures at the workstations, they are also related to machines speeds.
3.2.1. Bottleneck machine
scope of this research. Therefore, we look at increasing the bottleneck utilization to increase the throughput. This means reduction of blocking and starving of the bottleneck, for which Hopp and Spearman Invalid source specified. give two ways to do this. The first is increasing the buffer size in the system, which is most effective immediately in front of the bottleneck or after the bottleneck. The second method is buffering the bottleneck with capacity by increasing the effective rates of non-bottleneck stations, in which extra capacity at the highest-utilization non-non-bottleneck stations will generally have the largest impact Invalid source specified..
3.2.2. Controlling variability
At packaging line 51, the ultimate goal is to increase throughput without reducing quality or increasing costs. To increase throughput, either the bottleneck utilization or bottleneck workstation processing rate (from now on bottleneck rate) should be increased, as throughput = bottleneck utilization * bottleneck rate (all for the workstation) Invalid source specified.. Both the bottleneck utilization and the bottleneck rate are lower than theoretically possible due to variability. Therefore, it is important to deal in the right way with variability.
3.2.3. Variability Pooling
One way of dealing with the consequences of variability is by variability pooling, in which multiple sources of variability are combined. There are several methods for this, of which one applicable at the packaging lines at Heineken is queue sharing. If one of the workstation experiences a long processing time, due to either process variability or a breakdown, jobs can go to another machine which reduces waiting time and decreases the effect of variability Invalid source specified.. This method can be used when parallel machines are available.
3.3. Modelling variability and the effects
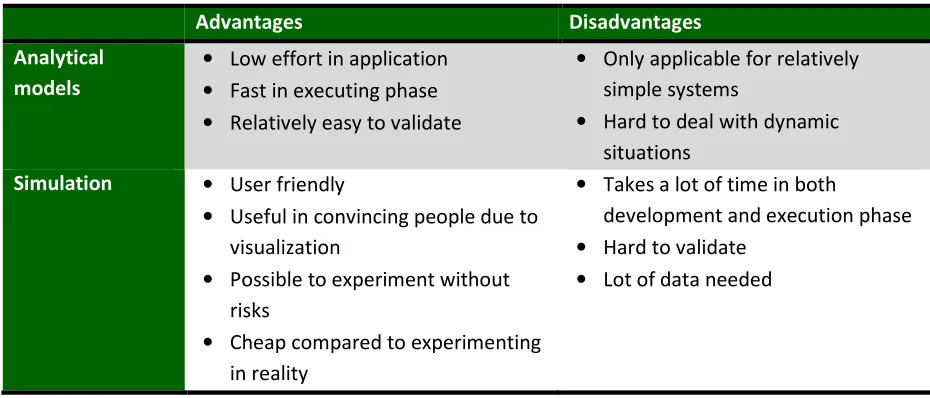
To analyse variability and the effects of variability, we can use a modelling approach. We consider two types of models: analytical models and simulation models. Both have their own advantages and disadvantages, and based on the requirements of the model we can determine which method is the best. Therefore, we discuss the basic modelling approach in this section, together with the considerations when developing a model.
The basic modelling approach consists of 8 steps Invalid source specified.:
1. Identify the issues to be addressed: ascertain the needs of the user: what is the problem? How
will the model be used? When is it needed?
2. Learn about the system: identify the performance measures of interest to the user, characterize
the relevant aspects of the components and key parameters of the system.
3. Choose a modelling approach: use simulation or analytical models, do models already exist?
4. Develop and test the model: obtain data on the parameters of the model, make ‘reasonable’
assumptions.
5. Verify and validate the model: check the model for internal consistency (verification), and assess
the accuracy of the results (validation).
6. Develop a model interface for the user: ensure that the user can actually use the model and
7. Experiment with the model: develop an understanding of factors influencing the performance of the system.
8. Present the results: give recommendations based on the model results, explain the possibilities
and limitations of the model, promote the model.
When applying these steps consecutively, a good choice for the type of modelling is made and the model is developed, evaluated, and used in the right way. When developing a model, several considerations should be made Invalid source specified.. These considerations are also important in step 3 of the basic modelling approach, when choosing which type of model is used. We mention the factors for considerations and how they behave in analytical and simulation models.
• Complexity versus simplicity: A complex model often represents reality better, while it also
takes a lot of time and is harder to verify and validate. Analytical models are limited in complexity they can handle, while simulation models can often be made as complex as necessary;
• Flexibility: Both analytical and simulation models can be flexible, parameter values can be changed easily;
• Data requirements: In general simulation models need more data than analytical models.
Most important is the data format available in reality and whether this corresponds with the data requirements the model;
• Transparency: For user acceptance, the model must be understood. For analytical models
mathematical skills are needed to understand the model, while simulation models often can be easily explained.
• Efficiency: both in development and use models can consume a lot of time. The time needed
for development depends on model complexity and skills of the modeller. In use, analytical models are often quite efficient, while simulation models can require substantial time.
• User interface: For the use of the model, a good user interface is essential. Simulation
models have more options for the user interface, due to the visual representation used. Analytical models are often restricted to input and output screens as interface.
To be able to make a choice between analytical and simulation models, we need to explorer both options further. Therefore, in the following sections (3.4 and 3.5) we go into more detail on both model types.
3.4. Analytical models
which are used when analysing a system analytically. We start with process time variability, and then continue with flow variability (3.4.2) and the queuing effect of variability (3.4.3).
3.4.1. Effective process time variability
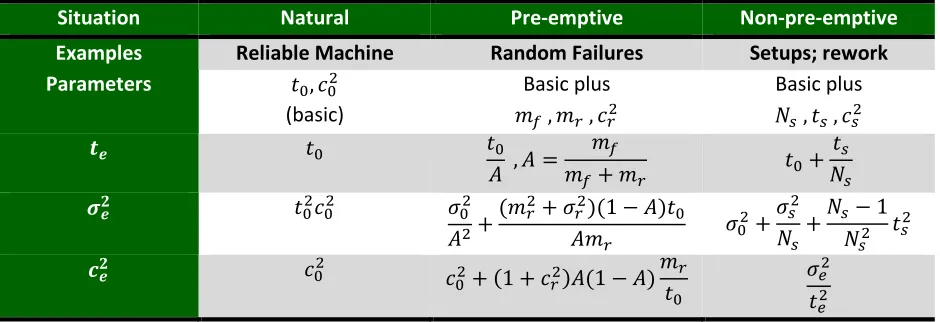
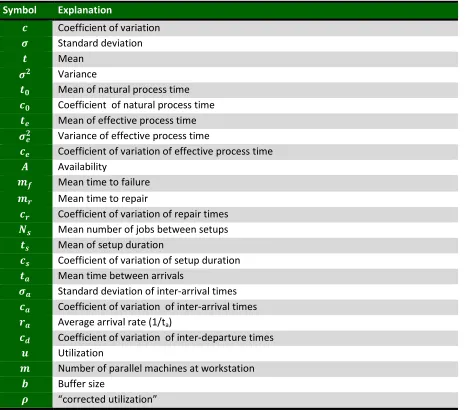
Applying the formulas for each of these variability sources gives us the parameters for the effective process times. These formulas are summarized in Table 3. An explanation of the used variables can be found in Table 4. If both pre-emptive and non-pre-emptive outages are involved, we apply the formulas consecutively.
Situation Natural Pre-emptive Non-pre-emptive
Examples Reliable Machine Random Failures Setups; rework
Parameters >, >< (basic)
Basic plus $Q , $R , R<
Basic plus .S , S , S<
> >
/ , / =$Q$+ $RQ >+.SS TU ><>< V><
/<+I$R
<+ VR<KI1 − /K>
/$R V>
<+VS<
.S+.S.− 1S< S <
U
>< ><+ I1 + R<K/I1 − /K$R
> VX
[image:32.595.66.536.211.372.2]< X<
Table 3: Summary of formulas for computing effective process time parameters (Hopp and Spearman, 2008)
3.4.2. Flow variability
To calculate the flow variability, we need the arrival rate at a station, denoted by ra. This is the inverse of the mean time between arrivals, ta. If we assume a production line without yield loss or rework, the arrival rate to station i, equals the departure rate of station i-1. Therefore, we need to calculate the inter-departure times CV (coefficient of variation) of each station. This can also be seen in Figure 9. We can do this with the following estimation formula Invalid source specified.:
Y<= 1 + I1 − <KIZ<− 1K + <
√$IX<− 1K Where
=R\O]
^ utilization Z=N\
O\ coefficient of variation of the interarrival times
X< =N]P
O]P coefficient of variation of the effective process times
[image:32.595.87.380.512.726.2]m number of parallel machines at the workstation
3.4.3. Effects of variability - Queuing
In this section, we briefly give some equations which can be used to determine time losses in the production. We use Kendall’s notation to classify the queuing stations. This notation uses four parameters to characterize a queuing station: A/B/m/b, where A describes the distribution of arrival times, B describes the distribution of process times, m is the number of machines at the station, and b is the maximum number of jobs that can be in the system. For A and B, the following three values are mostly used Invalid source specified.:
• D: constant (Deterministic) distribution
• M: exponential (Markovian) distribution
[image:33.595.68.534.257.667.2]• G: completely general distribution (e.g., normal, uniform)
Table 4: Explanation of the used variables
Symbol Explanation
Coefficient of variation
T Standard deviation
Mean
TU Variance
_ Mean of natural process time _ Coefficient of natural process time
Mean of effective process time
TU Variance of effective process time
Coefficient of variation of effective process time 4 Availability
Mean time to failure
Mean time to repair
Coefficient of variation of repair times `a Mean number of jobs between setups
a Mean of setup duration
a Coefficient of variation of setup duration
Mean time between arrivals
T Standard deviation of inter-arrival times Coefficient of variation of inter-arrival times Average arrival rate (1/ta)
b Coefficient of variation of inter-departure times
Utilization
Number of parallel machines at workstation
6 Buffer size
3.4.3.1. Fundamental queuing relationships
Hopp and Spearman Invalid source specified. give several fundamental relationships in queuing theory. First of all, the utilization, already given in Section 3.4.2. They also give relations for the mean time spent at the station and in the queue. This is done using Little’s law Invalid source specified., which is applicable to the total workstation and the queue of a workstation. Also, they give the relation between the time in the queue and the total time at the station. The WIP is the work-in-process, TH represents the throughput, CT the cycle time, and CTq the cycle time in the queue:
d8! = ef ∗ ge ge = geh+ X
Another useful and well-known equation is Kingman’s equation, which is also known at the VUT equation. This formula is an expression of the waiting time for queuing models with general process and inter-arrival times by a variability term (V), a utilization term (U), and a time term (T). This approximation is based on the formula for the M/M/1 queue. The approximation for CTq for single machines is given by Invalid source specified.:
gehI ⁄ 1⁄ K = jZ
<+
X<
2 l m1 − n X
3.4.3.2. Blocking models
The above mentioned models do not take into account the effect of blocking. Therefore, this section describes the models used by Hopp and Spearman Invalid source specified. for systems with limited buffers, in which blocking can occur. We only look at the general blocking models, as the distribution of the processing and inter-arrival times are not yet determined. All equations given, lead to approximations of the throughput. Hopp and Spearman only discuss situations with one machine, so to apply the models to the packaging process at Heineken this has to be taken into account.
Hopp and Spearman Invalid source specified. give approximations for the WIP and cycle times using the WIP without blocking (WIPnb), and buffer size (b). To get these approximations, we need to determine the throughput of the production line. For blocking models, we identify three different situations: arrival rate less than production rate, arrival rate greater than production rate, and arrival rate equal to production rate. For two of these three situations we need estimates for the buffer size, which we discuss in Section 3.6. In the remainder of this section we determine the throughput for these situations. For all situations, we can determine WIP and cycle times using Little’s Law. For the WIP we obtain an upper bound and for the cycle time a lower bound by using the following formulas:
d8! < min rd8!st , 3u
Situation 1: Arrival rate less than production rate
If the arrival rate is less than the production rate, u is smaller than 1. Therefore, we can use Kingman’s equation and Little’s law to determine the WIP without any blocking, and from there we can determine the throughput for a system with blocking, using the formulas for M/M/1 systems.
ef ≈1 − 1 − w<wtxytxyZ in which
w =d8!std8!− st
d8!st≈ jZ<+ X2 l j< 1 − l + <
Situation 2: Arrival rate greater than production rate
In this situation, we approximate the throughput and the work-in-progress by analysing the line in reverse order. By doing this, the arrival process becomes the production process and vice versa, resulting in a utilization less than 1, as the utilization is now determined by 1/u. Our system can now be evaluated as in situation 1, using the following formulas:
ef ≈1 − 1 − w<wtxytxyZ in which
w = 1 wz{
wz =d8!std8!− 1 { st
d8!st≈ jZ<+ X2 l |< I − 1K} +1 1
Situation 3: Arrival rate equal to production rate
In the situation where u=1, we can approximate the throughput using the following formula according to Invalid source specified.. The theory behind the formula is very extensive, and therefore we only give the approximation for the throughput: