Identifying Semantically Deviating Outlier Documents
∗Honglei Zhuang1, Chi Wang2, Fangbo Tao1, Lance Kaplan3 and Jiawei Han1 1Department of Computer Science, University of Illinois at Urbana-Champaign
2Microsoft Research, Redmond 3US Army Research Lab
{hzhuang3, ftao2, hanj}@illinois.edu,
[email protected], [email protected]
Abstract
A document outlier is a document that sub-stantially deviates in semantics from the majority ones in a corpus. Automatic iden-tification of document outliers can be valu-able in many applications, such as screen-ing health records for medical mistakes. In this paper, we study the problem of mining semantically deviating document outliers in a given corpus. We develop a generative model to identify frequent and character-istic semantic regions in the word embed-ding space to represent the given corpus, and a robust outlierness measure which is resistant to noisy content in documents. Experiments conducted on two real-world textual data sets show that our method can achieve an up to 135% improvement over baselines in terms of recall at top-1% of the outlier ranking.
1 Introduction
The technology today has made it unprecedent-edly easy to collect and store documents in an increasing number of domains. Automatic text analysis (e.g. document clustering, summariza-tion, topic modeling) becomes more useful and de-manded as the corpus size grows. Some trending
∗Research was sponsored in part by the U.S. Army
Re-search Lab. under Cooperative Agreement No. W911NF-09-2-0053 (NSCTA), National Science Foundation IIS-1320617, IIS 16-18481, and NSF IIS 17-04532, and grant 1U54GM114838 awarded by NIGMS through funds pro-vided by the trans-NIH Big Data to Knowledge (BD2K) initiative (www.bd2k.nih.gov). The views and conclusions contained in this document are those of the author(s) and should not be interpreted as representing the official policies of the U.S. Army Research Laboratory or the U.S. Govern-ment. The U.S. Government is authorized to reproduce and distribute reprints for Government purposes notwithstanding any copyright notation hereon.
domains (e.g.health records) call for a new analyt-ical task,mining outlier documents: given a cor-pus, identify a small number of documents which substantially deviate from the semantic focuses of the given corpus. Outlier documents can provide valuable insights or imply potential errors. For example, an outlier health record from records of the same disease could indicate a new variation of the disease if it has an abnormal symptom descrip-tion, or a medical error if it has an abnormal treat-ment description. A previous study (Hauskrecht et al.,2013) uses structured data in health records to show the importance of this application, and points out that further improvement should be achieved by leveraging text data.
Existing work has studied a related albeit different task, novel document detection (Ka-siviswanathan et al., 2012, 2013; Zhang et al., 2002, 2004), where one aims to identify from a document stream if a newly arriving document is novel or redundant. In other words, this task assumes all the previous documents are known to be “normal”, and only checks if a new docu-ment is novel. In our task, no docudocu-ment is known to be normal, and there could be multiple out-liers in the corpus. Outlier detection (Chandola et al., 2009;Hodge and Austin, 2004) is a popu-lar topic in data mining but few focus on text data. A study (Guthrie,2008) identifies anomalous text segments in a document, but mainly based on writ-ing styles. We focus on studywrit-ing semantically de-viating documents.
The problem of detecting outlier documents has its unique challenges. First, different words or phrases may be used to indicate the same semantic meaning, which introduces lexical sparsity. Sec-ond, finding proper words or phrases to charac-terize the corpus is non-trivial. Semantically fre-quent words or phrases can still be too general or too vague. Third, a document can carry extremely
rich and noisy signals, most of which are not help-ful to determine whether it is an outlier.
We tackle the problem of mining outlier doc-uments in the following steps. We leverage word embedding (Mikolov et al.,2013) to capture the semantic proximities between words and/or phrases, in order to solve the sparsity issue. Then we propose a generative model to identify seman-tic regions in the embedded space frequently men-tioned by documents in the corpus. The model represents each semantic region with a von Mises-Fisher distribution. We also learn a concentration parameter for each region with our model, and de-velop a selection method to identify semantically specific regions which can better represent the cor-pus, and filter regions with largely uninformative words.
As the final step, we design a robust outlierness measure emphasizing only the words or phrases in a document relatively close to the semantic fo-cuses identified, and eliminating the noises and re-dundant information.
The remaining of the paper is organized as fol-lows. Section 2 introduces the preprocessing of data sets and clarifies the notations. Section 3 proposes the methodology to mine outlier docu-ments. Section4describes the experiment setup, Section 5presents the results and Section 6 con-cludes the paper.
2 Preliminaries
In this section, we formalize the problem and then briefly describe the preprocessing step.
2.1 Notations
The notations used in this study are introduced here. A document is represented as a sequence
di = (wi1, wi2,· · ·, wini), where eachwij ∈ V
represents a word or phrase from a given vocabu-laryVandnidenotes the length of thedi. We refer to a set of documents as acorpus, represented as
D={di}|iD=1|.
Notice thatwijmay refer to a unigram word or a multi-gram phrase. Although it is nontrivial to ap-propriately segment a document into a mixed se-quence of words and phrases, it is not the focus of our paper. A recently developed phrase min-ing technique (Liu et al., 2015) is used to extract quality phrases and segment the documents.
Word embedding provides vectorized represen-tations of words and phrases to capture their
se-mantic proximity. We assume there is an effective word embedding technique (e.g.(Mikolov et al., 2013)), f : V 7→ Rν, where f is the transform-ing function that takes a word or a phrase as input and projects it into a ν-dimensional vector as its distributed representation. The semantic proxim-ity between two words or phraseswandw0can be
preserved by the cosine similarity between their embedded vectors:
CosSim f(w), f(w0)= f(w)·f(w0)
kf(w)k × kf(w0)k
Problem definition. This work studies how to effectively rank documents in a corpus based on how much they deviate from the semantic fo-cuses of the corpus. Given a set of documentsD, our objective is to design an outlierness measure
Ω :D7→ R, such that documents with larger out-liernessΩ(d) semantically deviate more from the majority ofD.
2.2 Preprocessing
We perform several steps of preprocessing to de-rive the input representation of each document in a given corpus.
Phrase mining. SegPhrase, a recently developed phrase-mining method (Liu et al., 2015), is uti-lized to automatically identify quality phrases in a corpus. After being trained in one corpus, Seg-Phrase is also capable of segmenting unseen docu-ments into chunks of phrases with mixed lengths. We train SegPhrase on an external corpusDe to obtain the list of quality phrases. Then for each corpusD given for outlier detection, we employ the trained SegPhrase to chunk each document into a sequence of words and quality phrases. Word embedding. We adopt word embedding as a preprocessing step to capture the semantic proximity between words/phrases. Instead of us-ing the raw text, similar to (Liu et al.,2015), we use the sequence derived from SegPhrase as in-put to the word embedding algorithm. In
particu-lar,word2vec(Mikolov et al.,2013) is utilized in
our experiments, but can be seamlessly replaced by any other embedding results.
Stop words removal. We remove stop words, as well as the words or phrases ranked high within a certain quantile in terms of document frequency1
(DF) in the external corpus De. Such words or phrases usually carry background noise, and ob-struct outlier detection.
3 Mining Outlier Documents
Our framework consists of the following steps. First, we leverage a generative model to identify semantic “regions” in the word embedding space frequently mentioned by documents in the given corpus. Second, we develop a selection method to further remove semantics regions that are too gen-eral to properly characterize the given corpus, and only keep regions both frequent and semantically specific, denoted as “semantic focuses”. Finally, we calculate the outlierness measure for each doc-ument based on the mined semantic focuses. We design a robust outlierness measure which is less sensitive to noisy words or phrases in documents.
3.1 Embedded von Mises-Fisher Allocation We start with a generative model to identify the frequent semantic regions in the word embedding space.
Since we use cosine similarity to capture the se-mantic proximities between two words or phrases, the magnitude of the embedding vector of each word can be omitted in this part. We usexij =
f(wij)/kf(wij)kto represent the unit vector with the same direction as the embedded vector ofwij, and use X to represent the collection of all xij where1≤i≤ |D|and1≤j ≤ni.
In order to characterize a semantic region in the embedded space, we introduce von Mises-Fisher (vMF) distribution. The von Mises-Fisher (vMF) distribution is prevalently adopted in directional statistics, which studies the distribution of normal-ized vectors on a spherical space. The probability density function of the vMF distribution is explic-itly instantiated by the cosine similarity. It is an ideal distribution for our task because we use co-sine similarity to measure the semantic proximity. Moreover, as we will see later, it empowers us to characterize how specific each semantic region is, which is helpful in further identification of seman-tic focuses for outlier detection.
1Document frequency of a word (or phrase) is defined as
number of documents where this word or phrase appears.
We first introduce the formalization of the von Mises-Fisher distribution.
Von Mises-Fisher (vMF) distribution. A ν -dimensional unit random vector x (i.e. x ∈ Rν andkxk = 1) follows a von Mises-Fisher distri-bution vMF(·|µ, κ)if the probability density func-tion follows:
p(x) =Cν(κ) exp κµ>x
where Cν(κ) = κν/2−1(2π)ν/2Iν/2−1(κ); and
Iν/2−1(·) is the modified Bessel function of the first kind;(ν/2−1)is the order.
The two parameters in the vMF distribution are the mean directionµand the concentration param-eterκ respectively, whereµ∈ Rν,kµk = 1and
κ > 0. The distribution concentrated around the mean directionµ, and is more concentrated if the concentration parameterκis larger.
Embedded von Mises-Fisher allocation. We propose a generative model by regarding each doc-ument as a bag of normalized embedded vectors, analogous to the bag-of-word representation of documents utilized in typical topic model (e.g., LDA (Blei et al., 2001)). The major difference is that the data to be generated is now a bag-of-normalized-embedded-vectors for each document, and should be generated from a mixed vMF distri-bution instead of a mixed multinomial distridistri-bution. A formalized description of the model is sum-marized as follows:
µt∼vMF(·|µ0, C0), t= 1,2,· · ·, T
κt∼logNormal(·|m0, σ02), t= 1,2,· · ·, T
πi∼Dirichlet(·|α), i= 1,2,· · · ,|D|
zij ∼Categorical(·|πi), j = 1,2,· · ·,|di|
xij ∼vMF(·|µzij, κzij), j = 1,2,· · ·,|di|
whereT > 0is an integer indicating the number of semantic regions, namely the number of vMF distributions in our mixture model.
We regularize the vMF parameters by the fol-lowing prior distributions. We assume the mean direction µt of each vMF distribution is gener-ated from a prior vMF distribution vMF(·|µ0, C0), while the concentration parameterκtis generated from a log-normal prior logNormal(·|m0, σ20). A similar design is also adopted in (Gopal and Yang, 2014).
have conjugate priors, we can integrate out pa-rametersµtandπiand develop a collapsed Gibbs sampler ofzij:
P(zij =t|Z−ij,X,κ;α, m0, σ20,µ0, C0)
∝ n−itij+ 1 +α(t)
Cν(κt)Cν C0µ0+κtx−·tij
CνC0µ0+κt x−·tij +xij
where n−itij = P|di|
j0 δ(zij0 = t) −δ(zij = t)
is the number of words in the i-th document be-ing assigned to the t-th von Mises-Fisher distri-bution without taking wij into account; x−·tij = P|D|
i0
P|di|
j0 xi0j0δ(zi0j0 = t)−δ(zij = t) is the
sum of word vectors assigned to semantic region
twithout countingwij. Here δ(·) is the indicator function.
We can also derive a collapsed Gibbs sampler for concentration parametersκt’s:
P(κt|Z,X,κ−t;α, m0, σ02,µ0, C0)
∝ Cνn·t(κt)
Cν kC0µ0+κtx·tklogNormal(κt|m0, σ 2 0)
wheren·t is the number of words in semantic re-giont.
While sampling zij is relatively trivial, sam-plingκt is not straightforward. Similar difficulty is also mentioned in (Gopal and Yang,2014). We employ a Metropolis-Hasting algorithm with an-other log-normal distribution centered at the cur-rentκtvalue as the proposal distribution.
After obtaining a sample from the posterior dis-tribution of zij’s and κt’s, we can easily obtain the MAP estimate of mean directionsµt’s and the mixing distribution of each documentsπi:
ˆ
µt= kCC0µ0+κtx·t
0µ0+κtx·tk, πˆi =
nit+α(t)
ni·+Ptα(t)
Discussions. We notice that there are some topic models (Das et al., 2015; Batmanghelich et al., 2016) proposed for similar data, where words are represented as embedding vectors. Our model is proposed independently for the purpose of identi-fying semantic focuses, which serves the task of outlier detection. Existing models may lack sig-nals for the following outlier detection steps and hence cannot be directly plugged in. However, it is possible to adapt certain models to the outlier detection task.
3.2 Identifying Semantic Focuses
The semantic regions learned from the Embedded vMF Allocation model provide a set of candidates frequently mentioned by documents in the corpus. However, not all of them are semantic focuses of the corpus — some are too general to distinguish outlier and normal document.
We notice that uninformative semantic regions (e.g.a semantic region containing{“percent”, “av-erage”, “compare”, ...}) tend to have more scat-tered distribution over embedded vectors, possi-bly because of the diverse context of their usage. In contrast, corpus-specific semantic regions are more concentrated, (e.g. a semantic region con-taining{“drugs”, “antidepressant”, “prescription”, ...}). Modeling semantic regions by vMF distri-butions provides us with a parsimonious signal to characterize how concentrated a semantic region is, i.e. the concentration parameter κt. This al-lows us to simply filter unqualified semantic re-gions with too small concentration parameters and obtain high-quality semantic focuses. Let a binary variableφt(t= 1,2,· · ·, T) indicate whether the
t-th vMF distribution is a semantic focus. Sup-pose a user specifies a threshold parameter 0 ≤
β ≤ 1. We can determine φt by estimating the log-normal distribution that generates allκt’s,
logNormal( ˆm,σˆ2), where
ˆ
m= T1 X
t
log(κt), ˆσ2= T1 X
t
log(κt)−mˆ 2
Set Fˆκ(·) to be its cumulative distribution func-tion. We assignφt = 1for semantic regions with
κt ≥Fκ−1(β), and filter all the other semantic re-gions asφt= 0.
Although parameter β needs to be set manu-ally, our experiments suggest the performance is not quite sensitive to its value.
3.3 Document Outlierness
In this subsection, we start with a straightforward definition of outlierness based on the mined se-mantic focuses. Then we present several refine-ments to improve its robustness.
from the semantic focuses.
P φzij = 1|xij,πi
=
P
tφtπ(it)vMF(xij|µt, κt) P
tπ(it)vMF(xij|µt, κt) It is then possible to estimate the expected percent-age of wordsnotdrawn from semantic focuses in each document as the outlierness:
Ωsf(di) = 1−|d1 i|
|di|
X
j=1
P(φzij = 1|xij,πi) (1)
However, due to the noisiness in text data, this assumption oversimplifies the characteriza-tion of outlier documents. In practice, we ob-serve the following two issues: lexically general words/phrases, and noisy content in documents. Penalizing lexically general words and phrases. Not all words or phrases close to semantic focuses are strong indicators of normal documents. Gen-eral words (e.g. “science”) can happen to be se-mantically close to a semantic focus, but are not as specific as most other words close to it (e.g. “medi-cal research”). Therefore, we utilize a background corpusDbgto calculate the specificity of the word. Assuming the actual mention of the word can be chosen from either the general background, or a corpus-specific vocabulary, we write down the probability that a word is corpus-specific to be:
P λij|wij= nd(w nd(wij)/|D|
ij)/|D|+ndbg(wij)/|Dbg| where nd(w) = |{di|w ∈ di, di ∈ D}| is the number of documents in D containing word w;
ndbg(w) = |{di|w ∈ di, di ∈ Dbg}|is the num-ber of documents containing wordwin the back-ground corpusDbg; λij is a binary random vari-able indicating whetherwij is specific enough.
For each word, we define the word isorthodox
if the word is not only semantically close to a se-mantic focus of the corpus, but also sufficiently specific. We then define the probability that a word or phrasewij in documentdiis orthodox as:
P(ϕij|xij,πiwij) =P φzij|xij,πi
P λij|wij) whereϕij = 1indicates thatwij (or equivalently
xij) is orthodox.
Now, we can define a second outlierness mea-sure as the expected percentage of words that are
notorthodox.
Ωe(di) = 1−|d1 i|
|di|
X
j=1
P(ϕij|xij,πi, wij) (2)
0.00 0.05 0.10 0.15 0.20 0.25 0.30
Rank ratio w.r.t.P(ϕij|xij, wij) 0.0
0.2 0.4 0.6 0.8 1.0
P
(
ϕij
|
xij
,w
ij
)
Normal document Outlier document
(a) Ranked orthodox proba-bilityP(ϕij|xij,πi, wij)
0.00 0.05 0.10 0.15 0.20 0.25 0.30
nϕ i/|di| 0.00
0.05 0.10 0.15 0.20 0.25
Probability
density
Normal document Outlier document
(b) Probability distribution of random variablenϕ
[image:5.595.319.520.69.139.2]i/|di|
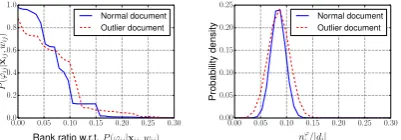
Figure 1: Comparison of a normal document and an outlier document in a news corpus (“Health” topic).
Noisy content in documents. We present the second issue of normal documents with an exam-ple. We compare a normal document in a corpus of New York Times news articles with tag “Health”, to another document originally from another cor-pus, but with its outlierness calculated with regard to the semantic focuses of the “Health” corpus.
In Figure 1(a), we show the distribution of in-ferred orthodox probability P(ϕij = 1|xij, wij) by ranking the words or phrases according to their probability value. We can observe that the outlier document barely has any words or phrases surely orthodox, while the normal document has 5% of words or phrases with a probability no less than
0.8 to be orthodox. However, if we simply take the average, these two documents become indis-tinguishable as the average is substantially domi-nated by the “tail” where most words or phrases in either documents are clearly not orthodox. Let
nϕi be a random variable indicating the true num-ber of orthodox words or phrases in document
di. Sincenϕi follows a Poisson-Binomial distri-bution, we can plot the probability distribution of
nϕi normalized by the length of the document, as shown in Figure 1(b). It can be observed that the difference between the normalized expecta-tion E[nϕi]/di of two documents is insignificant. Therefore, the measure described in Equation (2) will be unable to tell the difference between these two documents.
Orthodox quantile outlierness. We define a
quantile-based outliernessdefinition to rank
doc-ument outliers. Notice that the distribution of ran-dom variablenϕi follows a Poisson-Binomial dis-tribution, which is the total number of success tri-als when one tosses a coin for each word or phrase in the document to determine whether it is ortho-dox with probabilityP(ϕij|xij, wij).
Moreover, we define the first 1
1−θ-quantile of the Poisson-Binomial distribution ofnϕi as:
qθ(nϕi) = sup
q {q :P(n ϕ
i ≥q)≥θ} (3)
where0< θ < 1is a given parameter close to1. Intuitively, it measures the maximum lower bound ofnϕi we can guarantee with confidenceθ.
Based on Equation (3), we can give a formal-ized definition of our proposed outlierness:
Ωθ-q(di) = 1−qθ(n ϕ i) + 1
|di|+ 1 (4)
where the 1
1−θ-quantile is normalized by the doc-ument length with a smoothing constant. The cumulative probability distribution of a Poisson-Binomial distribution can be efficiently calculated by dynamic programming (Chen and Liu,1997).
The advantage of the last proposed outlierness measure is that it emphasizes more on the highly orthodox words or phrases and eliminates the noise from a number of relatively uncertain ones.
4 Experiment Setup 4.1 Data Sets
New York Times News (NYT). We collected 41,959 news article published in 2013 from The New York Times API2. Each article is assigned
with a unique label indicating in which section the article is published, such as Arts, Travel, Sports, and Health. There are totally 9 section labels in our collected data set. We treat papers in each sec-tion as a corpusD. Thereby we have a set of cor-poraD={Ds}, without overlapping documents. We also have an external news data setDecrawled from Google news, with 51,114 news article pub-lished in 2015 without any label information. ArnetMiner Paper Abstracts (ARNET). We employ abstracts of papers published in the field
[image:6.595.309.521.71.126.2]2http://developer.nytimes.com/docs
Table 1: Data set statistics.
Data set CorpusD External corpusDe
Avg.|D| Avg.|d| |De| Avg.|d|
NYT 4,662.11 592.66 52,114 471.63 ARNET 2,930.60 137.21 11,463 152.17
of computer science up to 2013, collected by Ar-netMiner (Tang et al.,2008), and assign each pa-per into a field, according to Wikipedia3. We use
papers from a set of domains to serve as an exter-nal corpusDe, while papers in other domains form different corporaD = {Ds}. Each domain (e.g., data mining, computational biology, and computer graphics) forms a corpusDsrespectively. Again, notice that the corpora do not have overlapping documents with each other.
A summary is presented in Table1.
Benchmark generation. Since we do not have true labels for outliers in a corpus, we use injec-tion method to generate outlier detecinjec-tion bench-mark. For each data set, we randomly select a cor-pusDs∈ Dand mark all of its document as “nor-mal documents”. We then randomly select another corpusD0
s ∈ D, D0s 6=Ds, to injectωdocuments fromD0
s intoDs and mark them as outliers. We confineωto be a small integer less than 1% of the size of|Ds|. More concretely,ωis an integer uni-formly sampled from(0,0.01|Ds|].
For each data set, we randomly generate 10 out-lier detection benchmarks, and evaluate the overall performance by the average performance on all the benchmarks.
4.2 Methods Evaluated
We compare the performances of the following methods.
Cosine similarity based. We characterize each document as a vector, and use the negative aver-age cosine similarity between each document and the corpus as outlierness. We use two different ways to vectorize documents: TF-IDF weighted, and paragraph2vec (Le and Mikolov, 2014). The two methods are denoted as TFIDF-COS and P2V-COS respectively.
KL divergence based. We represent each doc-ument as a probability distribution, and the entire corpus as another probability distribution. Then we use the KL-divergence between each document and the entire corpus as the outlierness. We also
3https://en.wikipedia.org/wiki/List_
use two different ways to calculate the probability distribution. The first is to estimate the unigram distribution for each document and the entire cor-pus respectively, denoted as UNI-KL. The other is to first perform LDA on the entire corpus with 10 topics, and then infer topical allocation distribu-tion of each document and the entire corpus. This method is represented as TM-KL.
Our method Our quantile based method is de-noted as VMF-Q. We also provide two baselines derived from our own method as an ablation anal-ysis. One method abandons the quantile based outlierness but use the expected orthodox percent-age as Equation (2), denoted as VMF-E. The other method further removes the penalty on lexical gen-eral words and phrases, using Equation (1), de-noted as VMF-SF.
4.3 Evaluation Measures
In most outlier detection applications, people are more concerned with recall. We measure the per-formance byrecall at a certain percentage. More specifically, we compute the recall of outlier de-tection if the user checks a certain percentage r
of the top-ranked documents in the output results. Since in our benchmark generation, the percent-age of outliers does not exceed1%. Therefore, the perfect results for anyr≥1%should be1.0.
We chooserto be1%,2%, and5%respectively and evaluate different methods with recall at top-r
(percentage). We also report the performance in terms of mean average precision (MAP).
4.4 Parameter Configurations
All benchmark data sets are preprocessed as de-scribed in Section2. In the NYT data set we move words or phrases within top 20% with re-spect to document frequency, while in the ARNET data set we remove the top 10%. The document frequency is calculated based on a background corpusDbg, which is the same as the external cor-pus of NYT. Word embedding are trained on the external data set De using code of Mikolov et al. (Mikolov et al., 2013) with default parameter configurations, where the embedded vector length is set to 200. For paragraph2vec, we learn the length-100 vectors for each document along with the external data set to guarantee sufficient train-ing data.
For the prior vMF distribution, we setC0 = 0.1, a sufficiently small number so the prior
distribu-Table 2: Performance comparison of different out-lier document detection methods. All results are shown as percents.
Data set Method MAP Rcl@1%Rcl@2%Rcl@5%
NYT
TFIDF-COS 05.03 04.73 06.72 14.72 P2V-COS 22.07 23.45 44.64 66.18 UNI-KL 10.28 11.92 16.32 31.34 TM-KL 14.51 16.50 16.50 24.67 VMF-SF 33.70 31.03 44.45 62.60 VMF-E 36.57 35.91 49.41 67.56 VMF-Q 41.88 56.99 63.29 79.23
ARNET
TFIDF-COS 08.99 15.40 18.75 30.23 P2V-COS 07.39 10.51 14.78 24.14 UNI-KL 07.46 14.13 22.26 39.40 TM-KL 10.09 12.04 15.37 20.24 VMF-SF 10.69 12.05 22.58 44.51 VMF-E 10.51 12.67 25.92 45.37 VMF-Q 19.74 22.40 34.40 53.87
tion is close to a uniform distribution. µ0 is set as a normalized all-1 vector. We also setm0 =
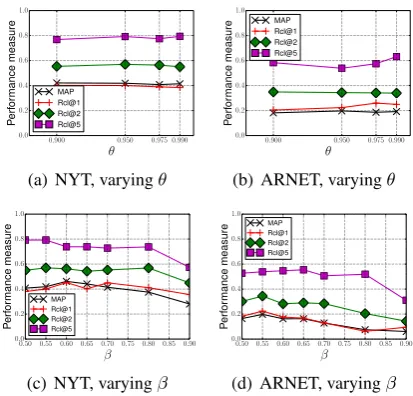
log(100), andσ2 = 0.01. The total number for Gibbs sampling is set to be 50 times of the total count ofzij’s (i.e.η = 50). The number of vMF distributionsT is set to 20 in the NYT data set and 10 in the ARNET data set respectively, due to the smaller sizes of corpora in the ARNET data set.
To determine semantic focuses, we set threshold parameterβ = 0.55for both data sets. The confi-dence parameterθin outlierness calculation is set to 0.95 in both data sets. Our experiments later will show the performance is relatively robust to different configurations of both parameters.
5 Results
We present the experimental results in this section. Performance comparison. Table 2shows per-formance of different outlier document detection methods. It can be observed that our method out-performs all the baselines in both data sets. In both data sets, VMF-Q can achieve a 45% to 135% in-crease from baselines in terms of recall by exam-ining the top 1% outliers. Generally, performances of most methods are lower in the ARNET data set comparing to NYT, potentially because the rela-tively short document lengths and more technical terminologies in ARNET.
0.900 0.950 0.975 0.990 θ
0.0 0.2 0.4 0.6 0.8 1.0
Perf or mance measure MAP Rcl@1 Rcl@2 Rcl@5
(a) NYT, varyingθ
0.900 0.950 0.975 0.990
θ 0.0
0.2 0.4 0.6 0.8 1.0
Perf or mance measure MAP Rcl@1 Rcl@2 Rcl@5
(b) ARNET, varyingθ
0.50 0.55 0.60 0.65 0.70 0.75 0.80 0.85 0.90
β 0.0
0.2 0.4 0.6 0.8 1.0
Perf or mance measure MAP Rcl@1 Rcl@2 Rcl@5
(c) NYT, varyingβ
0.50 0.55 0.60 0.65 0.70 0.75 0.80 0.85 0.90
β 0.0
0.2 0.4 0.6 0.8 1.0
Perf or mance measure MAP Rcl@1 Rcl@2 Rcl@5
[image:8.595.78.285.64.262.2](d) ARNET, varyingβ
Figure 2: Performance of outlier document detec-tion with different parameter configuradetec-tions.
VMF-Q vs. VMF-E VMF-Q vs. P2V-COS 0 20 40 60 80 100 Ag reed by Cro wds (%) VMF-Q VMF-E P2V-COS (a) Health
VMF-Q vs. VMF-E VMF-Q vs. P2V-COS 0 20 40 60 80 100 Ag reed by Cro wds (%) VMF-Q VMF-E P2V-COS (b) Art
Figure 3: Crowd evaluation to compare different outlier detection methods on two corpora in NYT data set.
Sensitivity studies of parameters. We study if our proposed method is sensitive to the confi-dence parameter θand filtering threshold param-eterβ. We compare the performance of VMF-Q by varying each parameter on both data sets. Fig-ure2(a)and2(b)show that the performance is not very sensitive to different values ofθ, as long as
θ is sufficiently large (close to 1). Figure 2(c) and 2(d) show that the performance is relatively stable whenβis between 0.5 and 0.7, but drops a little whenβis set to larger value.
Human judgments. We compare VMF-Q to VMF-E and P2V-COS respectively by crowd-sourcing, without artificially inserting “outliers”. We conduct this experiments on two corpora in NYT data sets with topic “Health” and “Art” re-spectively. To compare two methods, we ran-domly select pairs of documents di and dj such that both are ranked as top-10% outliers by at least one method, but their orders in the two rankings
disagree. We conduct the experiments on Crowd-Flower. Online crowd workers are given di and
dj as well as other documents in the corpus, and are asked to judge which one ofdianddjdeviates more from the corpus. For each corpus, we select 200 pairs of documents.
Before taking the questions, each crowd worker needs to go through at least 10 “test questions” which we know the correct answer. These ques-tions are constructed by taking one document from the corpus as di and another document not from the corpus as dj. Therefore, the one not from the corpus should be the answer. A crowd worker needs to achieve no less than 80% of accuracy to be eligible to work on actual questions, and the accuracy needs to be maintained over 80% during the work, which is measured by “test questions” hidden in actual questions. Each question is an-swered by 3 workers. The final answer is deter-mined by majority voting.
Figure3presents the results. On both corpora, there are significantly more workers tend to agree with VMF-Q comparing to P2V-COS, with sig-nificance level α = 0.05. This further verifies that our method VMF-Q can achieve better perfor-mance than the P2V-COS baseline. On the other hand, on both data sets we can still observe more workers favoring VMF-Q than VMF-E, but the difference is not as large as the difference between VMF-Q and P2V-COS.
Case study. We also conduct a case study to show how our proposed method outperforms other baselines. Table3shows two pairs of documents in “Health” corpus of NYT data set. The left two columns show some comparing methods and their higher ranked outlier documents. The row of “Crowds” shows the outlier document chosen by human workers from the crowdsourcing platform, with a consensus of opinions from multiple work-ers.
In the first document pair, document A is about gun control policy and is substantially irrelevant to “Health” topic, while document B is about lung in-fection cases. Document A is a significant outlier, and VMF-Q and VMF-E also agree with our intu-ition. However, paragraph2vec (P2V) ranks doc-ument B higher, probably because it tries to sum-marize the entire document.
[image:8.595.78.288.321.414.2]dis-Table 3: Case study of documents in “Health” corpus of NYT data set. We present several pairs of documents and how different methods rank the pair. The “Outlier” column indicates the document ranked higher in the outlier document ranking generated by the corresponding methods, and the row “Crowds” shows the ranking given by human evaluators.
Method Outlier Document A Document B
P2V-COS Doc B CHICAGO (AP) States with the most gun con-trol laws have the fewest gun-related deaths, ac-cording to a study that suggests sheer quantity of measures might make a difference ...
A prominent Scottish bagpiping school has warned pipers around to world to clean their instruments regularly after one of its longtime members nearly died of a lung infection ... VMF-E Doc A
VMF-Q Doc A Crowds Doc A
P2V-COS Doc B ATLANTA There’s more evidence that U.S. births may be leveling off after years of de-cline. The number of babies born last year only slipped a little, ...
Young men in a state prison for juveniles and professors of library science from the Univer-sity of South Carolina have joined forces to fight AIDS with a graphic novel ...
VMF-E Doc B VMF-Q Doc A Crowds Doc A
cussing U.S. population is an outlier. However, a great part of document B is about the content of the book, which confuses baselines P2V and VMF-E, as both methods tend to summarize the entire document and highly relevant words like “AIDS” are overwhelmed by the majority of the document. The only method that agrees with human annota-tors is VMF-Q.
6 Conclusion
In this paper, we propose a novel task of detecting document outliers from a given corpus. We pro-pose a generative model to identify semantic fo-cuses of a corpus, each represented as a vMF dis-tribution in the embedded space. We also design a document outlierness measure. We experimen-tally verify the effectiveness of our methods. We hope this work provides insights for further stud-ies on outlier document texts in specific domains, and in more challenging settings such as detecting outliers from crowdsourced data.
References
Kayhan Batmanghelich, Ardavan Saeedi, Karthik Narasimhan, and Samuel Gershman. 2016. Non-parametric spherical topic modeling with word em-beddings. InACL.
David M. Blei, Andrew Y. Ng, and Michael I. Jordan.
2001. Latent dirichlet allocation. In NIPS, pages
601–608.
Varun Chandola, Arindam Banerjee, and Vipin Kumar.
2009. Anomaly detection: A survey.ACM
Comput-ing Surveys, 41(3):15:1–15:58.
Sean X Chen and Jun S Liu. 1997. Statistical ap-plications of the poisson-binomial and conditional bernoulli distributions. Statistica Sinica, pages 875– 892.
Rajarshi Das, Manzil Zaheer, and Chris Dyer. 2015. Gaussian LDA for topic models with word embed-dings. InACL, pages 795–804.
Siddharth Gopal and Yiming Yang. 2014. Von mises-fisher clustering models. InICML, pages 154–162.
David Guthrie. 2008. Unsupervised Detection of
Anomalous Text. Ph.D. thesis, University of Sheffield.
Milos Hauskrecht, Iyad Batal, Michal Valko, Shyam Visweswaran, Gregory F Cooper, and Gilles Cler-mont. 2013. Outlier detection for patient monitor-ing and alertmonitor-ing. Journal of Biomedical Informatics, 46(1):47–55.
Victoria J Hodge and Jim Austin. 2004. A survey of outlier detection methodologies. Artificial Intelli-gence Review, 22(2):85–126.
S. P. Kasiviswanathan, G. Cong, P. Melville, and R. D. Lawrence. 2013. Novel document detection for massive data streams using distributed dictionary learning.IBM J. Res. Dev., 57(3-4):1:9–1:9. Shiva P Kasiviswanathan, Huahua Wang, Arindam
Banerjee, and Prem Melville. 2012. Online l1-dictionary learning with application to novel
docu-ment detection. InNIPS, pages 2258–2266.
Quoc V. Le and Tomas Mikolov. 2014. Distributed
rep-resentations of sentences and documents. InICML,
pages 1188–1196.
Jialu Liu, Jingbo Shang, Chi Wang, Xiang Ren, and Ji-awei Han. 2015. Mining quality phrases from
mas-sive text corpora. In SIGMOD, pages 1729–1744.
ACM.
Tomas Mikolov, Ilya Sutskever, Kai Chen, Greg S Cor-rado, and Jeff Dean. 2013. Distributed representa-tions of words and phrases and their compositional-ity. InNIPS, pages 3111–3119.
Jie Tang, Jing Zhang, Limin Yao, Juanzi Li, Li Zhang, and Zhong Su. 2008. Arnetminer: extraction and
mining of academic social networks. InKDD, pages
[image:9.595.75.527.129.230.2]Jian Zhang, Zoubin Ghahramani, and Yiming Yang. 2004. A probabilistic model for online document clustering with application to novelty detection. In
NIPS, pages 1617–1624.
Yi Zhang, Jamie Callan, and Thomas Minka. 2002. Novelty and redundancy detection in adaptive