A New Partition-based Clustering Algorithm For
Mixed Data
ZHONG Xian, YU TianBao, and XIA HongXia
Abstract—In practical application field, it is common to see the mixed data containing both the numerical attributes and categorical attributes simultaneously. However, most of the given clustering algorithms can only deal with data in single type, either numerical or categorical. Therefore we present a partition-based clustering algorithm for mixed data. First, the multi-Modes representation means of category centres of categorical data in K-prototypes algorithm is given, and then the Euclidean is expanded to mixed data so as to reflect the dissimilarity between the objects and categories more accurately in same framework. On the basis, a partitioned clustering algorithm for processing mixed data is proposed. Finally, the experimental results on UCI dataset show that the proposed algorithm can effectively improve the clustering performance comparing with the K-prototypes algorithm.
Index Terms—K-Prototypes algorithm, Mixed data, Parti-tioned clustering, Dissimilarity measure.
I. INTRODUCTION
A
S an unsupervised learning method, clustering analysis is an important content of research in machine learning and data mining application. According to the thought of “Like attracts like.”, clustering analysis is based on cer-tain rules which divide the data objects into a plurality of class. The similarity is high so that the objects seem in the same class, But differences between the larger ob-ject are not similar. It has been widely applied in image processing[1], information retrieval[2], bioinformatics[3] and social network analysis and other research fields[4], [5]. In recent years, according to different application of clustering analysis, researchers carried out a series of studies, and put forward some effective clustering algorithm, including par-tition clustering[6], hierarchical clustering[7], [8], density-based clustering[9], network-density-based [10]and model density-based clustering algorithm[11], [12]. However, most of the existing clustering algorithm is used only for data in a single type effectively,data will become invalid in the mixed type. Here the single type of data include either numerical or categorical data. The mixed data exist universally in real life. For exam-ple, numerical data attributes to reflect the age, height and weight, while categorical data stand for ethnic, gender, blood type in the description of population datasets. Therefore the design of a good clustering algorithm mixed data is a chal-lenging problem that should be confronted with. To overcomeManuscript received 22, January, 2017; revised 20, February, 2017. This work is supported by National Key Technologies R D Pro-gram of China(2012BAH33F03), National Natural Science Foundation of China(61303029), National Natural Science Foundation of China for Young Scholar(61003130),Science and Technology innovation team project of Wuhan (201307020402005).
ZHONG Xian (Email:[email protected]), YU TianBao (corresponding author, Email:[email protected]) and XIA HongXia (Email:[email protected]) are with the Department of Software Engineering, School of Computer Science and Technology, WuHan University of Technology, HuBei, 430070 CHINA .
the difficulty, some scholars have performed a depth explo-ration. For instance, by integrating the K-Means[13], [14], [15] algorithm and K-Modes algorithm [16], [17] directly together, and extending to the K-Prototypes algorithm[18], Huang and others succeeded to solve the clustering problem of mixed data in 1998. In 2002, the literature[19] proposed a hierarchical agglomerative clustering algorithm SBAC (Sim-ilarity Based Agglomerative Clustering). The sim(Sim-ilarity of Good all is used to measure the similarity between object relation and class relation by SBAC algorithm. Among them, attribute weights which do not often occur, are assigned large values by similarity measure. For a numeric attribute, similarity measure not only contain the value of the differ-ence in size, but also contain the unique value to appear. In 2010, the evolution of the k - prototype algorithm[20] is proposedEKP by introducing an evolutionary algorithm framework and it makes the algorithm own global search ability. In 2011, k - the prototype algorithm of extended algorithm KL - FCM - GM[21] is proposed. In 2012, fuzzy k - prototype algorithm is proposed[22] . On the one hand, this algorithm can keep the data set inherent uncertainty a longer time before the determination data which belongs to the prototype. On the other hand, the effect of different dimen-sions of data on the clustering process is fully considered. Because of its high efficiency and simple implement, par-titional clustering algorithm, represented by K-Proto types, has been widely applied. However, dissimilarity measures between numerical attributes and categorical attributes are not uniformed and there exists difficulties of weighting factor selections in K-prototypes algorithm. Therefore, a partitioned clustering algorithm for processing mixed data, which is based on Kprototypes algorithm, is particularly necessary to appear.Therefore, in this paper, we firstly propose the multi Modes representation means of category centres of categorical data in K-prototypes algorithm, and then the Euclidean is expanded to mixed data so as to reflect the dissimilarity between the objects and categories. On the basis, a partitioned clustering algorithm for processing mixed data is proposed. Finally, the experimental results on UCI dataset show that the proposed algorithm can improve the clustering performance effectively and accurately.
II. K-PROTOTYPES ALGORITHM
Using simple matching to measure the dissimilarity based on category attributes, K-prototypes algorithm[23] is on the basis of K-Means algorithm. So it appears in order to resolve the mixed data clustering problem.
Given a data set X = {X1, X2, . . . , Xn}, in which we
call Xi(i = 1,2, . . . n) data points. Here Xi(1 i n)
are described by eigenvaluesA1, A2,· · ·, Ap, Ap+1,· · ·, Am.
numeri-cal attributes, and Ai(p + 1 i m) be
categor-ical attributes. Here Dom(Aj) means the range of
At-tributeAj. Let Dom(Aj)= n
aj(1), aj(2), . . . , aj(nj
)o
, where nj denotes the number of attribute values of Aj
do-main for Categorical Data. Object Xi which belongs to
X, can be marked by a m-dimension vector, that is Xi = {xi1, xi2, . . . , xip, xi(p+ 1), xi(p+ 2), . . . , xim}.
Here xij Dom(Aj), the clustering center is denoted as Z,
abbreviated asZj (zl1,zl2, . . . ,zlm).
When talking about dissimilarity measures between ob-jects, both numerical attributes and categorical attributes are considerated by the K-Prototypes algorithm. So parameters appears to control how much are contributed by numerical attributes and categorical attributes.
Definition 1 Given a dataset Cl, which belongs to X, is
a class in the K-Prototypes algorithm.Zlis the class center
of Clh. The distance metric between Object X and Class
center Zl is defined as follows: d(Xi, Zl) =dr(Xi, Zl) +
dc(Xi, Zl)
Here it is made of two parts: data attribute and categorical attribute, Dr and dc represents the dissimilarity between
the object and class center, characterized by numeric and categorical attributes respectively. Dr represents the Eu-clidean distance dr(Xi, Zl) =
p P j=1
(xij zlj)2 dc denotes
simple matching to measure the dissimilarity dc(Xi, Zl) = m
P j=p+1
(xij zlj)Here (xij, zlj) = ⇢
1xij6=zlj
0xij=zlj
The minimizing target function is set as F(W, Z) =
k P l=1
n P i=1
wlid(Xi, Zl)
wli 2 {0,1},1 l k,1 i
n;
k P i=1
wli= 1,1in; 0< n P i=1
wli< n,1lk
wli= 1indicates the i-th object belongs to the l-th class,
andwli= 0says that the i-th object does not belong to the
l-th class.
In order to achieve the minimum objective functionF un-der the restrained conditions, The basic steps of K-Prototypes algorithm are as follows:
Step1 Let’s select k objects randomly as the initial cluster center in dataset X;
Step2 According to the Definition 1., calculate the distance between the centers of objects and classes, and allocate each object to the nearest class.
Step3 Update the clustering center, among which data attribute is calculated by averaging the value of the same class and part of the frequency that the property value appears is computed to describe categorical attribute in clustering Algorithms;
Step4 Repeat Step2, Step3, never stop until the ob-jective function F no longer changes.
III. A PARTITION-BASED CLUSTERING ALGORITHM FOR MIXED DATA
Achieving an effective clustering of mixed data, algorithm based on the K-Prototypes still has problems urgently needed to solve in the clustering process.
K-Prototypes clustering algorithms is made up of numeri-cal attributes and categorinumeri-cal attributes, among which data at-tribute is calculated by averaging the value of the same class.
and part of the frequency that the property value appears is computed to describe categorical attribute in clustering Algorithms; However, the category centres of categorical data in K-prototypes algorithm, failed to adequately take the effect that other attribute values with non-highest frequency on the clustering center of attribute values into account. It is difficult to accurately reflect the value of objects in the class. And when a property value with highest frequency is more than one, Mode will not be unique. Choosing a different Mode to calculate the dissimilarity measure may get exactly the opposite conclusion, which led to the algorithm unstable. Secondly, Using simple matching to measure the dissim-ilarity based on category attributes, (object with the same class center dissimilarity is 0; otherwise, the dissimilarity 1)of objects and class center. This calculation does not accurately confirm the similarity of objects and the other samples in the corresponding class, and the situation that whether the object is to join a class, That not only depends on the difference between the object and the prototype, but also depends on the overall differences between objects and the existing objects in the class. And when one object and the center of the object with multiple classes are in the same degree of difference, K-Prototypes algorithm often join the objects this into a class randomly, they always can not be accurately divided into classes with greater degree of similarity. Although dissimilarity measure integrates Eu-clidean and simple matching metric, the distance metric mixed data, obtained by a simple accumulation, fails to accurately measure the dissimilarity values and classification of the data portion of the data portion in a unified framework. What’s worse, the selection of parameter which controls how much is contributed is a very difficult problem in practical applications when accumulating the dissimilarity of different types of data.
For the above problems, this section first gives a categori-cal attribute class that represents the central part of the multi Modes way, and expand the traditional Euclidean distance to the mixed data, to reflect the dissimilarity between the objects and categories. Finally, the experimental results show that the proposed algorithm can improve the clustering performance effectively and accurately at the same frame. Furthermore, we present a partition-based clustering algorithm for mixed data.
Definition 2C1 represents a class obtained by datasetX
in the clustering process, the representation of categorical attribute part of the multi-class center Modes is defined as:
Zc
l = (zl(p+1), zl(p+2), . . . , zlm)
Among this,zlj = {(a(1)j , flj1),(a(2)j , flj2), . . . ,(a(jnj),
fljnj)},p+ 1jm
nj illustrates the number of different value in numerical
range under the j-th classification attribute values;fljw(1
wnj) illustrate the occurrence frequency of aw in Class
C in numerical range under the j-th classification attribute values.
In order to reveal the categorical attribute class that represents the central part of the multi Modes way more intuitively, we explain these results as follows:
Example 1: Assume that the data shown in Table 1. represent the categorical attribute in the process of clustering. There are{X1, X2, X3, X4, X5}5 objects and{A1, A2, A3}
Table 1. A clustering result data table
A1 A2 A3
X1 A d f
X2 A e g
X3 B e f
X4 C d f
X5 C d g
[image:3.595.319.534.332.388.2]According to the calculation method of the categorical attribute class that represents the central part of the multi Modes way in the K-Prototypes algorithm, data shown in Table 1 mean that the Modes of Class Cl is {a, d, f} or {c, d, f}. So there is no unique nature here, it will likely lead to an unstable algorithm. But based on the Definition 2., the more Modes for class center of this class is Zc
l =
(z11, z12, z13),
Here z11 = {(a,0,4),(b,0,2),(c,0,4)}, z12 =
{(d,0,6),(e,0,4)},z13={(f,0,6),(g,0,2)}.
According to the Definition 2,a singleton object may also be expressed as the form of multi-Modes, such as categorical data objects X6 = (c, d, f), the form of
multi-Modes is X06 = (x
0
61, x
0
62, x
0
63),x
0
61={(a,0),(b,0),(c,1)},
x062={(d,1),(e,0)}andx
0
63={(f,1),(g,0)}.
According to the central part of the multi Modes rep-resentation in the categorical attribute class, the extended Euclidean distance metric is as follows.
Definition 3 Given Zc
i = (zi(p+1), zi(p+2), . . . , zim) and
Zc
j = (zj(p+1), zj(p+2), . . . , zjm) as two class centers
ex-pressed by multi Modes in categorical attributes for data sets X and here Dc(Zic, Zjc) =
m P t=p+1
1
nt
nt
P s=1
(fits fjts)2
is defined as the Euclidean distance betweenZc
i andZjc. Definition 4 Let Cl ⇢ X be a clustering result in the
process of clustering algorithm, and Z0l = {Zlr, Zlc} be the
class center ofCl, whereZlr is the mean value of the center
of the class in categorical attributes andZc
l is the class center
expressed by multi Modes in categorical attributes defined by Definition 2. The definition of Euclidean distance between the objectD(Xi, Z
0
l) = Dr(Xi, Zlr) + Dc(X
0
i, Zlc)
Where Dr(Xi, Zlr) represents numerical attributes part
of the Euclidean distance, namely; Dr(Xi, Zlr) = p
P i=1
(xis zls)2 Dc(X
0
i, Zlc) represents the Euclidean
dis-tance extended by multi Modes centres in categorical at-tributes defined by Definition 3. Xi0 in the form of objects
Xi that represent more modes.
Let X be a hybrid data sets, and apply the extended Euclidean distance given above to K-Prototypes algorithm, the objective function is defined as:
F0(W,Z0) =
k P l=1 n P i=1
wliD(Xi, Z
0
l)
wli 2 {0,1},1 l k,1 i
n;
k P i=1
wli= 1,1in; 0< n P i=1
wli< n,1lk
The optimization problem above is a very complex nonlin-ear programming problem, the stepwise optimization strategy is that: first fixed cluster centersZ0, minimizing the objective function F0 to get attached to the matrix W; then fixed membership matrixW, minimizing the objective functionF0 to get a new cluster centerZ0; so iterations, never stop until the objective function can not continue to optimize, which is similar to the K-Means algorithm.
Based on the center of the class expressed by multi Modes and extended Euclidean distance metric based on hybrid data
partition. a partition-based clustering algorithm for mixed data are described below.
Step1 Let’s select k objects randomly as the initial cluster center in datasetX;
Step2 According to the Definition 4, calculate the dis-similarity between the objects and centers of classes, with reference to the extended Euclidean distance metric, and according to the minimization principle divide the data set into the cluster represented by its nearest cluster center;
Step3 Update the clustering center,among which data attribute is calculated by averaging the value of the same class, and the center of classes expressed by multi Modes is for Categorical Attributes according to the Definition 4;
Step4 Repeat Step2, Step3, never stop until the objective F0 function no longer changes.
IV. EXPERIMENTAL ANALYSIS
To validate the effectiveness and feasibility of the proposed algorithm,we made a centralized selection of four data sets from UCI real data:Teaching assistant evaluation (TAE), Heart disease (Heart), Australian Credit approval (Credit) and Contraceptive method choice (CMC), and compare the algorithm proposed in this paper(IK-P) and K-Prototypes algorithm(K-P). 4 data sets are described in Table 2 below.
Table 2. Description of the data sets
datasets objects numerical attribute Categorical attribute class
TAE 151 1 4 3
Heart 303 5 8 2
Credit 690 6 8 2
CMC 1473 2 7 3
In order to assess the effectiveness of the algorithm, accuracy, precision, recall and adjusted rand index[23] four
indicators use to evaluate clustering results. X is a set of data set consisting of n objects.
The clustering result isC ={C1, C2, . . .Ck}, and the real
division is P ={P1, P2, . . .Pk0}. ai represents the correct
number of objects assigned to the i-th class, bi represents
the number of objects mistakenly assigned to the i-th class, ci represents the object which should be assigned to classi
was not assigned to a number of objects, andnij the number
of objects is included between Ci andPi in common. AC
(accuracy), PR (precision), RE (recall) and ARI (adjusted rand index) 4 indicators are defined as follows:
AC=n1
k P i=1
ai
P E= 1
k k P i=1
ai
ai+bi
RE= 1k
k P i=1
ai
ai+ci
ARI= P ij ✓ nij 2 ◆ EiDj
✓
n 2
◆
1
2(Ei+Dj) EiDj
✓
n 2
◆
(WhereEi=Pi
✓
ei
2
◆
,Di=Pj
✓
dj
2
◆
)
If the clustering results are more close to the real classi-fication of the data set thenAC,P E,RE andARI values is bigger.
In the experiment, in order to avoid the influence that fea-tures in different numerical value turn out different distance calculation, the standardization of numeric data is needed before before clustering. The standard formula is:
X0ij=
Xij min(X·j)
[image:3.595.312.504.542.691.2]Among this,1 in,1j p,Xij means the value
of the I data in the j attributeXij0 is the standardized value
after Xij. max(X·j) and min(X·j) are the representation
of the whole dataset the j properties of the minimum and maximum values respectively.
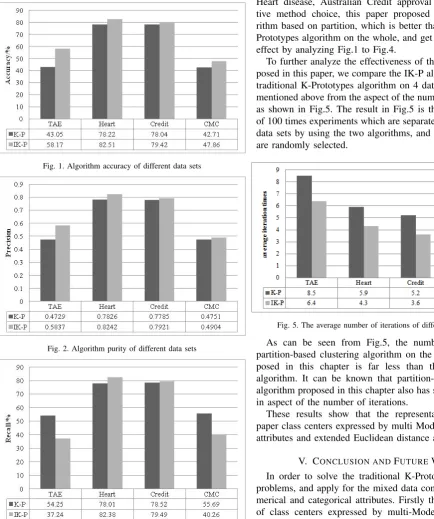
[image:4.595.301.550.52.205.2]Due to the effect of choice of the initial cluster centers, cluster partition clustering algorithm may have different clustering results, so select 100 groups of class center in the 4 data sets randomly. Then each algorithm may run 100 times. We can validate the effectiveness of the algorithm by calculating the average clustering quality. On 4 datasets, clustering performance of the proposed algorithms(IK-P) and the K-Prototypes algorithms(K-P) in different evaluation indexes were compared in Fig.1 to Fig.4 as follows:
Fig. 1. Algorithm accuracy of different data sets
Fig. 2. Algorithm purity of different data sets
Fig. 3. Algorithm recall rate of different data sets
Fig. 4. Algorithm Teresa index of different data sets
According to the datasets Teaching assistant evaluation Heart disease, Australian Credit approval and Contracep-tive method choice, this paper proposed clustering algo-rithm based on partition, which is better than traditional K-Prototypes algorithm on the whole, and get better clustering effect by analyzing Fig.1 to Fig.4.
To further analyze the effectiveness of the algorithm pro-posed in this paper, we compare the IK-P algorithm with the traditional K-Prototypes algorithm on 4 data sets which are mentioned above from the aspect of the number of iterations, as shown in Fig.5. The result in Fig.5 is the average result of 100 times experiments which are separately done on the 4 data sets by using the two algorithms, and the class centers are randomly selected.
Fig. 5. The average number of iterations of different data sets
As can be seen from Fig.5, the number of iterations partition-based clustering algorithm on the 4 data sets pro-posed in this chapter is far less than the K-Prototypes algorithm. It can be known that partition-based clustering algorithm proposed in this chapter also has some advantages in aspect of the number of iterations.
These results show that the representation of in this paper class centers expressed by multi Modes in categorical attributes and extended Euclidean distance are valid.
V. CONCLUSION ANDFUTUREWORK
[image:4.595.47.482.244.764.2]design a partition-based clustering algorithm for mixed data. Compared to the traditional K-Prototypes algorithm, with a series of experiments, K-Prototypes is superior to traditional clustering algorithm on the overall proposed and have more effective result for the actual data.
REFERENCES
[1] M. Gong, Y. Liang, J. Shi, W. Ma, and J. Ma, “Fuzzy c-means cluster-ing with local information and kernel metric for image segmentation,” IEEE Transactions on Image Processing A Publication of the IEEE Signal Processing Society, vol. 22, no. 2, pp. 573–584, 2013. [2] X. Ren, J. Liu, X. Yu, U. Khandelwal, Q. Gu, L. Wang, and
J. Han, “Cluscite: effective citation recommendation by information network-based clustering,” inProceedings of the 20th ACM SIGKDD international conference on Knowledge discovery and data mining, 2016, pp. 821–830.
[3] Y. Si, P. Liu, P. Li, and T. P. Brutnell, “Model-based clustering for rna-seq data.”Bioinformatics, vol. 30, no. 2, pp. 197–205, 2014. [4] D. W. R. Xu, “Survey of clustering algorithms for manet,” IEEE
Transactions on Neural Networks, vol. 16, no. 3, p. 645678, 2005. [5] J. G. Sun, J. Liu, and L. Y. Zhao, “Clustering algorithms research,”
Journal of Software, vol. 19, no. 19, 2008.
[6] R. T. Aldahdooh and W. Ashour, “Dimk-means distance-based ini-tialization method for k-means clustering algorithm,” International Journal of Intelligent Systems Applications, vol. 5, no. 2074-904X, pp. 41–51, 2013.
[7] Y. Malitsky, A. Sabharwal, H. Samulowitz, and M. Sellmann, “Algo-rithm portfolios based on cost-sensitive hierarchical clustering,” 2013. [8] S. Zahra, M. A. Ghazanfar, A. Khalid, M. A. Azam, U. Naeem, and A. Prugel-Bennett, “Novel centroid selection approaches for kmeans-clustering based recommender systems,” Information Sciences, vol. 320, no. C, pp. 156–189, 2015.
[9] Y. Kim, K. Shim, M. S. Kim, and J. S. Lee, “Dbcure-mr: An efficient density-based clustering algorithm for large data using mapreduce,” Information Systems, vol. 42, no. 2, pp. 15–35, 2013.
[10] S. Wang and Y. Chen, “Hasta: A hierarchical-grid clustering algorithm with data field,”International Journal of Data Warehousing Mining, vol. 10, no. 2, pp. 39–54, 2014.
[11] J. Jacques and C. Preda, “Model-based clustering for multivariate functional data,” Computational Statistics Data Analysis, vol. 71, no. 3, pp. 92–106, 2014.
[12] J. Y. Chen and H. H. He, “A fast density-based data stream cluster-ing algorithm with cluster centers self-determined for mixed data,” Information Sciences An International Journal, vol. 345, no. C, pp. 271–293, 2016.
[13] J. Macqueen, “Some methods for classification and analysis of multi-variate observations,” inProc. of Berkeley Symposium on Mathemati-cal Statistics and Probability, 1967, pp. 281–297.
[14] M. S. Yang and Y. C. Tian, “Bias-correction fuzzy clustering algo-rithms,”Information Sciences, vol. 309, pp. 138–162, 2015. [15] A. Saha and S. Das, “Categorical fuzzy k -modes clustering with
automated feature weight learning,”Neurocomputing, vol. 166, no. C, pp. 422–435, 2015.
[16] J. Y. Chen and H. H. He, “Research on density-based clustering algorithm for mixed data with determine cluster centers automatically,” Acta Automatica Sinica, 2002.
[17] Z. Huang, “A fast clustering algorithm to cluster very large categorical data sets in data mining,”Research Issues on Data Mining Knowledge Discovery, pp. 1–8, 1998.
[18] ——, “Extensions to the k-means algorithm for clustering large data sets with categorical values,” Data Mining Knowledge Discovery, vol. 2, no. 3, pp. 283–304, 1998.
[19] C. Li and G. Biswas, “Unsupervised learning with mixed numeric and nominal data,”IEEE Transactions on Knowledge Data Engineering, vol. 14, no. 4, pp. 673–690, 2002.
[20] Z. Zheng, M. Gong, J. Ma, and L. Jiao, “Unsupervised evolutionary clustering algorithm for mixed type data,” in IEEE Congress on Evolutionary Computation, Cec 2010, Barcelona, Spain, 18-23 July, 2010, pp. 1–8.
[21] S. P. Chatzis, “A fuzzy c -means-type algorithm for clustering of data with mixed numeric and categorical attributes employing a proba-bilistic dissimilarity functional,”Expert Systems with Applications An International Journal, vol. 38, no. 7, pp. 8684–8689, 2011. [22] J. Ji, W. Pang, C. Zhou, X. Han, and Z. Wang, “A fuzzy k-prototype
clustering algorithm for mixed numeric and categorical data,” Neuro-computing, vol. 120, no. 10, pp. 590–596, 2013.