ABSTRACT. Nutritional dwarfmg refers to a condition in which maladaptive eating patterns play a primary role in poor linear growth and delayed pubertal development. The present controlled study assesses whether nutrition ally dwarfed children and adolescents differ in their psy chosocial adjustment from healthy children and adoles cents of comparable height in ways that might account for their undernutrition. Children with nutritional dwarf ing (n = 16) were compared by standardized question naires with a short-stature (ie, heights below the fifth percentile) control group composed of children and ado lescents with constitutional growth delay and/or familial short stature (n = 31). Scores on a self-report screening questionnaire for eating disorders did not differentiate the groups. Moreover, the vast majority of nutritionally dwarfed patients expressed a desire to have a heavier physical appearance. Whereas the groups were generally similar in self-perceptions of domain-specific competen cies and positive psychosocial adjustment, the parents of nutritionally dwarfed children reported that their chil dren showed significantly fewer externalized behavior problems. These findings suggest the existence of an eating disturbance that compromises growth in childhood and/or adolescencewhich,unlike anorexianervosa,is not associated with evidence of psychopathology. Pediatrics 1991;88:926—933;nutritional dwarfing, short stature, an orexia nervosa, eating disorders, failure to thrive.
ABBREVIATiONS.ND, nutritional dwarfing', C/FSS, constitu tional growth delay and/or familial short stature; EAT-26, Eat
Received for publication Jul 9, 1990; accepted Oct 11, 1990. Dr Sandberg is currently on staff of the Psychoendocrinology Program of the Division of Child and Adolescent Psychiatry at the Children's Hospital of Buffalo and on the faculty of the
Departments of Psychiatry and Pediatrics of the State Univer
sity of New York at Buffalo.
Reprint requests to (F.L.) Director of Pediatrics, Maimonides Medical Center, Brooklyn, NY 11219.
PEDIATRICS (ISSN 0031 4005). Copyright ©1991 by the American Academyof Pediatrics.
ing Attitudes Test-26 Item Version; YSR, Youth Self-Report; CBCL, Child Behavior Checklist.
Nutritional dwarfing (ND) refers to a pattern of growth in children and adolescents defined by the anthropometric indices of the Wellcome Classifi cation system.' Because the subnormal weight gain observed in such children is accompanied by a proportionate decline in growth velocity, body weight-for-height deficits are frequently not evi dent. Therefore, they do not present with emacia tion as is commonly observed in cases of severe malnutrition associated with poverty or as is ob served in eating disorders such as anorexia ner vosa.3
Although food shortage in developing countries is the most common cause of ND, this pattern of suboptimal growth has also been observed under circumstances unrelated to poverty.4'5 In these cases, inappropriate eating habits rather than lim ited food availability are the primary source of the poor growth. Nutritional dwarfing thus resembles the condition of failure to thrive in that both are characterized by a nutritionally mediated growth defect without obvious underlying organic cause. In fact, children and adolescents with ND may consti tute a subgroup of those with failure to thrive that shows a number of distinguishing features. First, children and adolescents with the form of ND that results from a self-selected hypocaloric diet typi cally first show signs of declining growth velocity in middle childhood or early adolescence. Much of the failure-to-thrive literature, however, focuses on growth deficits observed in infancy or early child hood.6 Further, ND has thus far not been shown to be associated with obvious signs of psychiatric dis
NutritionalDwarfing:Is It a Consequenceof
DisturbedPsychosocialFunctioning?
David E. Sandberg, PhD*f; Melanie M. Smith, MNS, RDf;
Victor Fornari, MD*f; Marjorie Goldstein, MPH@;
and Fima Lifshitz, MDf
Fromthe Departmentsof *psychiat,.y,jPediatrics,and §Research,NorthShoreUniversity
order whereas disturbed behavioral functioning is frequently a concomitant of failure to thrive.7
Because food intake is self-limited in children with ND, the question arises of whether these pa tients are suffering from a psychiatrically based eating disorder, namely anorexia nervosa, bulimia nervosa, or subclinical forms of these conditions. Earlier, uncontrolled, psychiatric studies8 have failed to demonstrate that this group shows the distinguishing features of anorexia nervosa. They also differ in terms of the sex ratio of referred children and adolescents: whereas anorexia nervosa is a condition occurring predominantly in females, the sex ratio of ND is weighted toward a predomi nance of males.4'5 This observation may partially be an artifact of the short stature that is an asso ciated feature of ND because boys are more fre quently referred for evaluation of short stature than are girls.9 Despite these differences, it remains pos sible that at the time of initial presentation, ND patients are suffering from an early, prodromal form of an eating disorder which over time may develop into the full-blown syndrome.
To address this possibility, the present study assessed the eating attitudes and psychosocial func tioning of a group of children and adolescents with ND. If the suboptimal diet observed in the ND group is a consequence ofa subclinical or prodromal form of an eating disorder (ie, anorexia nervosa or bulimia nervosa), then this could be detected through a higher number of reported behavioral and/or cognitive symptoms known to be frequently associated with these conditions. Further, it was postulated that nutritionally dwarfed children and adolescents would show poorer general psychosocial functioning than the control group because psychi atric comorbidity is common in the eating disorders, including early-onset or subclinical anorexia ner vosa.'°@3Because previous studies have demon strated that short stature itself can serve as a barrier to positive self-perceptions and psychosocial adjustment,'4 ND patients were compared with a group of short but otherwise healthy children (ie, children with constitutional growth delay and/or familial short stature [C/FSS]).
The present study was designed to address the following questions: (1) Do ND patients report more behavioral or cognitive symptoms associated with eating disorders than do patients with C/FSS? (2) Do ND patients show signs ofpoorer self-esteem and poorer global self-worth than do children with C/FSS? (3) Do ND patients report poorer social competencies and/or more behavior problems than do children with CIFSS? (4) Do parents of ND patients report poorer social competencies and/or
more behavior problems in their children than do parents of children with C/FSS?
METHODS
Patients
Data were excerpted from medical files of con secutive patients (male and female), 6 to 16 years of age, who were referred to Division of Pediatric Endocrinology at a New York City area hospital for an evaluation of short stature. All patients had received a comprehensive inpatient medical, endo crime, nutritional, and psychosocial evaluation.
Selection Criteria
Target Group: ND. A total of 16 patients (9 boys
and 7 girls) whose growth pattern was consistent with the Wellcome Classification' of nutritional dwarfing were included in this group. The specific criteria used in this study were as follows: (1) de celerating weight progression, with a rate of weight gain of less than 33% of that observed prior to the decline; (2) decelerating growth which followed the decline in weight gain and which was marked by a growth velocity below the third percentile for norms; (3) no evidence of primary endocrinopathy, organic disease, or mental retardation.
Control Group:C/FSS. This groupcomprised31
healthy children (26 boys and 5 girls) with heights at or below the fifth percentile for age and sex norms and who met the following specific criteria: (1) consistent increments of weight gain and linear growth which followed the same major percentile channel throughout childhood; (2) predicted adult height (based on growth velocity and bone age) within 2.0 standard deviations of midparental height; (3) no evidence of endocrinopathy, organic disease, or mental retardation.
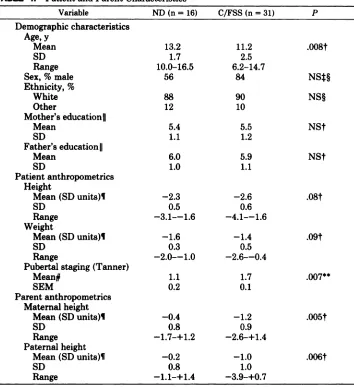
Variable ND (n = 16) C/FSS (n = 31) P TABLE 1. PatientandParentCharacteristics5
Demographic characteristics Age, y
Mean SD Range Sex, % male Ethnicity, %
White Other
Mother's education II Mean
SD
Father's education II Mean
SD
Patient anthropometrics Height
Mean (SD units)11 SD
Range Weight
Mean (SD units)1 SD
Range
Pubertal staging (Tanner) Mean#
SEM
Parent anthropometrics Maternal height
Mean (SD units)1 SD
Range Paternal height
Mean (SD units)1E SD
Range
All patients included in this study were admitted to the pediatric metabolic unit for an evaluation of their short stature. The assessment included a com prehensive medical examination performed by a pediatric endocrinologist. The nutritional status of both groups was assessed by anthropometric, die tary, and biochemical methods. This evaluation included a 24-hour dietary recall and an assessment of food preferences and eating patterns. The nutri tional assessment also included the administration of three questionnaires developed by our group: one
11.2 2.5 6.2—14.7
84
90 10
5.5 NSt
1.2
5.9 NSt
1.1
—¿2.6 .08t
0.6
—¿4.1——1.6
—¿1.4 .09t
0.5 —¿2.6——0.4
1.7 @oo7**
0.1
.008t
NS1@ NS@ 13.2
1.7 10.0—16.5
56
88
12
5.4 1.1
6.0 1.0
—¿2.3 0.5
—¿3.1——1.6 —¿1.6
0.3
—¿2.0——1.0
1.1 0.2
—¿0.4
0.8 —¿1.7—+1.2
—¿1.2 .005t
0.9 —¿2.6-+1.4
—¿0.2 —¿1.0 .006t
0.8 1.0
—¿1.1—+1.4 —¿3.9—+0.7
S Abbreviations: ND, nutritional dwarfmg-, C/FSS, constitutional growth
familial short stature.
t Probabilityassociated
with t test.
:1:
Statistically
nonsignificant
(ie,P > .10).
§
Probabilityassociated
with x2usingcorrectionfor continuity.
HSeven-point
scale:7 = graduate
degree,
5 = partialcollege,3 = lOth-lith grade.
I Individual heightsand weightsare calculatedas sex- and age-standardizedscores(first National Health and Nutrition Examination Surve?').#Tannerstagemeansaresex-andage-adjusted.
*5 Probability associated with analysis of covariance in which subject's age and sex were
usedascovariates.
delay and/or
Procedure
completed by the patient and two by the mother.figure looks most like the way you would like to look if you could?―
In addition to the medical and nutritional aspects of the evaluation, all patients received a screening assessment for psychosocial functioning which, in our clinic, is a routine component of the compre hensive evaluation of short stature. Both the pa tient and parent (usually the mother) served as informants. The children and adolescents them selves provided information about their eating at titudes and behaviors through the Eating Attitudes Test-26 Item Version (EAT-26).'5 This is a ques tionnaire that is frequently used to screen for atti tudes and behaviors suggestive of a diagnosis of an eating disorder. A total score of 20 is used as a “¿cutoffscore―for this questionnaire.'5 Self-percep tions of domain-specific competence were assessed with the Self-Perception Profile.'6 Patients 12 years and younger were administered the child versions of both instruments'6―7 and older patients received the adult and adolescent versions of the EAT-26'5 and Self-Perception Profile,'8 respectively.
The Youth Self-Report'9 (YSR) was used to as sess self-reported positive psychosocial adjustment and behavior problems in those patients 11 years and older. Scale scores are reported as normalized T scores.'9 The parallel Child Behavior Checklist20 (CBCL) was used to assess the same domains of functioning as the YSR, but from the parent's perspective. Here also, scale scores are presented as normalized T scores. The CBCL is appropriate for use with parents of children 4 to 16 years of age. As part of the clinical interview that focused on the child's psychosocial adjustment, parents also were asked whether their child had received mental health services during the year prior to the admis sion. Due to scheduling difficulties related to the inpatient clinical evaluation, not all patients were administered the full questionnaire protocol as de scribed above.
Statistical Analysis
Unless otherwise indicated, statistical compari sons between the target and control groups were done by analyses of covariance for which subject's age and sex were controlled. Additional standard parameters (t test) and nonparametric analyses (x2, Fisher's Exact Test) were performed.
RESULTS
Anthropometnc Characteristics and Pubertal Staging
Measurements obtained at the time of the eval uation are summarized in Table 1 (middle). Heights
and weights are reported in terms of standard (z) scores. A z score expresses the value of a score relative to the mean and the standard deviation of a reference distribution. It has a mean equal to zero and a standard deviation equal to one. The refer ence distribution used in this study were the pop ulation norms for age and sex published by the National Center for Health Statistics (first Na tional Health and Nutrition Examination Surve?'). Both groups had a mean height exceeding 2 SD below the mean for norms (ie, <3rd percent ile). Whereas there was a statistical trend (P = .08) for the ND group to be somewhat taller than the control group, a statistical trend (P = .09) in the opposite direction was observed for weight (ie, ND patients weighed less than the C/FSS group). Ad ditional validation of the diagnosis of ND can be inferred from an inspection of parental heights (Table 1, bottom). Despite the fact that the target and control groups were not significantly different in height-for-age and sex, both the mothers and fathers of children with ND were significantly taller than those of the control group of C/FSS patients. Further, consistent with their lower body weight, the ND group was also significantly less sexually mature than the control group after correcting for subject's age and sex (Table 1, middle, P = .007).
Eating Disorder Symptoms
ScaleChild (13+y)ND Version (6—12y)Adolescent Version
(n = 7)C/FSS (n = 16)P (t Test)ND (n = 5) C/FSS (n = 8)P (t Test)Scholastic
Competence3.4
(1.0)3.3 (0.6)NSt3.6 (0.7)3.0
(0.5).09Social
Acceptance3.4
(0.5)3.2 (0.7)NS3.6 (0.5)3.1
(0.6).10Athletic
Competence3.1
(0.5)3.1 (0.7)NS3.1 (1.1)3.2
(0.7)NSPhysical
Appearance3.0
(0.8)3.2 (0.6)NS2.6 (1.0)2.6
(0.7)NSJob
CompetenceNA@NA@. . .3.5
(0.6)3.0 (0.4)NSRomantic
AppealNA@NA@. . .2.8
(1.1)2.2 (0.8)NSBehavioral
Conduct
3.63.3NS3.42.7.02Conduct/Morality(0.2)(0.7)(0.5)(0.4)Close
FriendshipsNAINA@. . .3.7
(0.4)3.4 (0.5)NSGlobal
Self-worth3.5
(0.8)3.6 (0.5)NS3.5 (0.7)3.1 (0.5)NS
Perceived Self-competence
The mean (±SD)scale scores on the Self-percep tion Profiles of the ND vs C/FSS groups are sum marized in Table 2. Overall, there were few signif icant differences between the groups: adolescent patients (13 years and older) with ND received a higher score (P = .02) on the Conduct/Morality scale than did the C/FSS control group (indicating better behavioral conduct). There also were statis tical trends for the adolescent ND group to receive higher scores on the Scholastic Competence (P = .09) and Social Acceptance (P = .10) scales. None of the mean scale score differences between the younger ND and C/FSS patients (6 through 12 years old) achieved statistical significance. Regard ing both groups, it is particularly noteworthy that with the exception of one scale (Romantic Appeal) the scale scores of the target and control group fell above the midpoint (2.5) for the scales, indicating a positive self-appraisal in the domain of inquiry. Finally, the pattern of differences between the ND and C/FSS groups remained the same even when the subjects' scores were statistically corrected (by analysis ofcovariance) for either height (in z scores) or sex.
Self-reports of Psychosocial Adjustment
Subjects' self-report scores on selected scales of the YSR are summarized in Table 3 (top). No statistically significant differences were detected
between the groups on any of the social competency scales or summary behavior problem scales. Addi tional comparisons for the seven narrow-band be havior syndrome scales included in the YSR (not shown in table) also failed to show a significant difference between the groups in the percentage of each subsample receiving scale scores falling within the “¿clinicalrange―(ie, >89th percentile for the YSR nonclinical standardization sample). The overall level of adaptive functioning of both cmi cally referred groups (ND and C/FSS) was compa rable with that of the medically nonreferred corn munity sample (N = 779) used to standardize the YSR.'9
Parent Reports of Psychosocial Adjustment
Paralleling the findings for the YSR, parent re ports of positive psychosocial adjustment, as as sessed by the CBCL, did not differentiate the ND patients as showing more behavior disturbance (Table 3, bottom). On the contrary, there was a statistical trend (P = .07) for the ND group to show better school performance than the control group. With regard to behavior problems, the ND group also received significantly lower scores (ie, fewer behavior problems) on the Externalizing behavior problem scale. Finally, there was no significant difference between the groups in the Total Behavior Problem score nor in the proportion of subjects in each group receiving scores falling above the clinical
TABLE 2. Mean (SD) Scoreson Self-perceptionProfilefor ChildrenandAdolescents5
S Scale scores are equal to the individual's mean response for each of the six (child version) or five (adolescent version)
items that comprise the respective scales. Scale range: 1—4(1 = most negative, 4 = most positive self-appraisal). ND, nutritional dwarfing',C/FSS, constitutional growth delay and/or familial short stature. NS, statistically nonsignificant difference (ie, P > .10).
TABLE 3. AdjustedMean (±SE
of the Youth Self-Report (YSR) Checklist (CBCL)5M)
T Scores on Scales and Child
BehaviorYSR
Scale ND (n = 15)C/FSS (n = 21) PtSocial
Competencies
Activities 51.5 (1.3)
Social 50.7(1.9)
Schools 2.3 (0.1)
Total 54.7 (2.3)
Behavior Problems
Internalizing 47.5 (2.7) Externalizing 46.5(2.0)
Total 46.6 (2.3)51.9
(1.1) NS
49.4 (1.6) NS 2.4 (0.1) NS 54.4 (1.9) NS
50.0 (2.2) NS
45.8 (1.6) NS 47.9 (1.9) NSCBCL
Scale ND (n = 15)C/FSS (n = 31) PtSocial
Competencies
Activities 46.2 (2.0)
Social 45.0 (3.0)
School 51.4 (2.5)
Total 47.4 (3.2)
Behavior Problems
Internalizing 56.1 (1.9)
Externalizing 49.5(2.5)
Total 54.3 (2.3)48.7
(1.3) NS 42.3 (2.0) NS 45.7 (1.6) .07 44.9 (2.0) NS
58.7 (1.3) NS 57.3 (1.7) .02 59.1 (1.5) NS
perceptions and fewer externalizing-type behavior problems than the C/FSS control group of patients. The item groupings of Externalizing and Internal izing reflect the distinction between aggressive, an tisocial, undercontrolled behavior and fearful, in hibited, and overcontrolled behavior, respectively.20
The finding of “¿nodifference―between the ND and C/FSS groups on the majority of YSR and CBCL scales is notable. This interpretation must be qualified, however, by an estimation of the sta tistical power available in this study to detect small differences if they were present. Statistical power is a function of sample size and the magnitude of the difference between groups judged to be mean ingful by the investigators. In the analyses of the YSR scales (involving 15 and 21 subjects in the ND and C/FSS groups, respectively), there was 80% power to detect group differences of 0.86 SD and 90% power to detect differences of 1.00 SD. For the parallel CBCL analyses (involving 15 and 31 sub jects), there was 80% power to detect differences of
0.78 SD and 90% power to detect differences of 0.90 SD between the groups. Both estimates assume a one-tailed 5% level test; that is, only differences for which the ND group had poorer functioning were considered important. In summary, given the power available, there is less than a 10% chance that any difference as large as 1 SD would have gone unde tected.
A notable exception to the pattern of more fa vorable scores in the ND group was observed on the EAT-26. In this case, the ND group received a total score more than twice that of the C/FSS control group (6.5 vs 3.0). The difference between the groups was not statistically significant, how ever, and the means for both groups fell far below the recommended cutoff score of 20,'@thereby sug gesting variability within the nonpathological range.
The impression of adaptive functioning for both groups that falls within the nonclinical range is corroborated by the parents' reports that only 8% and 4% of the ND and C/FSS groups, respectively, had received any type of mental health services during the year prior to the present hospital admis sion. These proportions compare favorably to the 14.5% and 7.8% of white males and females from a local school-based sample that had been referred for mental health services during the year prior to evaluation.22
The present findings, therefore, suggest the ex istence of an eating pattern during childhood and adolescence that compromises growth and, unlike the eating disorders, is not associated with evidence of psychopathology. Thus, ND diverges from an orexia nervosa not only in initial clinical presenta
S ND, nutritional dwarfing', C/FSS, constitutional growth
delay and/or familial short stature.
t Probability associated with analysis of covariance in which scores are adjusted for subject's age and sex; NS, statistically nonsignificant difference (ie, P > .10).
:1:
Rawscores
onlybecause
T scores
arenotcalculated
for
the School scale.'8
cutoff (ie, >90th percentile for the nonclinical standardization sample) on the nine narrow-band behavior syndrome scales of the CBCL (not shown in table; statistical comparison by x2). A compari son of CBCL scale scores for the ND and C/FSS groups with those of the nonclinical standardiza tion sample2°and locally collected norms for the checklist22 indicated functioning for both short stature groups that fell within the nonclinical range. Consistent with these reports, only 8% and 4% (a statistically nonsignificant difference) of the ND and C/FSS groups, respectively, had been re ferred for mental health services in the year prior to the assessment.
DISCUSSION
tion but also in response to treatment. We have observed clinically that catch-up growth can be achieved in the majority of cases in response to nutritional counseling alone.5 These encouraging findings notwithstanding, the weight gain of pa tients with ND should be monitored closely. A weakness of the present study is that it includes only a single psychosocial assessment conducted at the time of initial medical evaluation for poor growth. It remains possible that without appropri ate preventive intervention, a subgroup of ND pa tients will develop an eating disorder in the future.
In contrast to this study's findings, two previous reports (by a single group of investigators) of a condition resembling ND have suggested that the deficient eating habits were associated with a col lection of nonspecific behavioral symptoms and a disturbed mother-child relationship.23'24 The earlier studies differed from the present investigation in at least three important ways, any one of which could account for the apparent discrepant findings. First, the earlier studies used no subject-related exclusion criteria that might confound the inter pretation of the findings. Whereas any patient with significant intellectual impairment was excluded from the present study (see “¿SelectionCriteria,― above), one of the aforementioned studies24 in cluded 6 (of 36) subjects with IQs below 85. Subject IQs were not noted in the first study.@ Second, only one of the two previous studies used a control group for comparison and in that case it was selected from a city health department register.24 Whereas all of the children in their clinical group had heights below the third percentile for norms, the heights of children in the control group were not specified but were presumably average. Moreover, the control group was used only for analyses of caloric intake and was not used for a comparison of psychosocial functioning. In contrast, the short-stature control group patients in the present study were all derived from the files of the same pediatric endocrine serv ice as were the target subjects. Finally, the two earlier studies did not use standardized instruments to assess psychosocial functioning as was done in the present investigation.
We speculate that at least two influences might be at work in the development of ND: the first concerns current sociocultural trends regarding diet and weight. For example to lower the risk of chronic disease, the Surgeon General's report has urged the public to maintain an appropriate body weight and to reduce the intake of dietary fat.@ Whereas such recommendations, if appropriately applied, are proven to be beneficial for health, a misinterpreta tion of them during developmentally sensitive pe riods might be associated with retarded growth and
delayed puberty in children. Evidence of such a misapplication to infants of dietary health recom mendations designed for adults has recently been reported.26 In that study, parental beliefs concern ing what constitutes a healthy diet for infants was found to be associated with failure to thrive. Growth failure as a complication of dietary treatment of hypercholesterolemia also has been reported.27
Apart from adopting a specific diet to maintain health, there is considerable evidence in the litera ture to indicate that youth in American society are constantly being exposed to the message that thin ness is a praiseworthy attribute.ss Children and adolescents could succumb to such social pressures by modifying their diets in subtle ways. Whereas the reduced caloric intake among ND patients is consistent with such a hypothesis, the nearly unan imously expressed wish of these children to look heavier (as expressed through their selection of larger silhouettes) appears to rule out a pathological fear of gaining weight, as seen in patients with anorexia nervosa or bulimia nervosa, at least for this particular sample.
Our second line of speculation regarding etiology concerns the possibility that ND represents a feed ing disturbance which is physiologically rather than cognitively mediated. A vast experimental litera ture in animals attests to the fact that neurotrans mitters and hormones influence the type and quan tity of food eaten as well as the pattern in which it is consumed.@°There also is growing evidence that human feeding, including aberrant food consump tion, is influenced by similar physiological proc esses. For instance, patients with bulimia nervosa who have recurrent binge-eating episodes have been shown to have lower blood levels of cholecystokinin, a putative satiety factor in humans.3°It is plausible, based on the study ofpatients with bulimia nervosa, that individual ND patients may have elevated basal levels of cholecystokinin and/or show an ex aggerated cholecystokinin response to food. This effect would presumably result in a premature ter mination of a meal. Indeed, parents of ND patients often report that their children become sated early during the course of the meal. This hypothesis remains to be systematically explored.
entiating psychological features. mt J Eating Disord. 1990;9:357—362
13. Atkins DM, Silber TJ. Anorexia nervosa in preadolescent
youngsters. Presented at Fourth International Conference
on Eating Disorders; April 1990; New York, NY
14. Stabler B, Underwood LE. Slow Grows the Child: Psychoso
cial Aspects of Growth Delay. Hi!!sdale, NJ: Lawrence
Er!-baum Associates; 1986
15. Garner DM, O!mstead MP, Bohr Y, Garfinkel PE. The Eating Attitudes Test: psychometric features and clinical
correlates. Psychol Med. 1982;12:871—878
16. Harter S. Manualfor the Self-Perception Profilefor Children. Denver, CO: University of Denver; 1985
17. Maloney MJ, McGuire JB, Daniels SR. Reliability testing
of a children's version of the Eating Attitudes Test. J Am
Acad Child Adolesc Psychiatry. 1988;27:541-543
18. Harter S. Manual for the Self-Perception Profile for Adoles
cents. Denver, WA: University of Denver; 1988
19. Achenbach T, Edelbrock C. Manual for the Youth Self
Report and Profile. Burlington, VT: University of Vermont
Department of Psychiatry; 1987
20. Achenbach T, Edelbrock C. Manual for the Child Behavior
Checklist and Revised Child Behavior Profile. Burlington,
VT: University of Vermont Department of Psychiatry; 1983 21. National Center for Health Statistics. NCHS Growth
Curves for Children Birth-18 Years, United States. Vital
and Health Statistics. Washington, DC: United States Gov
ernment Printing Office; November 1977. Series 11, No. 165. Health Resources Administration
22. Sandberg DE, Meyer.Bahlburg HFL, Yager T. The Child Behavior Checklist nonclinical standardization samples: should they be utilized as norms? J Am Acad Child Adolesc
Psychiatry. 1991;30:124—134
23. Apley J, Davies J, Davis DR, Silk B. Dwarfism without apparent physical cause. Proc R Soc Med. 1971;64:135-138 24. Davis DR, Apley J, Fill G, Grimaldi C. Diet and retarded
growth. Br Med J. 1978;1:539—542
25. National Academy ofSciences. Diet and Health: Implications
for Reducing Chronic Disease Risk. Washington, DC: Na
tional Academy Press; 1989
26. Pugliese MT, Weyman-Daum M, Moses N, Lifshitz F. Pa rental health beliefs as a cause of nonorganic failure to thrive. Pediatrics. 1987;80:175—182
27. Lifshitz F, Moses N. Growth failure: a complication of
dietary treatment of hypercholesterolemia. AJDC. 1989; 143:537—542
28. Storz NS, Greene WH. Body weight, body image and per ception of fad diets in adolescent girls. J Nutr Educ.
1983;15:15—18
29. Blundell JE. Problems and processes underlying the control of food selection and nutrient intake. In: Wurtman BA, Wurtman JJ, eds. Nutrition and the Brain. New York, NY: Raven Press; 1983:163—221
30. Geracioti TD, Liddle BA. Impaired cholecystokinin secre tion in bulimia nervosa. N EngI J Med. 1988;319:683-688 31. Pugliese M, Recker B, Lifshitz F. A survey to determine the
prevalence of abnormal growth patterns in adolescence. J
Adolesc Health Care. 1988;9:181—187
improved understanding of the factors involved in the development of ND will serve to enhance the clinical management of these individuals and pos sibly to open new areas of research on the topic of feeding in humans.
ACKNOWLEDGMENTS
We thank Dr Cecilia Cervantes and other staff of the Division of Pediatric Endocrinology for facilitating the evaluation of patients in the metabolic unit of North Shore University Hospital-Cornell University Medical Center. Nancy Moses, MNS, was involved in the devel opment of the body silhouette test and in data collection during the early stages of the study. We are also grateful to Brian Cohen and the staff of the Division of Biostatis tics for data-analytic support as well as Helen Feit and Christine Lankevich for general assistance.
REFERENCES
1. Keller W, Fillmore CM. Prevalence of protein-energy ma!
nutrition. World Health Stat. Q. 1983;36:129—167 2. Jones DY, Nesheim MC, Habicht JP. Influences in child
growth associated with poverty in the 1970's: an examina tion of HANES I and HANES II, cross-sectional US na
tional surveys. Am J Clin Nutr. 1985;32:714—724
3. Crisp AH, Hsu L, Stonehill E. Personality, body weight and ultimate outcome in anorexia nervosa. J Clin Psychiatry. 1979;40:332—335
4. Lifshitz F, Moses N. Nutritional growth retardation. In: Lifshitz F, ed. Pediatric Endocrinology:A Clinical Guide. 2nd ed. New York, NY: Marcel Dekker, Inc; 1990:111—132 5. Lifshitz F, Moses N, Cervantes C. Nutritional dwarfing in
adolescents. Semin Adolesc Med. 1987;3:255—266 6. Powell GF. Failure to thrive. In: Lifshitz F, ed. Pediatric
Endocrinology: A Clinical Guide. 2nd ed. New York, NY:
Marcel Dekker, Inc; 1990:133—146
7. Drotar D. Failure to thrive. In: Routh DK, ed. Handbook of
Pediatric Psychology.New York, NY: Guilford; 1988:70-107 8. Pugliese MT, Lifshitz F, Grad G, Fort P, Marks-Katz M.
Fear of obesity: a cause ofshort stature and delayed puberty.
N EngI J Med. 1983;309:513-518
9. August GP, Lippe BM, Blethen SL, et a!. Growth hormone treatment in the United States: demographics and diagnos tic features of 2331 children. J Pediatr. 1990;116:899—903 10. Lesser LI, Ashenden BJ, Debuskey M, Eisenberg L. An
orexia nervosa in children. Am J Orthopsychiatry. 1960;30:572—580
11. Warren W. A study of anorexia nervosa in young girls. J
Child Psychol Psychiatry. 1968;9:27-40
1991;88;926
Pediatrics
Lifshitz
David E. Sandberg, Melanie M. Smith, Victor Fornari, Marjorie Goldstein and Fima
Nutritional Dwarfing: Is It a Consequence of Disturbed Psychosocial Functioning?
Services
Updated Information &
http://pediatrics.aappublications.org/content/88/5/926 including high resolution figures, can be found at:
Permissions & Licensing
http://www.aappublications.org/site/misc/Permissions.xhtml entirety can be found online at:
Information about reproducing this article in parts (figures, tables) or in its
Reprints
1991;88;926
Pediatrics
Lifshitz
David E. Sandberg, Melanie M. Smith, Victor Fornari, Marjorie Goldstein and Fima
Nutritional Dwarfing: Is It a Consequence of Disturbed Psychosocial Functioning?
http://pediatrics.aappublications.org/content/88/5/926
the World Wide Web at:
The online version of this article, along with updated information and services, is located on
American Academy of Pediatrics. All rights reserved. Print ISSN: 1073-0397.
![Commission staff working document PROGRESS TOWARDS THE LISBON OBJECTIVES IN EDUCATION AND TRAINING Indicators and benchmarks 2008 [publication based on document SEC (2008) 2293]](data:image/gif;base64,R0lGODlhAQABAIAAAP///wAAACH5BAEAAAAALAAAAAABAAEAAAICRAEAOw==)