2018 JINST 13 T02001
Published by IOP Publishing for Sissa MedialabReceived:November 21, 2017 Revised:January 23, 2018 Accepted:January 24, 2018 Published:February 6, 2018
TECHNICAL REPORT
Element-specific spectral imaging of multiple contrast
agents: a phantom study
R.K. Panta,a,b,1S.T. Bell,bJ.L. Healy,dR. Aamir,a,bC.J. Bateman,f M. Moghiseh,a
A.P.H. Butlera,b,c,eand N.G. Andersona
aDepartment of Radiology, University of Otago,
2 Riccarton Ave, Christchurch 8140, New Zealand
bMARS Bioimaging Ltd.,
29a Clyde Rd, Christchurch 8140, New Zealand
cDepartment of Physics and Astronomy, University of Canterbury,
Christchurch 8140, New Zealand
dDepartment of Biology, University of Canterbury,
Private Bag 4800, Christchurch 8140, New Zealand
eEuropean Centre for Nuclear Research (CERN), Geneva, Switzerland
fLincoln Agritech Limited, Engineering Drive, Lincoln University,
Christchurch 7460, New Zealand
E-mail: [email protected]
Abstract: This work demonstrates the feasibility of simultaneous discrimination of multiple con-trast agents based on their element-specific and energy-dependent X-ray attenuation properties using a pre-clinical photon-counting spectral CT. We used a photon-counting based pre-clinical spectral CT scanner with four energy thresholds to measure the X-ray attenuation properties of various concentrations of iodine (9, 18 and 36 mg/ml), gadolinium (2, 4 and 8 mg/ml) and gold (2, 4 and 8 mg/ml) based contrast agents, calcium chloride (140 and 280 mg/ml) and water. We evaluated the spectral imaging performances of different energy threshold schemes between 25 to 82 keV at 118 kVp, based on K-factor and signal-to-noise ratio and ranked them. K-factor was defined as the X-ray attenuation in the K-edge containing energy range divided by the X-ray attenuation in the preceding energy range, expressed as a percentage. We evaluated the effectiveness of the optimised energy selection to discriminate all three contrast agents in a phantom of 33 mm diameter. A photon-counting spectral CT using four energy thresholds of 27, 33, 49 and 81 keV at 118 kVp simultaneously discriminated three contrast agents based on iodine, gadolinium and gold at vari-ous concentrations using their K-edge and energy-dependent X-ray attenuation features in a single
2018 JINST 13 T02001
scan. A ranking method to evaluate spectral imaging performance enabled energy thresholds to be optimised to discriminate iodine, gadolinium and gold contrast agents in a single spectral CT scan. Simultaneous discrimination of multiple contrast agents in a single scan is likely to open up new possibilities of improving the accuracy of disease diagnosis by simultaneously imaging multiple bio-markers each labelled with a nano-contrast agent.
2018 JINST 13 T02001
Contents
1 Introduction 1
2 Materials and methods 2
2.1 Medipix based spectral CT imaging system: MARS scanner 2
2.2 Determination of scanning energy thresholds 3
2.3 A multi-contrast phantom 6
2.4 Spectral imaging 6
2.5 Material decomposition 8
3 Results 8
3.1 Evaluation of spectral imaging performance 8
3.2 Discrimination of multiple K-edges 9
3.3 Material decomposition 9
4 Discussion 10
1 Introduction
The ability to identify disease processes at the cellular or molecular level for diagnosis and treatment remains a central goal for pre-clinical or clinical research. Because of the unique physical and chemical properties of metallic nanoparticles, they are increasingly being used as targeted X-ray
contrast agents to yield functional information at the cellular level using computed tomography [1–
7]. Nano-sized X-ray contrast agents can deliver a large number of heavy atoms to a targeted region
of interest to increase the X-ray attenuation and sensitivity of X-ray detection. Spectral imaging, integrated with nanoparticle X-ray contrast agents and various active targeting strategies (also known as spectral molecular imaging) has shown great promise toward providing quantitative information
in studies of the dynamics of biological processes and disease within a cell or tissue [6,8–12]. For
example, tracking the cellin vivo[13] or detecting the macrophage content in an atherosclerotic
plaque [14] or monitoring drug delivery [15]. The ability to quantify and visualize molecular
biomarkers of a disease will enable tracking of the progression or regression of disease and aid in refining personalized treatment strategies.
Many biological processes require simultaneous non-invasive identification and measurement of their components. Different cells and biomarkers have X-ray attenuation properties so simi-lar that they are intrinsically indistinguishable from each other. Biomarkers can be labelled with different nano-contrast agents at biologically relevant concentrations to enhance their differentia-tion in-situ. Spectral imaging sampling X-ray data from multiple X-ray energy ranges measures the energy-dependent X-ray attenuation properties that allows discrimination and quantification
2018 JINST 13 T02001
mechanism of X-ray photons within diagnostic imaging energy range 30–120 keV and it is approx-imately proportional to the third (or fourth) power of the atomic number. The presence of high-Z nano-contrast agents can facilitate detection of biomarkers at low concentration typically present in biological processes.
Material discrimination in spectral imaging is further enhanced by the presence of discontinuity in the cross section of the photo-electric effect of high-Z contrast agents. This discontinuity in the photo-electric cross section is called the K-edge. The K-edge feature is characteristic of an element that occurs when the energy of incident X-ray photons matches to the binding energy of K-shell electrons in an atom. None of the elements that naturally occur in a human body have a K-edge that is accessible in the relevant diagnostic energy range. Exogenous high-Z contrast agents which show distinct K-edge feature within the diagnostic energy range can be used to unambiguously
and specifically quantify elements within a biological specimen [18–21]. Spectral imaging with
multiple energy thresholds (minimum of two thresholds are required to capture the K-edge feature of an element) allows capturing the K-edge features of several elements simultaneously.
The potential of spectral imaging to discriminate and quantify multiple nano-contrast agents [11,
22,23] within an image voxel allows targeting of multiple bio-markers simultaneously and gives an
opportunity for more sophisticated tissue characterisation. Detecting only a single tumor marker is usually inadequate for an accurate diagnosis of cancer since most are not specific to a particular
tumor [24]. To improve the accuracy of cancer diagnosis, it is necessary to combine testing of
mul-tiple tumor markers as it could improve the diagnostic specificity [25,26]. For example, detecting
multiple tumor bio-markers at an early stage in the clinical course facilitates diagnosis of cancer
and treatment monitoring [27,28], which in turn significantly improves the treatment efficiency and
survival rates [29,30].
In this paper, we demonstrate the feasibility of simultaneous discrimination of various concen-trations of iodine (I), gadolinium (Gd) and gold (Au) based contrast agents, using their element-specific and energy-dependent X-ray attenuation properties. We present a methodology to determine the appropriate scanning energy thresholds in an energy-resolving photon-counting detector based spectral CT. Four energy thresholds are used to measure the X-ray attenuation on either side of K-edge features of I, Gd and Au. Optimal selection of scanning energy thresholds is needed to balance the trade-off between energy information and signal-to-noise ratio (a measure that compares the level of a desired signal to the level of background noise in the measurement). We introduce a ranking method to evaluate the energy information and SNR at various scanning energy thresholds. Then we select high ranked energy threshold schemes to demonstrate the feasibility of element-specific spectral imaging for simultaneous discrimination of I, Gd and Au based contrast agents in a single scan.
2 Materials and methods
2.1 Medipix based spectral CT imaging system: MARS scanner
A MARS scanner (Mars BioImaging Ltd, Christchurch, New Zealand) [31–33] is a pre-clinical
spectral imaging system, comprised of a MARS camera [34–37], a micro-focus X-ray source
2018 JINST 13 T02001
source used for this study has a tungsten anode, total filtration of 3.8 mm aluminium (equivalent)
and focal spot of≈50 µm.
For this study, we used a MARS camera fitted with a detector module incorporating a
Medipix3RX ASIC [38] bump-bonded to a standard high resistivity 2 mm thick CdTe sensor.
The sensitive area of each chip was 1.408×1.408cm2, which is subdivided into a 128×128 array
of pixels with a pitch of 110 µm. The CdTe sensor layer was configured as a pn-junction diode
supplied with a negative high-voltage bias (-600 V) for collection of electrons. The counter depth of 12-bit provides a dynamic range of 0–4095 counts per pixel.
In X-ray detectors with small pixels (<500 µm), the charge collected from a single photon
interaction is spread across several neighbouring pixels. This effect is known as the charge sharing effect. The Medipix3RX chip implements a charge summing circuit to correct for the charge sharing
effect by processing the charge collected by the pixel matrix using a 2×2 pixel substructure with
inter-pixel communication. This correction preserves both the spatial and spectral information of individual photons. Further details of working of Charge Summing Mode (CSM) in Medipix3RX
can be found elsewhere [38].
The CdTe-Medipix3RX is a high-Z sensor based energy-resolving detector which has four spectrum-distortion corrected energy thresholds per pixel. Physically, the energy thresholds are realised by setting the reference threshold of the pulse-height comparator circuit of all pixels in the matrix. The pulse height obtained from the interaction of an X-ray photon with the sensor is proportional to the energy of the detected photon. The relationship between the measured photon energy and the applied energy thresholds (energy calibration) for the energy-resolving detector used
in this paper was established according to Panta et al. [37].
2.2 Determination of scanning energy thresholds
Discrimination of elements in an object using photon-counting spectral CT requires judicious selection of energy thresholds. This is due to the trade-off between energy-dependent information and signal-to-noise ratio (SNR) within an energy range. A narrow energy range preserves the energy-dependent information, such as K-edge feature of an element, whereas in a wide energy range, the K-edge feature is washed out due to data averaging. Conversely, SNR in an image is greater for a wider energy range. This contradictory requirement of energy information and SNR needs to be taken into account when selecting the width of energy ranges.
A commonly used technique [41] to select the appropriate width of energy range for measuring
the K-edge feature of an element is based on signal difference to noise ratio (SDNR) where the signal difference is defined between reconstructed target region values on either side of the K-edge feature. The limitation of this technique is that it has only been studied using an ideal detector within simulation framework. In practice, the subtraction of reconstructed images amplifies the noise in the resultant image which adversely affects the energy information.
In this study, we have introduced the “K-factor” as an indicator of energy information provided by the K-edge of an element:
K-factor= X-ray attenuation at K-edge-containing energy range
X-ray attenuation at preceeding energy range ×100% (2.1)
In contrast to the SDNR measurement technique [41], the K-factor method reduces the
2018 JINST 13 T02001
Energy (keV)
20
40
60
80
100
120
Mass attenuation coefficient (cm
2 /g)
10
30
50
X-ray intensity (N[keV cm
2 mAs] -1 at 1 m
×106
0 1.2 3.6 6
gadolinium
gold iodine
X-ray source spectrum
Figure 1. X-ray mass attenuation profiles [39] for iodine, gadolinium and gold with corresponding K-edge at 33.2 keV, 50.2 keV and 80.7 keV respectively, and X-ray emission spectrum [40] obtained from an X-ray tube operating at 118 kVp. The choice of energy thresholds for K-edge imaging is the trade-off between energy information (depends on mass attenuation profiles) and signal-to-noise ratio (depends on X-ray source spectrum).
K-edge feature. A higher K-factor implies that higher energy information has been preserved by reducing the wash out effect on the K-edge feature. The higher the K-factor, the better the energy (spectroscopic) information. Similarly, the higher the intensity of X-ray photons (X-ray intensity is defined as total number of photons/area/time) in an energy range, the better the SNR of an image
in that energy range while using the same spectrum (or radiation dose). Figure1shows the X-ray
spectrum (120 kVp and 3.8 mm Al thickness), and mass attenuation coefficient of I, Gd and Au as a function of photon energy. K-edges of I, Gd and Au are apparent at 33.2, 50.2 and 80.7 keV
respec-tively. The X-ray spectrum was generated using SpekCalc program [42] and the mass attenuation
coefficient of I, Gd and Au were generated using Photon Cross sections Database [43].
The spectral camera in a MARS scanner uses a CdTe-Medipix3RX detector [38] which has
four adjustable energy thresholds for correcting spectrum-distortion on each individual pixel. These four energy thresholds need to be selected judiciously on either side of the K-edges of I, Gd and
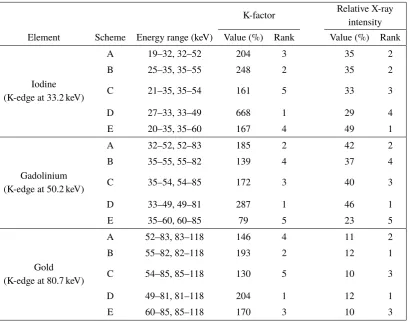
Au for capturing them on spectral scan. Table1shows examples of five different possible energy
threshold schemes for each element and the trade-off between energy information (K-factor) and
relative X-ray intensity (X-ray intensity in a particular energy range ×100%/ X-ray intensity in
all energy ranges or entire X-ray spectrum). The higher the relative X-ray intensity, the higher the quantum signal-to-noise ratio. For example, in Scheme D for iodine, the selection of energy ranges of 27–33 keV and 33–49 keV provides a maximum K-factor (668 %), however, relative X-ray intensity (29 %) in K-edge containing energy range (33–49) is the poorest among five schemes. Based on K-factor and relative X-ray intensity in the K-edge containing energy range, a rank was
2018 JINST 13 T02001
Table 1. Determination of ranks for various potential combination of energy thresholds based on K-factor and relative X-ray intensity performance in K-edge containing energy range for I, Gd and Au based contrast agents.
K-factor Relative X-ray
intensity Element Scheme Energy range (keV) Value (%) Rank Value (%) Rank
A 19–32, 32–52 204 3 35 2
B 25–35, 35–55 248 2 35 2
Iodine
(K-edge at 33.2 keV) C 21–35, 35–54 161 5 33 3
D 27–33, 33–49 668 1 29 4
E 20–35, 35–60 167 4 49 1
A 32–52, 52–83 185 2 42 2
B 35–55, 55–82 139 4 37 4
Gadolinium
(K-edge at 50.2 keV) C 35–54, 54–85 172 3 40 3
D 33–49, 49–81 287 1 46 1
E 35–60, 60–85 79 5 23 5
A 52–83, 83–118 146 4 11 2
B 55–82, 82–118 193 2 12 1
Gold
(K-edge at 80.7 keV) C 54–85, 85–118 130 5 10 3
D 49–81, 81–118 204 1 12 1
E 60–85, 85–118 170 3 10 3
Table 2. Determination of best energy threshold scheme for simultaneously discriminating the K-edge features of I, Gd and Au based on ranking. Overall rank for various schemes of energy thresholds was determined based on K-factor and relative X-ray intensity performance as shown in table 1. Top two rated schemes (Scheme B and Scheme D) are selected for evaluating their spectral imaging performance to discriminate all three contrast agents (I, Gd and Au) simultaneously.
Scheme Energy range (keV) Overall rank
A 19–32, 32–52, 52–83, 83–118 2
B 25–35, 35–55, 55–82, 82–118 2
C 21–35, 35–54, 54–85, 85–118 4
D 27–33, 33–49, 49–81, 81–118 1
E 20–35, 35–60, 60–85, 85–118 3
Based on the combination of individual rank of each scheme for all elements (I, Gd and Au),
an overall rank was determined as shown in table 2. For example, Scheme D has the highest
2018 JINST 13 T02001
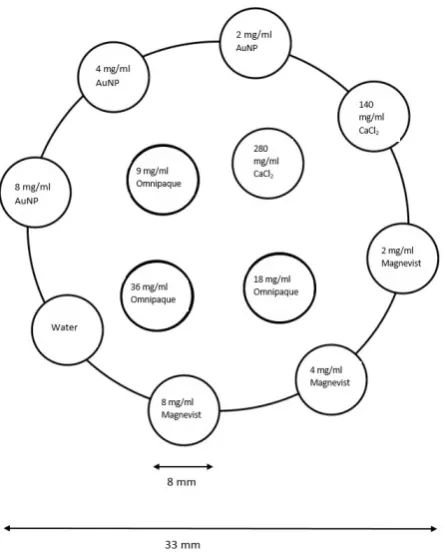
Figure 2. A schematic of multi-contrast phantom filled with various concentrations of Omnipaque (iodine based), Magnevist (gadolinium based) and gold nano-particle (AuNP) contrast agents, water and calcium chloride solutions (Not to scale).
For evaluating the spectral imaging performance of top two ranked energy threshold schemes
(Scheme B and Scheme D in table1) in simultaneous discrimination of the K-edge features of I, Gd
and Au, spectral imaging of a multi-contrast phantom was performed.
2.3 A multi-contrast phantom
A multi-contrast phantom (diameter of 33 mm) was fabricated for performing element-specific spectral imaging. Using commercially available iodine-based Iohexol (Omnipaque, GE Health-care, Princeton, NJ), gadolinium-based gadopentate dimeglumine (Magnevist, Bayer HealthHealth-care, Whippany, NJ) and 2nm gold nanoparticles (Aurovist, Nanoprobes, Yaphank, NY) contrast agents, multiple inserts (diameter of 8 mm) were filled with various concentrations of iodine (9, 18 & 36 mg/ml), gadolinium (2, 4 & 8 mg/ml) and gold (2, 4 & 8 mg/ml) based contrast agents, and calcium-chloride (140 & 280 mg/ml) as a surrogate of bone, and water as a surrogate of soft tissue.
A schematic of multi-contrast phantom is shown in figure2.
2.4 Spectral imaging
Spectral CT images of a multi-contrast phantom were acquired using a MARS scanner equipped with an energy-resolving detector (CdTe-Medipix3RX). The settings used for spectral imaging are
summarised in table1. The X-ray tube was operated at 118 kVp and the detector was operated in
2018 JINST 13 T02001
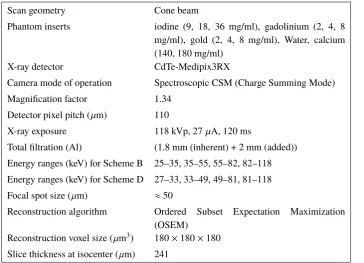
Table 3. Technical settings for spectral CT scan.
Scan geometry Cone beam
Phantom inserts iodine (9, 18, 36 mg/ml), gadolinium (2, 4, 8 mg/ml), gold (2, 4, 8 mg/ml), Water, calcium (140, 180 mg/ml)
X-ray detector CdTe-Medipix3RX
Camera mode of operation Spectroscopic CSM (Charge Summing Mode)
Magnification factor 1.34
Detector pixel pitch (µm) 110
X-ray exposure 118 kVp, 27µA, 120 ms
Total filtration (Al) (1.8 mm (inherent) + 2 mm (added)) Energy ranges (keV) for Scheme B 25–35, 35–55, 55–82, 82–118 Energy ranges (keV) for Scheme D 27–33, 33–49, 49–81, 81–118 Focal spot size (µm) ≈50
Reconstruction algorithm Ordered Subset Expectation Maximization (OSEM)
Reconstruction voxel size (µm3) 180×180×180 Slice thickness at isocenter (µm) 241
were acquired before and after scanning the multi-contrast phantom. Spectrally resolved images determined by the chosen scheme, were collected simultaneously.
The projection data in each energy range was flat field corrected, processed, and reconstructed simultaneously using Ordered Subset Expectation Maximization (OSEM) technique with voxel
dimensions of 180×180×180µm3. The slice thickness at isocenter was 241µm.
Spectral imaging performance of the two highest ranked schemes (Scheme B and Scheme D in
table3) were evaluated by comparing the energy information (K-factor) and QSNR for each element
individually. Mass attenuation coefficient for each high-Z element was calculated for estimating the K-factor of both schemes. Flat field images (720 images in total) for each scheme were averaged to calculate the SNR at K-edge-containing energy ranges for each element individually.
For further data analysis, voxel values (absolute X-ray attenuation or linear attenuation
co-efficient (cm−1) of the reconstructed CT image were transformed to relative X-ray attenuation in
Hounsfield Units (HU) using equation2.2:
HUvoxel =
µvoxel−µwater
µwater− µair
×1000 (2.2)
where HUvoxelis the HU of the voxel, theµvoxel,µwater,µairare linear attenuation coefficient of the
voxel, water and air in the reconstructed image, respectively.
For the measurement of the relative X-ray attenuation (HU) of different regions of interest
(ROIs) containing contrast agents, the mean value and standard deviation (σ) within a circular ROI
comprising≈300 voxels (N) were measured. The standard error of X-ray attenuation was calculated
as √σ
2018 JINST 13 T02001
2.5 Material decomposition
Material decomposition (MD) algorithm in spectral CT exploits the energy dependence of X-ray attenuation of each voxel inside the object from multiple energy ranges to determine the basis materials in the reconstructed material volume. Material decomposition based on the MARS
constrained linear least square algorithm [44] was used on reconstructed images using the subtracted
energy ranges. MARS MD algorithm splits the total attenuation coefficient into the individual X-ray attenuation of several predefined basis materials for a given energy. Based on the pattern of X-ray attenuation of various materials at multiple energy ranges, MD assigns the voxel to the corresponding material. Thus MD algorithm generates the basis material image on a voxel-by-voxel basis.
3 Results
3.1 Evaluation of spectral imaging performance
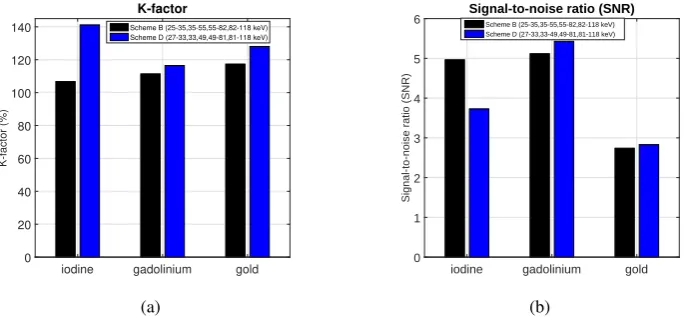
K-factor and SNR were used as metrics to compare the spectral imaging performance at different
scanning energy thresholds. Figure3(a) shows that K-factor of Scheme D (energy range: 27–33,
33–49, 49–81 and 81–118 keV) is higher than that of Scheme B (energy range: 25–35, 35–55,
55–82 and 82–118 keV) for all three elements (I, Gd ad Au). Similarly, figure 3(b) shows that
SNR of Scheme D is slightly higher than that of Scheme B for K-edge containing energy ranges of gadolinium and gold, but lower for iodine. The spectral imaging performance of both schemes is
consistent qualitatively with theoretical spectral imaging performance as presented in table2. This
shows that spectral imaging performance of Scheme D is marginally better than Scheme B. Further data analysis comprises only the spectral data acquired using Scheme D.
iodine gadolinium gold
K-factor (%)
0 20 40 60 80 100 120 140
K-factor
Scheme B (25-35,35-55,55-82,82-118 keV) Scheme D (27-33,33,49,49-81,81-118 keV)
(a)
iodine gadolinium gold
Signal-to-noise ratio (SNR)
0 1 2 3 4 5
6 Signal-to-noise ratio (SNR)Scheme B (25-35,35-55,55-82,82-118 keV) Scheme D (27-33,33-49,49-81,81-118 keV)
(b)
2018 JINST 13 T02001
-1000 -500 0 500 1000 1500 2000 2500
HU
49-81 keV
81-118 keV
27-33 keV
33-49 keV
Figure 4. Spectral CT images of multi-contrast phantom containing iodine (9, 18 & 36 mg/ml), gadolinium (2, 4 & 8 mg/ml) and gold (2, 4 & 8 mg/ml) based contrast agents, and bone-like material (calcium-chloride of 140 & 280 mg/ml), and soft tissue-like (water) material at different energy ranges. X-ray attenuation values of each voxel is shown in Hounsfield Unit (HU).
3.2 Discrimination of multiple K-edges
Spectral CT images acquired using Scheme D are shown in figure4. The images acquired in four
distinct energy ranges are shown. The spectral CT images of multi-contrast phantom including iodine (9, 18 & 36 mg/ml), gadolinium (2, 4 & 8 mg/ml) and gold (2, 4 & 8 mg/ml) based contrast agents, and calcium-chloride (140 & 280 mg/ml) as surrogate for bone, and water as surrogate
for soft tissue are shown in figure 4. Each CT image in each energy range possesses unique
energy-dependent X-ray attenuation values. The presence of ring artifacts is visible, these are due to inconsistency of signal collection in some pixels during scanning.
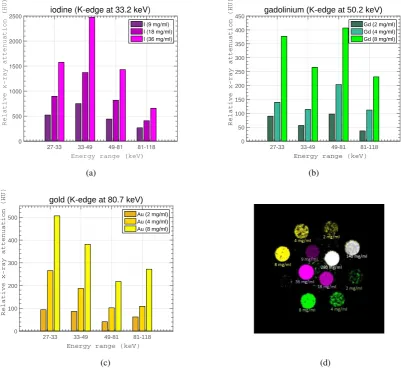
The performance of the imaging scheme was assessed for different concentrations of each
contrast agent. Figures5(a)–5(c)present the mean values of relative X-ray attenuation (HU) within
different concentrations of I, Gd and Au contrast agents. The mean values were calculated over≈300
voxels in each ROI. The standard error of X-ray attenuation within different ROIs was±7–35 HU.
X-ray attenuation of all contrast agents at all concentrations is maximal for the K-edge-containing energy range, in which the attenuation is greater than that in the preceding and succeeding energy range. X-ray attenuation is maximum for all concentrations of iodine, gadolinium and gold at 33–49 keV, 49–81 keV and 81–118 keV respectively. This is because of the K-edge effect of the corresponding element. The maximum K-factors for I, Gd and Au were 157 %, 153 % and 125 % respectively. These results show that each of the K-edges for I, Gd and Au based contrast agents can be discriminated using spectral CT.
3.3 Material decomposition
2018 JINST 13 T02001
Energy range (keV) 27-33 33-49 49-81 81-118
Relative x-ray attenuation (HU)
0 500 1000 1500 2000
2500 iodine (K-edge at 33.2 keV) I (9 mg/ml) I (18 mg/ml) I (36 mg/ml)
(a)
Energy range (keV) 27-33 33-49 49-81 81-118
Relative x-ray attenuation (HU)
0 50 100 150 200 250 300 350 400 450
gadolinium (K-edge at 50.2 keV)
Gd (2 mg/ml) Gd (4 mg/ml) Gd (8 mg/ml)
(b)
Energy range (keV) 27-33 33-49 49-81 81-118
Relative x-ray attenuation (HU)
0 100 200 300 400 500
gold (K-edge at 80.7 keV)
Au (2 mg/ml) Au (4 mg/ml) Au (8 mg/ml)
(c) (d)
Figure 5. (a) Relative X-ray attenuation of various concentrations of iodine based contrast agent showing K-edge enhancement at 33–49 keV (b) Relative X-ray attenuation of various concentrations of gadolinium based contrast agent showing K-edge enhancement at 49–81 keV (c) Relative X-ray attenuation of various concentrations of gold based contrast agent showing K-edge enhancement at 81–118 keV. The standard error in the measurement of relative X-ray attenuation of various concentrations of contrast agents is±7–35 HU. (d) Material decomposed basis image based on MARS constrained linear least square algorithm to differentiate water, iodine, gadolinium, gold and calcium contrast agents. The material decomposed image is based on the same energy range selection as in5(a)–5(c). Purple: iodine at 9, 18, 36 mg/ml; green: gadolinium at 2, 4, 8 mg/ml; yellow: gold at 2, 4, 8 mg/ml and White: calcium at 140, 180 mg/ml.
materials (water, I, Gd, Au, Ca). Figure5(d) shows the basis image which decomposes: water,
iodine, gadolinium, gold and calcium based contrast agents based on their energy-dependent X-ray attenuation properties. A different false color was assigned to each of the decomposed materials. The higher the concentration of materials, the brighter the color display.
4 Discussion
2018 JINST 13 T02001
imaging. If spectral imaging is integrated with targeting of biomarkers, simultaneous functional and anatomical tomographic images in a single scan, that is quantitative molecular imaging, becomes possible. In this paper, we demonstrated simultaneous discrimination of element-specific K-edge features and energy-dependent X-ray attenuation features of commercially available I, Gd and Au based contrast agents in a single scan. We developed a ranking methodology to determine the appropriate scanning energy thresholds in an energy resolving detector by balancing the trade-off between energy information and signal-to-noise ratio.
Near-term applications of element-specific spectral imaging of high-Z contrast agents could
be inin-vivomolecular imaging of atherosclerosis or cancer in a mouse model. The importance of
discriminating multiple K-edge features lies in the possibility to simultaneously identify and locate the disease (by using specific functionalised nano-particles to target the bio-markers of a disease), the immune response using nano-particles specific to the immune cell (e.g. macrophages), and drug delivery in a single scan. Furthermore, the ability to discriminate more than one high-Z contrast agent may have clinical relevance in simultaneous selective enhancement of different regions. For example, the entire cardio-vascular system might be enhanced with a blood-pool contrast agent while atherosclerotic plaques might be identified with a different high-Z material nanoparticle targeted to biomarkers of atherosclerotic lesions like the necrotic lipid core or intraplaque hemorrhage.
Simultaneous imaging of multiple biomarkersin vivohas been achieved using quantum dots [24,
45], a new form of fluorescent label. There are many nanoparticle cancer therapies approved for
clinical use [46]. Translating metal nano-contrast agents toin vivoclinical applications whether as
purely diagnostic agents or combined with therapy (theranostic agents) is a difficult task and fraught
with regulatory hurdles. There are many nanoparticle cancer therapies approved for clinical use [46].
At least three metal nanomedicines have completed clinical trials [47] and iron, silica and gold based
nanoparticles are undergoing clinical trials [46]. Gold is the most extensively studied nanocontrast
agent [48] but many more metal based nanocontrast agents are being investigated including bismuth,
platinum, hafnium, yytterbium, tantulum, and yttrium [11]. An effort to combine functionality in
nanoparticles has been pursued by some in part because of the difficulty in getting nanocontrast agents approved. This approach has led to the development of nanoparticles with combinations of iron, gold, fluorophores, radiotracers, gadolinium, manganese are suitable for multimodal imaging
by combinations of MR, CT, PET, SPECT, ultrasound and optical imaging [49–51].
2018 JINST 13 T02001
The key property of a contrast agent that determines the magnitude of X-ray attenuation is the atomic number (Z). The higher the Z of a contrast agent, the greater the X-ray attenuation. The greater the differential attenuation, the easier to separate the contrast agent from other materials including other contrast agents. Three high-Z elements used in this study are: iodine (Z = 53), gadolinium (Z = 64) and gold (Z = 79). A contrast agent should ideally have high X-ray attenuation at low concentrations, sufficient to enhance image contrast within the imaging energy range. Since the K-edge of iodine (at 33.2 keV where X-ray attenuation increases abruptly) lies near to the lower energy border of the human diagnostic energy range, iodine is not an ideal contrast agent for human imaging because of photon starvation (causes poor signal-to-noise ratio) at the K-edge region. Similarly, relatively few photons are produced by X-ray sources used in human CT above the 80.7 keV K-edge of gold, which reduces the sensitivity of K-edge discrimination. On the other hand, human CT has a relative abundance of photons above the Gadolinium K-edge of 50.2 keV which increases the sensitivity of K-edge discrimination.
The K-edge discrimination using a spectral imaging system also depends on many parameters such as spectral characteristics and noise performance of an energy resolving detector, scattered radiation on the measured X-ray spectrum, atomic number of sensor materials, size of the sample, and X-ray tube settings and filtration. To provide sufficient sensitivity at the molecular level, these factors need to be taken into account.
Summary and conclusion. We demonstrated the feasibility of simultaneous discrimination of
multiple contrast agents by exploiting their element-specific (K-edges) and energy-dependent X-ray attenuation properties in a single scan using a pre-clinical photon-counting spectral CT (MARS scanner). A ranking methodology for selecting appropriate scanning energy thresholds in an energy resolving detector was developed and used to measure the K-edge features of various concentrations of iodine, gadolinium and gold based contrast agents. The ability to simultaneously discriminate multiple contrast agents at the concentrations relevant to biomedical application is likely to open up new possibilities for imaging multiple functional processes in a single scan.
Acknowledgments
The authors would like to acknowledge Medipix2 and Medipix3 collaborations.
References
[1] O. Rabin et al.,An X-ray computed tomography imaging agent based on long-circulating bismuth sulphide nanoparticles,Nature Mater.5(2006) 118.
[2] J. F. Hainfeld et al.,Gold nanoparticles: a new x-ray contrast agent,Brit. J. Radiol.79(2006) 248. [3] Q.Y.K. Cai et al.,Colloidal gold nanoparticles as a blood-pool contrast agent for X-ray computed
tomography in mice,Invest. Radiol.42(2007) 797.
[4] D. Kim et al.,Antibiofouling polymer-coated gold nanoparticles as a contrast agent for in vivo X-ray computed tomography imaging,J. Amer. Chem. Soc.129(2007) 7661.
2018 JINST 13 T02001
[6] R. Popovtzer et al.,Targeted gold nanoparticles enable molecular CT imaging of cancer,Nano Lett.8(2008) 4593.
[7] D.P. Cormode and Z.A. Fayad,Nanoparticle contrast agents for CT: their potential and the challenges that lie ahead,Imag. Med.3(2011) 263.
[8] S. Mukundan et al.,A liposomal nanoscale contrast agent for preclincal microct imaging of the mouse,Amer. J. Roentgenol.186(2006) 300.
[9] P. Baturin, Y. Alivov and S. Molloi,Spectral CT imaging of vulnerable plaque with two independent biomarkers,Phys. Med. Biol.57(2012) 4117.
[10] N.G. Anderson et al.,Spectroscopic (multi-energy) CT distinguishes iodine and barium contrast material in mice,Eur. Radiol.20(2010) 2126.
[11] N.G. Anderson and A.P. Butler,Clinical applications of spectral molecular imaging: potential and challenges,Contrast Media Mol. Imag.9(2014) 3.
[12] A. Pourmorteza et al.,Abdominal imaging with contrast-enhanced photon-counting CT: first human experience,Radiolology279(2016) 239.
[13] D.R. Arifin et al.,Trimodal gadolinium-gold microcapsules containing pancreatic islet cells restore normoglycemia in diabetic mice and can be tracked by using US, CT, and positive-contrast MR imaging,Radiology260(2011) 790.
[14] D.P. Cormode et al.,Atherosclerotic plaque composition: Analysis with multicolor CT and targeted gold nanoparticles,Radiology256(2010) 774.
[15] J.K. Willmann et al.,Molecular imaging in drug development,Nat. Rev. Drug Discov.7(2008) 591. [16] R.E. Alvarez and A. Macovski,Energy-selective reconstructions in x-ray computerised tomography,
Phys. Med. Biol.21(1976) 733.
[17] D. Arvin, A. Macovski and L. Zatz,Clinical application of compton and photo-electric reconstruction in computed tomography: preliminary results,Invest. Radiol.21(1978) 733 . [18] S. Feuerlein et al.,Multienergy photon-counting K-edge imaging: potential for improved luminal
depiction in vascular imaging,Radiology249(2008) 1010.
[19] J.P. Schlomka et al.,Experimental feasibility of multi-energy photon-counting K-edge imaging in pre-clinical computed tomography,Phys. Med. Biol.53(2008) 4031.
[20] W.C. Barber et al.,Energy dispersive CdTe and CdZnTe detectors for spectral clinical CT and NDT applications,Nucl. Instrum. Meth.A 784(2015) 531.
[21] C.K. Egan et al.,3D chemical imaging in the laboratory by hyperspectral X-ray computed tomography,Sci. Rept.5(2015) 15979.
[22] D.P. Cormode, P.C. Naha and Z.A. Fayad,Nanoparticle contrast agents for computed tomography: a focus on micelles,Contrast Media Mol. Imag.9(2014) 37.
[23] I. Danad et al.,New applications of cardiac computed tomography: dual-energy, spectral, and molecular CT imaging,JACC-Cardiovasc. Imag.8(2015) 710.
[24] C. Wang, F. Hou and Y. Ma,Simultaneous quantitative detection of multiple tumor markers with a rapid and sensitive multicolor quantum dots based immunochromatographic test strip,Biosens. Bioelectron.68(2015) 156.
[25] I. Visintin et al.,Diagnostic markers for early detection of ovarian cancer,Clinical Cancer Res.14
2018 JINST 13 T02001
[26] J.F. Rusling,Multiplexed electrochemical protein detection and translation to personalized cancerdiagnostics,Anal. Chem.85(2013) 5304.
[27] R.M. Nagler et al.,Early diagnosis and treatment monitoring roles of tumor markers Cyfra 21-1 and TPS in oral squamous cell carcinoma,Cancer85(1999) 1018.
[28] M.J. Duffy et al.,Clinical utility of biochemical markers in colorectal cancer: European Group on Tumour Markers (EGTM) guidelines,Eur. J. Cancer39(2003) 718.
[29] B.J. McMahon et al.,Screening for hepatocellular carcinoma in Alaska natives infected with chronic hepatitis B: a 16-year population-based study,Hepatology32(2000) 842.
[30] K. Pantel, R.H. Brakenhoff and B. Brandt,Detection, clinical relevance and specific biological properties of disseminating tumour cells,Nature Rev. Cancer8(2008) 329.
[31] A. Butler et al.,Bio-medical X-ray imaging with spectroscopic pixel detectors,Nucl. Instrum. Meth.A 591(2008) 141.
[32] A.P.H. Butler et al.,Processing of spectral X-ray data using principal components analysis,Nucl. Instrum. Meth.633(2011) S140.
[33] M.F. Walsh et al.,First CT using Medipix3 and the MARS-CT-3 spectral scanner,2011JINST 6
C01095.
[34] R.M. Doesburg,The MARS photon processing cameras for spectral CT, Ph.D. Thesis, University of Canterbury, Canterbury, U.K. (2012).
[35] M.F. Walsh,Spectral CT development, Ph.D. thesis, University of Otago, Christchurch, New Zealand (2013).
[36] J.P. Ronaldson et al.,Characterization of Medipix3 with the MARS readout and software,2011JINST
6C01056.
[37] R. Panta et al.,Energy calibration of the pixels of spectral X-ray detectors,IEEE Trans. Med. Imag.
34(2015) 697.
[38] R. Ballabriga et al.,The Medipix3RX: a high resolution, zero dead-time pixel detector readout chip allowing spectroscopic imaging,2013JINST8C02016.
[39] M. Berger et al.,XCOM: photon cross sections database,NIST Standard Reference Database 8 (XGAM)(1998).
[40] G.G. Poludniowski and P.M. Evans,Calculation of X-ray spectra emerging from an X-ray tube. Part I: electron penetration characteristics in X-ray targets,Med. Phys.34(2007) 2164.
[41] P. He et al.,Optimization of k-edge imaging with spectral CT,Med. Phys.39(2012) 6572.
[42] G. Poludniowski et al.,SpekCalc: a program to calculate photon spectra from tungsten anode X-ray tubes,Phys. Med. Biol.54(2009) N433.
[43] M.J. Berger et al.,XCOM: photon cross sections database,NIST Standard Reference Database 8 (XGAM)(2010).
[44] C. Bateman,Methods for Material Discrimination in MARS Multi-energy CT, Ph.D. thesis, University of Otago, Christchurch, New Zealand (2015).
[45] B.A. Kairdolf et al.,Semiconductor quantum dots for bioimaging and biodiagnostic applications, Annu. Rev. Anal. Chem.6(2013) 143.
2018 JINST 13 T02001
[47] L. Bregoli et al.,Nanomedicine applied to translational oncology: a future perspective on cancertreatment,Nanomed. Nanotechnol.12(2016) 81.
[48] L.E. Cole et al.,Gold nanoparticles as contrast agents in X-ray imaging and computed tomography, Nanomedicine10(2015) 321.
[49] G. Bao, S. Mitragotri and S. Tong,Multifunctional nanoparticles for drug delivery and molecular imaging,Annu. Rev. Biomed. Engineer.15(2013) 253.
[50] S. Kunjachan et al.,Noninvasive imaging of nanomedicines and nanotheranostics: principles, progress, and prospects,Chem. Rev.115(2015) 10907.
[51] M. Nahrendorf et al.,Hybrid PET-optical imaging using targeted probes,Proc. Natl. Acad. Sci. U.S.A.
![Figure 1. X-ray mass attenuation profiles [39] for iodine, gadolinium and gold with corresponding K-edgeat 33.2 keV, 50.2 keV and 80.7 keV respectively, and X-ray emission spectrum [40] obtained from an X-raytube operating at 118 kVp](https://thumb-us.123doks.com/thumbv2/123dok_us/9556891.1484507/6.595.147.436.92.322/attenuation-proles-gadolinium-corresponding-respectively-spectrum-obtained-operating.webp)