INTERNATIONAL JOURNAL OF PHARMACEUTICAL, CHEMICAL AND BIOLOGICAL SCIENCES
Available online atwww.ijpcbs.com
DEVELOPMENT AND VALIDATION OF HPLC METHOD
OF DISSOLUTION TEST FOR METOPROLOL
SUCCINATE AND CILNIDIPINE
D. SrinivasaRao*, T. Venkateswarlu and G. Rama Krishna
Department of Pharmaceutical Analysis, K.C. Reddy Institute of Pharmaceutical Sciences, J.G.Palem Village, MedikondurMandal, Guntur-522438, Andhra Pradesh, India.
INTRODUCTION
Analytical methods development and validation
play important roles in the discovery,
development, and manufacture of
pharmaceuticals. The current good manufacturing practice (CGMP) and Food Drug Administration (FDA) Guidelines insist for adoption of sound methods of analysis with greater sensitivity and reproducibility. Development of a method of analysis is usually based on prior art (or) existing literature, using the same (or) quite similar instrumentation .It is rare today that an
HPLC-based method is developed that does not in same way relate (or) compare to existing, literature
based approaches. Today HPLC (High
performance liquid chromatography) is the method of choice used by the pharmaceutical industry to assay the intact drug and degradation
products. The appropriate selection and
chromatographic conditions ensure that the HPLC method will have the desired specificity. UV spectroscopy is also a simple analytical tool widely used for routine assay of drugs. Hence for the assay of the selected drugs HPLC and UV
Research Article
ABSTRACT
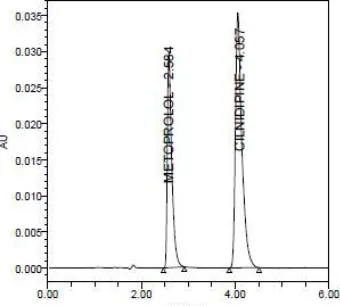
A reverse phase high performance liquid chromatographic (RP-HPLC) method suitable for simultaneous determination of Metoprolol Succinate and Cilnidipine dissolution of solid dosage forms in pharmaceuticals has been developed. Chromatographic separation was performed on a Empower 2 software. ELIPSE Phenomenax C18, 150X4.5mm, 5µ,(Make: Waters) column using a mobile phase of buffer utilizing OPA buffer ( pH 3.0): Methanol (70:30%v/v). The effluent flow rate monitored at 1.0mL/minute, injection volume was 10µL and detected by ultraviolet at 285nm. The retention times of metoprolol succinate and cilnidipine 2.590 and 4.047minutes, respectively. The total run time was 6minutes within which the drug product. The developed method has been validated for specificity, precision, linearity, accuracy, ruggedness and robustness. Additionally, the conditions of the dissolution test for metoprolol succinate and cilnidipine tablets were presented by using: paddle at 50rpm stirring speed; medium volume of 900mL; temperature at 37±0.5°C; and pH 6.8 phosphate buffer used as dissolution medium. The average percentage drug release was found to be in between 95% to 105% within 30minutes for both drugs. The proposed analytical and dissolution method can be applied successfully for the quality control of commercial metoprolol succinate and cilnidipine tablets and the comparison of in vitro dissolution of combination drug products.
spectroscopy has been chosen for these proposed methods.
Newer analytical methods are developed for these drugs or drug combinations of the below reasons
There may not be suitable method for a
particular analyte in the specific matrix.
Existing method may be too error prone
or unreliable (have poor accuracy and precision).
Existing method may be expensive, time
consuming, energy intensive and may not be provide sensitive or analyte selectivity, and not easy for automation.
Newer instrumentation and techniques
may have evolved that provide
opportunities for improved methods.
There may be need for an alternate
method to confirm, for legal and scientific reasons.
The newly developed analytical methods having their importance in different fields that include, research and development centre (R&D), Quality control department (QC). Approved testing laboratories, chemical Analysis laboratories etc. For analysis of these drugs different analytical methods are routinely being used.
CHROMATOGRAPHY IN THE PHARMACEUTICAL WORLD
In the modern pharmaceutical industry,
chromatography is the major and integral analytical tool applied in all stages of drug discovery, development, and production. The development of new chemical entities (NCEs) is comprised of two major activities. Drug discovery and development. The goal of the drug discovered is to investigate a plethora of compounds employing fast screening approaches, leading to generation of lead compounds and then narrowing the selection through targeted
synthesis and selective screening (lead
optimization). The main functions of drug development are to completely characterize candidate compounds by performing drug metabolism, preclinical and clinical screening, and clinical trails. Throughout this drug discovery and development paradigm, rugged analytical HPLC separation methods are developed, at each phase of development to analyses of a myriad of samples are performed to adequately control and monitor the quality of the prospective drug candidates, excipients, and final products. Effective and fast method development is of paramount importance
throughout. This drug development life cycle. This requires a thorough understanding of HPLC principles and theory which have solid foundation for appreciating the many variables that are optimized during fast and effective HPLC method development and optimization.
MOST COMMONLY USED METHODS IN HPLC Normal phase chromatography
For a polar stationary bed like silica we need to choose a relatively non-polar Mobile phase. This mode of operation is termed as Normal phase chromatography. Here the least polar component elutes first, and increasing the mobile phase polarity leads to decrease in elution time. Non-polar solvents like pentane, Hexane, isooctane, cyclohexane, etc. are more popular. It is mainly used for separation of nonionic, non-polar to medium polar substances.
Reverse phase chromatography
In 1960s, chromatographers started modifying the polar nature of the silanol group by chemically reacting silicon with organic silanes. The object was to make silica less polar or non-polar so that polar solvents can be used to separate water-soluble polar compounds. Since the ionic nature of the reverted, the chromatographic separation carried out with such silica is referred to as Reverse- phase chromatography. Here the most post components elutes first. Increasing mobile phase polarity leads to decrease In elution time. Common solvents used in this mode include Methanol /Acetonitrile /Isopropanol etc. Mostly used for separation of ionic and polar substances. The parameters that govern the retention in reversed phase system are the following:
a. The chemical nature of the stationary
phase surface.
b. The type of solvents that compose the
mobile phase.
c. pH and ionic strength of the mobile phase.
Isocratic elution: A separation in which the mobile phase composition remains constant throughout the procedure is termed isocratic (meaning constant composition).
MATERIALS AND METHODS
Metoprolol is obtained as gift sample from Dr Reddys Labs Pvt Ltd, Hyderabad. Cilnidipine was procured from Dr Reddys Labs Pvt Ltd, Hyderabad. Potassium dihydrogen phosphate was obtained from Dr Reddys Labs Pvt Ltd, Hyderabad. Methanol and OPA were obtained from Finar chemicals Pvt Ltd.
OPTIMIZED METHOD FOR HPLC Chromatographic parameters (fig. 1)
Mobile phase : OPA: Methanol (70:30).
Column : Phenomenax C18, 150X4.5mm, 5µ Auto sample temperature : 25oC
Column temperature : 300C
Injection volume : 10μL Detector wavelength : 285nm Flow rate : 1 mL/min
Procedure for UV and HPLC
Inject 10μL of standard, sample into chromatographic system and measure the areas for the metoprolol succinate and cilnidipine peeks and calculate the % assay by using the formula.
BUFFER PREPARATION
OPA: Methanol (70:30) Used as diluent.
Preparation of Metoprolol succinateStandard Solution
Accurately weigh and transfer 100mg of Metoprolol succinate into 100 ml of volumetric flask and add 60ml of mobile phase and sonicate to dissolve. Dilute to volume with mobile phase and mix.
Transfer each 5.0 ml of Metoprolol succinate standard solution into a 25ml volumetric flask, dilute to volume with mobile phase and mix.
Preparation of Clinidipine Standard Solution Accurately weigh and transfer 10mg of Clinidipine into 100 ml of volumetric flask and add 60ml of mobile phase and sonicate to dissolve. Dilute to volume with mobile phase and mix.
Transfer each 5.0 ml of Clinidipine standard solution into a 25ml volumetric flask, dilute to volume with mobile phase and mix.
PREPARATION OF SAMPLE SOLUTION
Commercially available 20 tablets are weighed and powdered equivalent to the 100mg of Metoprolol succinate and 10mg of Clinidipine into a 100ml volumetric flask, add about 60ml of mobile phase and sonicate for 30min with intermediate shaking (maintain the sonicator bath
temperature between 20-250C). Make up to the volume with mobile phase and mix. Filter a portion of the solution through 0.45µm membrane filter and discard first few ml of the filtrate. Transfer each 5.0 ml of above sample solution into a 25ml volumetric flask, dilute to volume with mobile phase and mix.
METHOD VALIDATION SYSTEM SUITABILITY
Solution of standard sample and placebo were prepared as per test procedure. Equilibrate the column with mobile phase for not less than 30minutes at a flow rate of 1ml/min.
Separately inject 10µL of blank, standard solution (5 times) and sample solution into the chromatographic system.
Tailing factor for the peaks due to metoprolol succinate and cilnidipinein standard solution should not be more than 2.0.Theoretical plates for the metoprolol succinate and cilnidipine peaks in standard solution should not be less than 3000.
SPECIFICITY
Solution of standard sample and placebo were prepared as per test procedure and injected into the HPLC system.
Acceptance criteria
Chromatogram of standard and sample should be identical with near Retention time.
Blank interference
A study to establish the interference of blank was conducted. Diluent was injected into HPLC system as per the test procedure.
Acceptance criteria
Chromatogram of blank should not show any peak at the retention time of analytepeak. There is no interference due to blank at the retention time of analyte. Hence the method is specific.
LINEARITY
Prepare a series of standard solutions and inject into HPLC system. Plot the graph of standard versus the actual concentration in µg/ml and determine the coefficient of correlation and basis for 100% response.
Acceptance criteria
from the linearity data (without extrapolation through origin 0, 0) should be within ±2.0.
Statistical Evaluation
A graph between the concentration and the average area was plotted. Points for linearity were observed. Using the method of least squares, a line of best fit was taken and the correlation Coefficient, slope and, y-intercept were calculated.
PRECISION
Preparation of sample
Commercially available 20 tablets are
weighed and powdered equivalent to the 100mg of Metoprolol and 10mg cilnidipine into a 100ml volumetric flask, add about 60ml of mobile phase and sonicate for 30min with intermediate shaking (maintain the sonicator bath temperature between 20-25◦C). Make up to the volume with mobile phase and mix. Filter a portion of the solution through 0.45µm membrane filter and discard first few ml of the filtrate.
Transfer 5 ml of the filtered solution into a 25ml volumetric flask, dilute to volume with mobile phase and mix.
The method precision parameters were
evaluated from sample chromatograms obtained, by calculating the % RSD of peek areas from 6 replicate injections.
Acceptance criteria: The injection reproducibility requirements are met if the %RSD for peak areas is not more than 2.0 and for retention times is not more than 2.0.
RECOVERY/ACCURACY
Recovery study can be performed in the concentration range of 50% to 150% of the target
concentration of the test. Minimum 3
concentrations are recommended.
Acceptance criteria
The average percentage recovery was between 97-103% and Relative standard deviation of these recovery concentrations was less than 2%
ROBUSTNESS
Effect of variation in flow rate
Prepare the system suitability solution as per the test method and inject into the HPLC system with ±0.2 ml of the method flow. Evaluate the system suitability values as required by the test method for both flow rates. Actual flow rate was 1 ml/min and it was changed to 0.8 ml/min and 1.2 ml/min
and inject into HPLC and system suitability was checked.
Effect of variation in Temperature
Prepare the system suitability solution as per the
test method and injected into the HPLC with ±5oc
of the method temperature. Evaluate the system suitability values as required by the test method for both temperatures.
LIMIT OF DETECTION
The sensitivity of measurement of metoprolol succinate and cilnidipinemethod was estimated in terms of the limit of detection (LOD). The LOD was calculated calculated by the use of signle to noise ratio. In order to estimate the LOD value, the blank sample was injected six times and peak area of this blank was calculated as noice level. The LOD was calculated as three times the noise level.
LOD= 3.3 σ / S Where,
σ = standard deviation of intercepts of calibration curves
S = mean of slopes of the calibration curves The slope S may be estimated from the calibration curve of the analyte.
LIMIT OF QUANTIFICATION
The sensitivity of measurement of metoprolol succinate and cilnidipineby the use of proposed method was estimated in terms of limit of quantification (LOQ). The LOQ was calculated by the use of signal to noise ratio. In order to estimate the LOQ value, the blank sample was injected six times and the peak area of this blank was calculated at noise level. The LOQ was calculated as ten times the noise value gave the LOQ.
LOQ = 10 σ / S Where,
σ = standard deviation of intercepts of calibration curves
S = mean of slopes of the calibration curves The slope S may be estimated from the calibration curve of the analyte.
DISSOLUTION OF METOPROLOL AND CILNIDIPINE BY RP-HPLC
Preparation of dissolution medium Dissolved 6.8g of mono basic potassium
Bath preparation
150rpm speed of the motor, the constant temperature bath at 37°C. Placed 900mL volume of dissolution me-dium in each of six vessels of dissolution apparatus, which previously have been immersed in the constant temperature bath, and allowed the medium to come to a temperature of 37.0 ± 0.5°C.
DISSOLUTION TEST OF TABLETS
In vitro dissolution studies of CTL tablets was
carried out in 900mL of 0.1N HCl using USP type-II (paddle method) Dissolution Rate test apparatus (DISSO 8000, Lab India). The tablet was directly placed in the dissolution medium. A speed of 100
rpm and a temperature of 37±0.5°C were used in the test. A 5mL aliquot was withdrawn at different time intervals and replaced with 5mL of fresh dissolution medium; the samples were filtered using a 0.45µm nylon disc filter. The filtered samples were suitably diluted if necessary and analysed by HPLC method as described above.
RESULTS AND DISCUSSION SYSTEM SUITABILITY RESULT
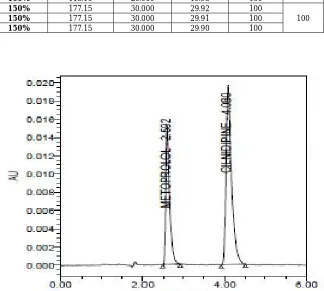
Six consecutive injections of the standard solution showed uniform retention time, theoretical plate count, tailing factor and resolution for both the drugs which indicate a good system for analysis.
Table 1:System suitability data of Metoprolol and Cilnidipine Parameter Metoprolol Cilnidipine Acceptance criteria
Retention time 2.584 4.057 +-10
Theoretical plates 3666 4514 >2500
Tailing factor 1.52 1.44 <2.00
% RSD 0.11 0.07 <2.00
Fig. 1: Chromatogram for optimized method
Fig. 2: System suitability chromatogram of Metoprolol and Cilnidipine
2
.5
8
6 4.0
6
0
A
U
0.000 0.010 0.020 0.030
Minutes
SPECIFICITY RESULT
Chromatograms explain that retention time for standard, sample and commercial product ofMetoprolol and Cilnidipine are same. This proves that, excipients have no effect on the
analytical method. On the other hand, blank peak did not overlap drug peak. So the method is highly selective (Table 2).
3. ACCURACY (Table 3-6)
Table 2: Specificity data for Metoprolol and Cilnidipine
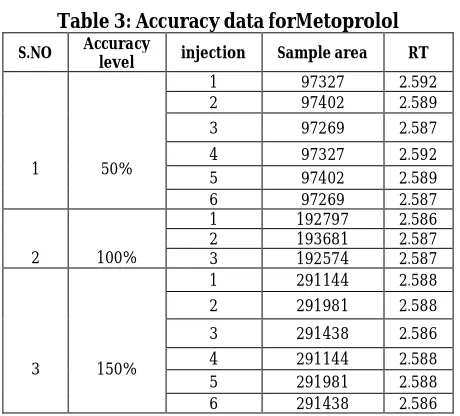
Table 3: Accuracy data forMetoprolol
S.NO Accuracy
level injection Sample area RT
1 50%
1 97327 2.592
2 97402 2.589
3 97269 2.587
4 97327 2.592
5 97402 2.589
6 97269 2.587
2 100%
1 192797 2.586
2 193681 2.587
3 192574 2.587
3 150%
1 291144 2.588
2 291981 2.588
3 291438 2.586
4 291144 2.588
5 291981 2.588
6 291438 2.586
Table 4: Accuracy (%recovery) results ofMetoprolol
Spiked Level Sample Weight µg/ml added µg/ml found % Recovery % Mean
50% 59.05 49.500 49.68 100
100
50% 59.05 49.500 49.72 100
50% 59.05 49.500 49.65 100
100% 118.10 99.000 98.41 99
100
100% 118.10 99.000 98.86 100
100% 118.10 99.000 98.29 99
150% 897.99 297.000 177.15 100
100
150% 897.99 297.000 177.15 100
150% 897.99 297.000 177.15 100
S no Sample name Metoprolol area Rt Cilnidipine Area Rt
1 Standard 197383 2.597 338937 4.056
2 Sample 193681 2.587 332082 4.134
3 Blank - - - -
Table 5: Accuracy data for Cilnidipine
S.NO Accuracy level
Sample
name Sampl area RT
1 50%
1 166619 4.080
2 166961 4.081
3 166454 4.090
4 166619 4.080
5 166961 4.081
6 166454 4.090
2 100%
1 332502 4.111
2 332082 4.134
3 332630 4.161
3 150%
1 499435 4.185
2 499199 4.210
3 499115 4.234
4 499435 4.185
5 499199 4.210
6 499115 4.234
Table 6: Accuracy (%recovery) results of Cilnidipine
Spiked Level Sample Weight µg/ml added µg/ml found % Recovery % Mean
50% 59.05 10.000 9.98 100
100
50% 59.05 10.000 10.00 100
50% 59.05 10.000 9.97 100
100% 118.10 20.000 19.92 100
100
100% 118.10 20.000 19.89 99
100% 118.10 20.000 19.93 100
150% 177.15 30.000 29.92 100
100
150% 177.15 30.000 29.91 100
150% 177.15 30.000 29.90 100
RESULT
Results of accuracy study are presented in the above table. The measured value was obtained by recovery test. Spiked amount of both the drug were compared against the recovery amount. % Recovery was 100.00% for Metoprolol and 100.00% for CilnidipineAll the results indicate that the method is highly accurate.
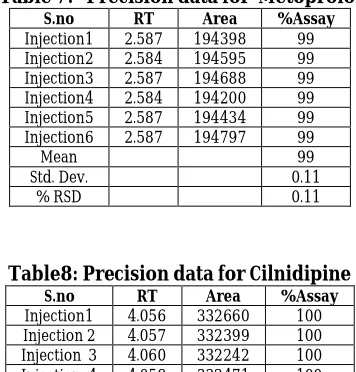
4. PRECISION: RESULT
Results of variability were summarized in the above table. % RSD of peak areas was calculated
for various run. Percentage relative standard deviation (%RSD) was found to be less than 2% which proves that method is precise.
LINEARITY RESULT
A linear relationship between peak areas
versusconcentrations was observed for
Metoprolol and Cilnidipinein the range of 50% to 150% of nominal concentration. Correlation coefficient was 0.999 for both Metoprolol and Cilnidipinewhich prove that the method is linear in the range of 50% to 150%.
Table 7: Precision data for Metoprolol S.no RT Area %Assay
Injection1 2.587 194398 99
Injection2 2.584 194595 99
Injection3 2.587 194688 99
Injection4 2.584 194200 99
Injection5 2.587 194434 99
Injection6 2.587 194797 99
Mean 99
Std. Dev. 0.11
% RSD 0.11
Table8: Precision data for Cilnidipine S.no RT Area %Assay
Injection1 4.056 332660 100
Injection 2 4.057 332399 100 Injection 3 4.060 332242 100 Injection 4 4.058 332471 100 Injection 5 4.066 332882 100 Injection 6 4.056 332281 100
Mean 100
Std. Dev. 0.07
%RSD 0.07
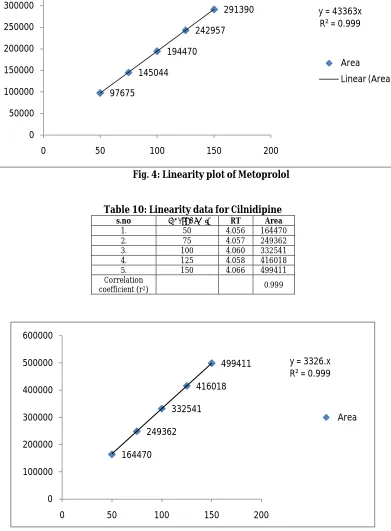
Table 9: Linearity data for Metoprolol S.no Conc(μg/ml) RT Area
1. 50 2.587 97675
2. 75 2.584 145044
3. 100 2.587 194470
4. 125 2.584 242957
5. 150 2.587 291390
Correlation
Fig. 4: Linearity plot of Metoprolol
Table 10: Linearity data for Cilnidipine s.no Conc(μg/ml) RT Area
1. 50 4.056 164470
2. 75 4.057 249362
3. 100 4.060 332541
4. 125 4.058 416018
5. 150 4.066 499411
Correlation
coefficient (r2) 0.999
Fig. 5: Linearity plot of Cilnidipine
Dissolution studies
In vitro dissolution studies of combination of
Metoprolo succinate and cilnididpine tablets was carried out in 900mL of PH 6.8 buffer using USP
type-II (paddle method) Dissolution Rate test apparatus (DISSO 8000, Lab India). The tablet was directly placed in the dissolution medium. A speed of 100 rpm and a temperature of 37±0.5°C were 97675
145044 194470
242957
291390 y = 43363x
R² = 0.999
0 50000 100000 150000 200000 250000 300000 350000
0 50 100 150 200
Area Linear (Area)
164470 249362
332541 416018
499411 y = 3326.x
R² = 0.999
0 100000 200000 300000 400000 500000 600000
0 50 100 150 200
used in the test. A 5mL aliquot was withdrawn at different time intervals and replaced with 5mL of fresh dissolution medium; the samples were filtered using a 0.45µm nylon disc filter. The filtered samples were suitably diluted if necessary and analysed by HPLC method as described above. The percent release of drug was found to be within the limits, indicating that the present LC conditions can be used for the dissolution analysis of Metoprolo succinate and cilnididpine in different commercially available formulations.
Acceptance Criteria
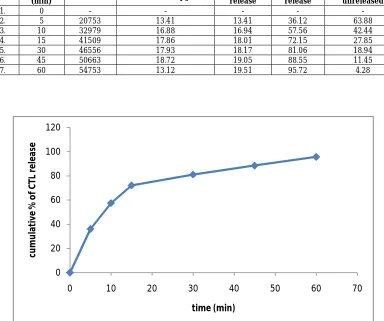
The percentage release of drug from the formulation should be more than 85% within 30 minutes as per the ICH Guidelines.
Observation
The percentage of drug release for Metoprolo succinate and cilnididpinewas found to be 95.72% within 30 minutes (Table 11 & Fig. 6).
SUMMARY AND CONCLUSION
The study is focused to develop and validate HPLC
methods for simultaneous determination
Metoprolol Succinate and Cilnidipine in
dissolution test of the formulation.
The dissolution test developed and validated for Metoprolol Succinate and Cilnidipine tablets was considered satisfactory. The conditions that allowed the dissolution determination were 900ml of pH 6.8 at 37°C ± 0.5°C, paddle apparatus, 100 rpm stirring speed and filtration with quantitative filter. In these conditions, the Metoprolol Succinate and Cilnidipinewas more stable. It can be concluded that the proposed method was fully validated and it was found to be simple, sensitive, accurate, precise, reproducible and relatively inexpensive and they gave an acceptable recovery of the analyte. Hence, the developed method can be recommended for routine quality control analysis of Metoprolol Succinate and Cilnidipine in tablet formulation.
Table 11: Dissolution parameters
S.NO Time
(min) Peak area Concentration (µg/mL)
Cum drug release
% of drug release
% of drug unreleased
1. 0 - - - - -
2. 5 20753 13.41 13.41 36.12 63.88
3. 10 32979 16.88 16.94 57.56 42.44
4. 15 41509 17.86 18.01 72.15 27.85
5. 30 46556 17.93 18.17 81.06 18.94
6. 45 50663 18.72 19.05 88.55 11.45
7. 60 54753 13.12 19.51 95.72 4.28
Fig. 6: Dissolution profile of Metoprolol succinate and cilnididpine 0
20 40 60 80 100 120
0 10 20 30 40 50 60 70
cu
m
u
la
ti
ve
%
o
f
C
TL
r
e
le
a
se
REFERENCES
1. Sharma BK. Instrumental methods of
chemical analysis, Introduction to
Analytical chemistry, 23thed.Goel
Publishing House Meerut, 2004, P12-23. 2. H.H. Willard, L.L. Merritt, J.A. Dean, F.A.
Settle. Instrumental Methods of Analysis,
7th edition, CBS publishers and
Distributors, New Delhi. 1986, P.518-521, 580-610.
3. John Adamovies. Chromatographic
Analysis of Pharmaceutical, Marcel
Dekker Inc. New York, II Ed, P.74, 5-15.
4. GurdeepChatwal, Sahm K. Anand.
Instrumental methods of Chemical
Analysis, 5th edition, Himalaya publishing house, New Delhi, 2002, P.1.1-1.8, 2.566-2.570
5. D. A. Skoog. J. Holler, T.A. Nieman.
Principle of Instrumental Analysis, 5th edition, Saunders College Publishing, 1998, P.778-787.
6. Skoog, Holler, Nieman. Principals of Instru
mental Analysis,5thEdition,
HarcourtPublishers International Company, 2001, P.543-554.
7. William Kemp. Organic Spectroscopy,
Palgrave, New York,2005,P.7-10, 328-330
8. P.D. Sethi. HPLC: Quantitative Analysis
Pharmaceutical Formulations, CBS
Publishers and distributors, New Delhi (India), 2001, P.3-137.
9. Michael E, Schartz IS, Krull. Analytical method development and Validation. 2004. P. 25-46.
10. R. Snyder, J. Kirkland, L. Glajch. Practical HPLC method development, II Ed, A Wiley
International publication, 1997,
P.235,266-268,351-353.653-600.686-695.
11. Basic Education in Analytical Chemistry. Analytical Science. 2001:17(1).
12. Method validation guidelines
International Conference on
harmonization; GENEVA; 1996
13. Berry RI, Nash AR. Pharmaceutical
Process Validation, Analytical method validation, Marcel Dekker Inc. New work. 1993; 57:411-28
14. Anthony C Moffat, M David Osselton,