http://www.sciencepublishinggroup.com/j/ijsqa doi: 10.11648/j.ijsqa.20170303.11
ISSN: 2469-8156 (Print); ISSN: 2469-8164 (Online)
Effect of Combined Processing Methods on the Functional
and Pasting Properties of Pigeon Pea (
Cajanus Cajan
) Flour
Arukwe Dorothy Chinomso
1, *, Nwanekezi Emmanuel Chidi
1, Agomuo Jude Kelechi
21Department of Food Science and Technology, Imo State University, Owerri, Nigeria 2
Department of Food Science and Technology, Federal University Dutsinma, Dutsinma, Nigeria
Email address:
[email protected] (A. D. Chinomso)
*Corresponding author
To cite this article:
Arukwe Dorothy Chinomso, Nwanekezi Emmanuel Chidi, Agomuo Jude Kelechi. Effect of Combined Processing Methods on the Functional and Pasting Properties of Pigeon Pea (Cajanus Cajan) Flour. International Journal of Science and Qualitative Analysis.
Vol. 3, No. 3, 2017, pp. 23-30. doi: 10.11648/j.ijsqa.20170303.11
Received: April 21, 2017; Accepted: May 15, 2017; Published: November 28, 2017
Abstract:
The study investigated the combined effects of different processing methods of pigeon pea on the functional and pasting properties. Soaked pigeon pea seeds (control) were subjected to sprouting, boiling, fermentation and combinations of these operations and the seeds were dried and milled into flour. The functional and pasting properties of the flour samples were analyzed using standard methods. The result of the functional properties showed that combined sprouting/fermentation reduced bulk density (0.647 – 0.599g/cm3), increased water absorption capacity (1.683 – 1.803%), increased oil absorption capacity (1.623 – 1.634%), increased swelling capacity (2.077 -2.1625) and decreased foam capacity (13.213 – 12.232%). The pasting results recorded low values for sprouted and combined processes and high values for fermented processes in peak viscosity, trough viscosity, pasting temperature and peak time.Keywords:
Functional Properties, Pasting Properties, Sprouting, Boiling, Fermentation1. Introduction
Pigeon pea is a legume commonly known as “fio fio” in the South-eastern part of Nigeria [11]. The seeds are cooked whole until tender then mixed with yam, vegetables, palm oil, pepper and other spices [11]. Attempts have been made to fortify protein-deficient foods with protein concentrate or to improve the limiting amino acids by the use of protein or protein concentrate of vegetable origin [29]. Due the dense nutritional profile of pigeon pea, new food products derived from it can be formulated to serve as supplementary food for the nutritionally vulnerable groups and communities. Functional properties connote the physical and chemical characteristics which govern the behaviour of nutrients in food during processing and serve as the basis for product performance. Functional properties affect food quality, storage and acceptability and include bulk density, foam stability, oil absorption capacity, water absorption capacity, etc.
Functional properties can also be defined as those intrinsic
physico-chemical characteristics which may affect the behaviour of food systems during processing, storage and consumption such as solubility, foamability, gelation and emulsification properties [29]. The ultimate success of utilizing plant protein as ingredients depend largely upon the beneficial qualities they impart to food which depend largely on their functional properties [4]. Therefore, in order to successfully introduce a new supplementation into any food item, it is imperative to find out if the supplementation possesses suitable functional properties for food applications and consumer acceptability. Foods can be classified according to their rheological states as solids, gel, liquid, emulsion with associated rheological behaviour and its rheological properties can be measured [32]. These properties will affect the design of food processing plant as well as shelf life and other important factors including sensory properties that appeal to consumers. Food rheology is what we experience everyday with our perception of food texture.
specified conditions. Most rheological tests involve applying a force to a material and measuring its flow or change in shape. The complex pattern of food composition often makes rheological measurements and interpretations more difficult. The rheological properties of foods vary widely from thin liquids such as water, wine, and whisky to hard solid products such as biscuits and candies and viscoelastic materials.
To be able to successfully introduce a new supplementation into any food item, it is necessary to know whether it possesses suitable functional and pasting properties for food applications and consumer acceptability. The use of flour that is produced from combination of different processing methods as ingredient for food processing is dependent on its functional and pasting properties. Therefore this study aimed to evaluate the combined effects of different processing methods of pigeon pea on the functional and pasting properties.
2. Materials and Methods
2.1. Materials Collection
The pigeon pea (Cajanus cajan) seeds for this research were purchased from a market (Ahia ohuu) in Aba, Abia State. The chemicals used were obtained from Food Science and Technology laboratory, Imo State University, Owerri and National Root Crops Research Institute, Umudike, Umuahia.
2.2. Sample Preparation
Sixteen kilograms of pigeon pea seeds were sorted to remove dirt and other foreign particles after which they were washed. The grains were then soaked in water for 3 hours using a large container and the water drained.
2.2.1. Production of Soaked Pigeon Pea Flour (Control)
Two (2) kg of the soaked grains were dehulled and dried in an oven at 60°C for 7 hours. The dried seeds were milled into flour using disc attrition mill (Asiko All, Addis Nigeria). The flour was then sieved with standard sieve (1.0mm mesh) and packaged in polyethylene bag for further studies.
2.2.2. Production of Soaked and Boiled Pigeon Pea Flour
Two (2) kg of the soaked grains were dehulled and boiled in water for 1hour at 100°C. The water was drained and the seeds dried in an oven at 60°C for 7 hours. The dried seeds were milled into flour using disc attrition mill (Asiko All, Addis Nigeria). The flour was then sieved with standard sieve (1.0mm mesh) and packaged in polyethylene bag for further studies.
2.2.3. Production of Soaked and Fermented Pigeon Pea Flour
Two (2) kg of the soaked grains were dehulled, crushed, wrapped in plantain leaves and allowed to ferment for 4 days. After fermentation, the grains were dried in an oven at 60̊ C for 7 hours. The fermented dried cotyledons were milled into flour with disc attrition mill (Asiko All, Addis Nigeria) and
standard 1.0mm mesh sieved before packaging in polyethylene bag for further studies.
2.2.4. Production of Soaked, Boiled and Fermented Pigeon Pea Flour
Two (2) kg of the soaked grains were boiled with water for 1 hour and the water drained. The grains were wrapped in plantain leaves and allowed to ferment for 4 days as described by [14]. After fermentation, the seeds were dehulled and dried in an oven at 60C for 7 hours. The dried seeds were milled into flour using disc attrition mill (Asiko All, Addis Nigeria). The legume flour were sieved with standard sieve (1.0mm mesh) and packaged in polyethylene bag for further studies.
2.2.5. Production of Soaked and Sprouted Pigeon Pea Flour
Sprouting was carried out according to the method described by [6]. Eight (8) kg of the soaked grains were spread in a single layer on a moistened jute bag and allowed to germinate (sprout) at room temperature for 3 days. During this time, the grains were sprayed with water at intervals of 12 hours until the last day of sprouting. After sprouting, the seeds were dehulled and rootlets removed. Then the cotyledons were divided into four portions of 2kg each. Then the portion (2kg) for the production of soaked and sprouted pigeon pea flour were dried in an oven at 60°C for 7 hours and milled into flour using a disc attrition mill (Asiko All, Addis Nigeria) and 1.0 mm mesh sieved before packaging into polyethylene bag for further studies.
2.2.6. Production of Soaked, Sprouted and Boiled Pigeon Pea Flour
Two (2) kg of the sprouted pigeon pea seeds were boiled for 1 hour with water at 100°C, drained and dried in an oven at 60̊ C for 7 hours. The dried sprouted boiled cotyledons were milled with disc attrition mill (Asiko All, Addis Nigeria), sieved with standard sieve (1.0mm mesh) and packaged in polyethylene bag for further studies.
2.2.7. Production of Soaked, Sprouted and Fermented Pigeon Pea Flour
Two (2) kg of the sprouted dehulled grains were wrapped in plantain leaves and allowed to ferment for 4 days as described by [14]. After fermentation, the cotyledons were dried in an oven at 60̊C for 7 hours and milled into flour with disc attrition mill (Asiko A11, Addis Nigeria) and standard 1.0mm mesh sieved before packaging in polyethylene bag for further studies.
2.2.8. Production of Soaked, Sprouted, Boiled and Fermented Pigeon Pea Flour
attrition mill (Asiko All, Addis Nigeria) and standard 1.0mm mesh sieved before packaging in polyethylene bag for further studies.
2.3. Determinations of Functional Properties
2.3.1 Determination of Water Absorption Capacity
The modified method of [15] described by [27] was employed. Water absorption capacity is expressed as the amount of water absorbed and held by a unit weight of the sample. One gram (1g) of the sample was dispersed into a weighed centrifuge tube. Ten milliliters (10ml) of distilled water was added to sample and mixed very well. The mixture was allowed to stand for 1 hour before being centrifuged at 3500rpm for 30 minutes. The excess water (unabsorbed) was decanted and the tube was inverted over an absorbent paper to drain dry. The weight of water absorbed was determined by difference. This experiment was carried out in triplicates and the mean value taken.
WAC = x (1)
Where: W1 = weight of sample
W2 = weight of empty tube + sample used
W3 = weight of empty tube + sample + water absorbed
2.3.2. Determination of Oil Absorption Capacity
The method described by [1] was adopted. One gram (1g) of the sample was mixed in 10ml of oil in a weighed centrifuge tube. The mixture was allowed to stand for I hour. Then it was centrifuged at 3500rpm using spectra scientific centrifuge (Model: Merlin, SN 976137) for 30minutes before the excess oil was decanted and the tube was inverted over an absorbance paper to drain dry. This experiment was carried out in triplicates. The weight of the oil absorbed was calculated as shown below.
OAC = x (2)
Where: W1 = weight of sample used
W2 = weight of sample + tube
W3 = weight sample + tube + oil absorbed
2.3.3. Determination of Swelling Index
This was determined using the method of [23]. One gram (1g) of the sample was dispensed into a calibrated 100 mls flask. Ten millilitres (10 mls) of distilled water was added to the sample and the volume noted. The flask was left to stand undisturbed for 1 hour and the new volume which the sample occupied was recorded. The experiment was carried out three times and the swelling index determined as:
Swelling Index (%) = x (3)
Where: V1 = Initial volume occupied by the sample
V2 = Volume occupied by sample after swelling
2.3.4. Determination of Foam Capacity and Stability
The method of [20] was used. One gram (1g) of the sample
was blended with 50ml of distilled water in a Warring blender for 5mins at room temperature to foam. The mixture was quickly but carefully transferred to the measuring cylinder and the foam volume was measured and recorded after 30seconds in the first instance, then the foam volume was recorded at 15 minutes interval for 1 hour. The experiment was carried out in triplicates. The foam capacity was calculated from the volume of foam after the first 30 seconds as given by the formula:
% FC = x (4)
Where: Va = volume after blending Vb = volume before blending
Foam stability was calculated as the volume of foam retained after one hour and was given by the formula:
% foam stability = x (5)
Where; V1 = foam volume after 1 hour blending
Va = initial foam volume after blending (30 seconds)
2.3.5. Determination of Gelation Property
The method of [8] as modified by [35] was used. A suspension of 5g of a flour sample in 50ml of distilled water was prepared in a small beaker at room temperature. The beaker containing the suspension was heated in a hot water bath for 1 hour and cooled rapidly under tap water at room temperature. The suspension was further cooled in a refrigerator at 5-10°C for 2 hours. The gelation capacity is the least gelation concentration, taken as the concentration at which the test tube content will not fall or slip when inverted. The experiment was carried out in triplicates.
2.3.6. Determination of Bulk Density
Bulk density was determined by using the method described by [21]. Ten grams (10g) of the sample was weighed into a 25ml graduated measuring cylinder. The sample was gently tapped continuously on a laboratory table to eliminate spaces between the flour particles until a constant volume is obtained. The experiment was carried out in triplicates and the mean value taken. Bulk density was calculated as:
Bulk density (g/ml) = (6)
2.4. Measurement of Rheological Properties
Pasting Properties
per min. Peak viscosity, trough viscosity, breakdown viscosity, final viscosity, setback viscosity, peak time and pasting temperature were read from the pasting profile with the aid of a thermocline for windows software connected to a computer [22].
3. Results and Discussion
3.1. Functional Properties of Pigeon Pea Flour Samples Processed by Different Methods
3.1.1. Bulk Density
There were significant differences (p<0.05) in the bulk densities of all the pigeon pea flour samples studied (Table 1). The highest bulk density (0.647g/cm3) was recorded for the control sample (SoPPF) and was significantly higher (p<0.05) than the bulk densities of samples SoBPPF (0.0625g/cm3) and SoFPPF (0.618g/cm3). The lowest bulk density (0.592g/cm3) was recorded for sample SoSpBFPPF. Bulk density is dependent upon the particle size of the sample. The reduction in bulk density as observed in this
study agrees with the work of [26] who reported that germination and fermentation lead to decrease in bulk density of foods. [2] also reported a decrease in bulk density of pigeon pea seed flour due to fermentation.
3.1.2. Water Absorption Capacity
There were significant differences (p<0.05) in water absorption capaciies of all the samples of the pigeon pea flours studied. The highest water absorption capacity (1.982%) was recorded for sample SoSpBFPPF and the
lowest water absorption capacity (1.683%) was recorded for the control sample SoPPF. The water absorption capacity
increased with increase in the number processing methods combined to process it. This is in agreement with result of [12] who reported increase in water absorption capacity of sprouted, fermented and combined sprouted/fermented sorghum, cowpea and groundnut seeds. Also, it has been reported that boiling increases water absorption capacities of legumes [28]. Water absorption capacity describes flour water association ability under limited water supply.
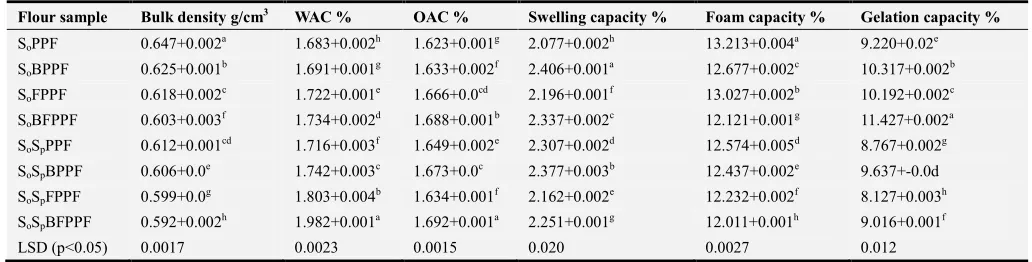
Table 1. Functional properties of pigeon pea flour samples processed by different methods.
Flour sample Bulk density g/cm3 WAC % OAC % Swelling capacity % Foam capacity % Gelation capacity %
SoPPF 0.647+0.002a 1.683+0.002h 1.623+0.001g 2.077+0.002h 13.213+0.004a 9.220+0.02e
SoBPPF 0.625+0.001b 1.691+0.001g 1.633+0.002f 2.406+0.001a 12.677+0.002c 10.317+0.002b
SoFPPF 0.618+0.002c 1.722+0.001e 1.666+0.0cd 2.196+0.001f 13.027+0.002b 10.192+0.002c
SoBFPPF 0.603+0.003f 1.734+0.002d 1.688+0.001b 2.337+0.002c 12.121+0.001g 11.427+0.002a
SoSpPPF 0.612+0.001cd 1.716+0.003f 1.649+0.002e 2.307+0.002d 12.574+0.005d 8.767+0.002g
SoSpBPPF 0.606+0.0e 1.742+0.003c 1.673+0.0c 2.377+0.003b 12.437+0.002e 9.637+-0.0d
SoSpFPPF 0.599+0.0g 1.803+0.004b 1.634+0.001f 2.162+0.002e 12.232+0.002f 8.127+0.003h
SoSpBFPPF 0.592+0.002h 1.982+0.001a 1.692+0.001a 2.251+0.001g 12.011+0.001h 9.016+0.001f
LSD (p<0.05) 0.0017 0.0023 0.0015 0.020 0.0027 0.012
Values are means. + Standard deviations from the means. Means with different letter within a column are significantly different (p<0.05). LSD= Least significant difference
Key: SoPPF = soaked pigeon pea flour (control), SoBPPF= soaked and boiled pigeon pea flour, SoFPPF = soaked and fermented pigeon pea flour, SoBFPPF =
soaked, boiled and fermented pigeon pea flour, SoSpPPF = soaked and sprouted pigeon pea flour, SoSpBPPF = soaked, sprouted and boiled pigeon pea flour,
SoSpFPPF = soaked, sprouted and fermented pigeon pea flour, SoSpBFPPF = soaked, sprouted, boiled and fermented pigeon pea flour.
3.1.3. Oil Absorption Capacity
There were significant differences (p<0.05) in the oil absorption capacities among the samples of the pigeon pea flour samples. The control sample (SoPPF) had the lowest
oil absorption capacity (1.623%) while the highest oil absorption capacity (1.692%) was recorded for sample SoSpBFPPF. The oil absorption capacity like water
absorption capacity was increased by all the processing methods employed in this study. The increase was more on the pigeon pea flours which were processed using combined processing methods. The result however does not correspond with that reported by [2] who stated that fermentation decreases the oil absorption capacity of pigeon pea flour. However, the result agrees with the report of [12] who reported an increase in oil absorption capacity of cereal and legume seeds as a result of sprouting, fermentation and combination of sprouting and fermentation.
3.1.4. Swelling Capacity
There were significant differences (p<0.05) between the swelling capacities of SoSpBPPF, SoSpFPPF and SoSpBFPPF
with the values of 2.377%, 2.162% and 2.251% respectively. The highest swelling capacity (2.406%) was recorded for sample SoBPPF. The result showed that swelling capacity
indicated increase in the swelling index of boiled Irvingia gabonesis flour.
3.1.5. Foam Capacity
There were significant differences (p<0.05) in the foam capacities of the pigeon pea flour samples. The highest foam capacity (13.213%) was recorded for the control sample (SoPPF) and that was significantly different from the foam
capacity value (12.677%) of sample SoBPPF. Sample SoFPPF
had a value of 13.027% which was reduced to 12.121% in the boiled/fermented flour sample (SoBFPPF). There were
significant differences (p<0.05) in the foam capacity values of samples SoSpPPF (12.574%) and SoSpBPPF (12.437%).
The least value foam capacity (12.011%) was recorded for sample SoSpBFPPF followed by sample SoSpFPPF
(12.232%). The foam capacity values obtained in this study were close to that reported for pumpkin (13.2%) by [30] but higher than that reported for germinated tiger nut varieties (4.00 to 11.33%) by [7].
3.1.6. Gelation Capacity
There were significant differences (p<0.05) in the gelation capacity values of the pigeon pea flour samples. The highest gelation capacity (11.427%) was recorded in sample SoBFPPF and that was significantly (p<0.05) higher
than that of unboiled soaked fermented sample SoFPPF
(10.192%). The control sample had a gelation capacity of 9.220% which was significantly (p<0.05) increased by 10.317% by boiling in sample SoBPPF. Also, sample
SoSpPPF had a gelation capacity of 8.767%. This was
significantly (p<0.05) increased in the soaked/sprouted/boiled pigeon pea flour (SoSpBPPF) to
9.637%. The lowest gelation capacity (8.127%) was recorded in SoSpFPPF which was significantly (p<0.05)
increased in the boiled sample (SoSpBFPPF) to a value of
9.016%. This is an index of gelling tendency (ability to form gel) of the flour samples and it is very important in food preparations. The low gelation capacity values recorded for the combined sprouted/fermented flour sample and the sprouted and fermented flour samples respectively may be due to their high protein contents. This result is in agreement with the report of [10] who indicated decrease in gelation capacity of germinated African oil bean seed flour. The gelation capacity of some of the pigeon pea flours are near that of soybean flour (10%) as reported by [3] and fall between (10-14%) recorded for cocoyam flour by [29].
3.2. Pasting Properties of Pigeon Pea Flour Samples Processed By Different Methods
The pasting properties for all the processed pigeon pea flour samples are shown in Table 2.
3.2.1. Peak Viscosity
The peak viscosity ranged from 53.0 – 526.20RVU. There
were significant differences (p<0.05) in the peak viscosities of the flour samples. The control sample (SoPPF) had a peak
viscosity value of 124.25 RVU which was significantly different (p<0.05) from those of samples SoBPPF
(208.65RVU) and SoSpBFPPF (143.40RVU). Peak viscosity
indicates the water holding capacity of starch and is often correlated with the final product quality. This result agrees with the report of [31] who indicated a low peak viscosity for sprouted pigeon pea and high peak viscosities for fermented and boiled pigeon pea flours. [13] opined that the low peak viscosities observed in the sprouted and combined sprouted/fermented samples are nutritionally beneficial in infant food formulation.
3.2.2. Trough Viscosity
The trough viscosity ranged between 47.55 – 468.30RVU. The least trough viscosity (47.55RVU) was recorded in the flour sample SoSpPPF. The trough viscosity values varied
significantly (p<0.05) among all the flour samples. During the holding period of a typical pasting test, the sample is subjected to a period of constant temperature (usually 95°C) and mechanical shear for a certain period of time. This further disrupts the starch granule and amylose molecules generally leach out into the solution and align in the direction of the shear [16]. The period is sometimes called shear thinning, hot paste viscosity, holding strength, paste stability or trough due to the accompanied breakdown in viscosity. It is the minimum viscosity value in the constant temperature phase of the RVA profile. It measures the ability of paste to withstand breakdown during cooling [22]. Sprouting reduced the trough viscosity drastically while fermentation increased it tremendously. Again boiling was found to increase the trough and peak viscosity of pigeon pea flour. Trough viscosity is regarded as the measure of paste stability [9]. It gives an indication of hot paste stability and the smaller the value, the higher the stability. Therefore to produce pigeon pea flours with low trough viscosity or hot paste stability, any of these processes (sprouting, sprouting/boiling, sprouting/fermentation and sprouting/boiling/fermentation) can be used to process the flour. Hence these pigeon pea flour samples, SoSpPPF (47.55RVU), SoSpFPPF (68.83RVU),
SoSpBPPF (101.0RVU) and SoSpBFPPF (121.53RVU) with
low trough viscosity values could be said to have hot paste stability and could be useful in processes that require stable paste and low retrogradation, such as filler in meat canning industry.
3.2.3. Break down Viscosity
There were significant differences (p< 0.05) in the breakdown viscosities of the pigeon pea flour samples studied. The highest breakdown viscosity (56.35RVU) was recorded in the flour sample SoBFPPF and this was
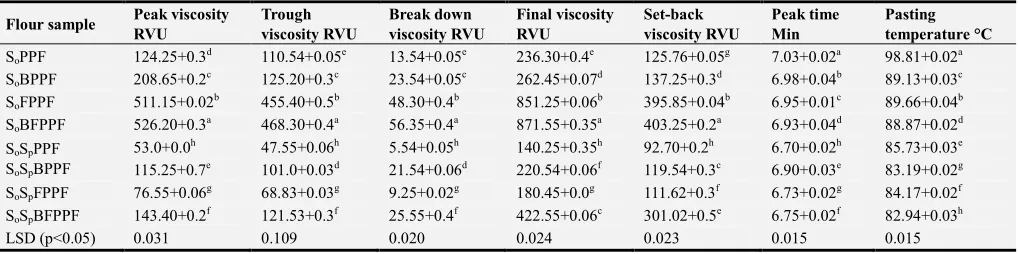
Table 2. Pasting Properties of Pigeon Pea Flour Processed Using Different Methods.
Flour sample Peak viscosity
RVU
Trough viscosity RVU
Break down viscosity RVU
Final viscosity RVU
Set-back viscosity RVU
Peak time Min
Pasting temperature °C
SoPPF 124.25+0.3d 110.54+0.05e 13.54+0.05e 236.30+0.4e 125.76+0.05g 7.03+0.02a 98.81+0.02a
SoBPPF 208.65+0.2c 125.20+0.3c 23.54+0.05c 262.45+0.07d 137.25+0.3d 6.98+0.04b 89.13+0.03c
SoFPPF 511.15+0.02b 455.40+0.5b 48.30+0.4b 851.25+0.06b 395.85+0.04b 6.95+0.01c 89.66+0.04b
SoBFPPF 526.20+0.3a 468.30+0.4a 56.35+0.4a 871.55+0.35a 403.25+0.2a 6.93+0.04d 88.87+0.02d
SoSpPPF
SoSpBPPF
53.0+0.0h 47.55+0.06h 5.54+0.05h 140.25+0.35h 92.70+0.2h 6.70+0.02h 85.73+0.03e 115.25+0.7e 101.0+0.03d 21.54+0.06d 220.54+0.06f 119.54+0.3c 6.90+0.03e 83.19+0.02g
SoSpFPPF 76.55+0.06g 68.83+0.03g 9.25+0.02g 180.45+0.0g 111.62+0.3f 6.73+0.02g 84.17+0.02f
SoSpBFPPF 143.40+0.2f 121.53+0.3f 25.55+0.4f 422.55+0.06c 301.02+0.5e 6.75+0.02f 82.94+0.03h
LSD (p<0.05) 0.031 0.109 0.020 0.024 0.023 0.015 0.015
Values are means+ Standard deviations from the means. Means with different letter within a column are significantly different (p<0.05). LSD= Least significant difference.
Key: SoPPF = soaked pigeon pea flour (control), SoBPPF= soaked and boiled pigeon pea flour prouting, SoFPPF = soaked and fermented pigeon pea flour,
SoBFPPF = soaked, boiled and fermented pigeon pea flour, SoSpPPF = soaked and sprouted pigeon pea flour, SoSpBPPF = soaked, sprouted and boiled pigeon
pea flour, SoSpFPPF = soaked, sprouted and fermented pigeon pea flour, SoSpBFPPF = soaked, sprouted, boiled and fermented pigeon pea flour
At breakdown, the swollen starch granules disrupt further and amylose molecules generally leach out into the solution [39]. Higher values of breakdown viscosities are associated with higher peak viscosities which in turn are related to the degree of swelling of starch granules
3.2.4. Final Viscosity
The final viscosities for the flour samples ranged from 140.25 to 871.55RVU with sample SoSpPPF having the
lowest value (140.25 RVU) followed by samples SoSpFPPF
(180.45RVU), SoSpBPPF (220.54 RVU) and SoSpBFPPF
(422.55RVU). The final viscosity is an indication of the ability of the starch based food to form a viscous paste or gel after cooking and cooling [37]. The result showed that the highest values of final viscosities were obtained from the pigeon pea flour samples that were processed by boiling/fermentation (SoBFPPF) and fermentation (SoFPPF)
while the pigeon pea flours with lowest final viscosity values were processed by sprouting (SoSpPPF) and
sprouting/fermentation process (SoSpFPPF). This implied that
these two flour samples SoBFPPF and SoFPPF with the
highest final viscosity values will be less stable after cooling while the flour samples SoSpPPF and SoSpFPPF with the
lowest final viscosity values will be more stable after cooling.
3.2.5. Setback Viscosity
The setback viscosity values of the pigeon pea flour samples ranged from 92.70-403.25 RVU with sample SoSpPPF having the lowest value (92.70 RVU) followed by
samples SoSpFPPF (111.62 RVU), SoSpBPPF (119.54 RVU)
and SoSpBFPPF (301.20 RVU). There were significant
differences (p<0.05) in the setback viscosities among all the pigeon pea flour samples. The highest setback viscosity (403.25 RVU) was recorded in sample SoBFPPF which was
significantly different (p<0.05) from the setback viscosity of sample SoFPPF (395.85RVU) with second highest setback
viscosity. Higher setback viscosity value is synonymous to reduced dough digestibility [38] while lower setback during the cooling of the paste indicates lower tendency to
retrogradation [33, 34] and hence enhanced dough digestibility Setback value has been correlated with the texture of the food products [19].
3.2.6. Peak Time
The peak time values for the flour samples ranged from 6.70 – 7.03min with sample SoSpPPF recording the lowest
(6.70mins) and control sample (SoPPF) having the highest
(7.03min) value of peak time. There were significant differences (p<0.05) in the peak time values among the pigeon pea flour samples. Sample SoSpBFPPF had a peak
time of 6.75mins while sample SoSpFPPF had a peak time of
6.73mins. Samples SoSpBPPF, SoBFPPF and SoFPPF
recorded peak times of 6.90mins, 6.93mins and 6.95mins respectively. Sample SoBPPF recorded peak time of 6.98mins. This is a measure of the cooking time [1] The results showed that samples SoSpPPF, SoSpFPPF and
SoSpBFPPF with peak times of 6.70mins, 6.73mins and 6.75
minutes respectively took less time to form paste. This means that they cooked faster and required less heating to form paste. This is in agreement with the report of [25] on the pasting time of soy-melon enriched semolina.
3.2.7. Pasting Temperature
This was recorded as 98.81°C for the control sample (SoPPF) followed by sample SoBPPF with value of 89.13°C.
The least pasting temperature (82.94°C) was obtained for sample SoSpBFPPF followed by samples SoSpBPPF and
SoSpFPPF with pasting temperatures of 83.19°C and 84.17°C
respectively. Sample SoFPPF had a pasting temperature of
89.66°C which was reduced to 88.77°C in the boiled sample SoBFPPF. Also sample SoSpPPF recorded pasting temperature
of 85.73°C which reduced to 83.19°C in the boiled sample SoSpBPPF. There were significant differences (p<0.05) in the
pasting temperatures of all the samples.
4. Conclusion
absorption capacity, oil absorption capacity, swelling capacity and decreased bulk density and foam capacity. This implies that this flour has good functional properties and can be used in food systems like bread, cake and biscuit products. The good pasting properties of combined sprouted/fermented pigeon pea flour, i.e., low peak, trough, set back, breakdown and final viscosities are beneficial in infant food formulations and as filler in meat canning industry. Also, the low pasting temperature obtained for the combined sprouted/fermented pigeon pea flour sample implies that they cook faster and save fuel.
References
[1] Adebowale, Y. A., Adeyemi, A. and Oshodi, A. A. (2005). Functional and physic-chemical properties of flours of six
Mucuna species. African Biotechnology 4 (12): 1461-1468. [2] Adebowale, O. J. and Maliki, K. (2011). Effect of
Fermentation period on the Chemical Composition and Functional properties of pigeon pea (Cajanus cajan) seed flour. Intl. Food Res, Journal 18 (4): 1329-1333.
[3] Alfaro, M. J., Alvarez, I., Khor, E. L. and Pakida, F. C. (2004). Functional properties of protein Products from Barinus nut. American Journal of Nutrition 54: 223-228.
[4] Aluko, R. E. and Yada, R. Y. (1995). Structure function relationship of cowpea (Vigna unguiculata) globulin isolate: Influence of pH and NaCl on physicochemical and functional properties. Food Chem. 53: 259-266.
[5] AOAC (2005). Official Methods of Analysis International. 18th Edition. Association of Official Analytical Chemists, USA.
[6] Ariahu, C. C., Ukpabi, U. and Mbajunwa, K. O. (1999). Production of African breadfruit (Treculia Africana) and soyabean (Glycine max) seed based food formulations. 1: Effects of germination and fermentation on nutritional and organoleptic quality. Plant Foods Hum. Nutr. 54: 123-266. [7] Chinma, C. E., Adewuyi, O. and Abu, O. J. (2009). Effect of
germination on the chemical, functional and pasting properties of flours from brown and yellow varieties of tiger nut (Cyperus esculentus). Food Research International 42: 1104-1109.
[8] Coffman, C. W. and Garcia, V. V. (1977). Functional properties and amino acid contents of a protein isolate from bean flour. Journal of Food Tech. 12: 473.
[9] Dengate, H. N. (1984). ‘Swelling, pasting and gelling of wheat starch.” In: Pomeranz Y. (ed). Advances in Cereal Science and Technology, AACC, USA, pp. 49-82.
[10] Enujiugha, V. N., Badejo, A. A., Iyiola, S. O. and Oluwamukomi, M. O. (2003). Effect of Germination on the Nutritional and Functional properties of African oil bean (Pentaclethra macrophylla Berth) seed Flour. Food, Agric. Environ., 1 (3 and 4): 72-75.
[11] Enwere,, J. N. (1998). Foods of Plant Origin. Afro Orbis Publ. Ltd. Nsukka, Nigeria. Pp. 64-124.
[12] Falmata, A. S., Modu, S., Badau, H. D., Babagana, M. and Bintu, B. P. (2014). Formulation and Evaluation of
Complementary Weaning Food prepared from single and combined sprouted fermented local red sorghum (S. bicolor) variety blended with cowpea (Vigna unguiculata) and groundnut (Arachis hypogea). Int. J. Biotechnol. Food Sci. Vol. 2 (8): 149-155.
[13] Fasasi, O. S., Eleyinmi, A. F. and Oyarekua, M. A. (2007). Effect of some traditional processing operations on the functional properties of African bread fruit seed (Treculia Africana) flour. LWT-Food Science Technology 40: 153-159. [14] Ikemefuna, C. (1998). Scialert.net/fulltext/%3F doi. Accessed
10th August, 2014.
[15] Lin, M. I. Y., Hubert, E. S. and Sosulki, F. N. (1974). Certain functional properties of sunflower meal products. J. Food Sci. 39: 68-371.
[16] Maziya-Dixon, B., Dixon, A. G. O. and Adebowale, A. A. (2004). Targeting different end uses of cassava: genotypic variations for cyanogenic potentials and pasting properties. A paper presented at ISTRC–AB Symposium, 31 Oct.–5 Nov. 2004, Whitesands Hotel, Mombasa, Kenya.
[17] Maziya-Dixon, B., Sanni, L. O., Adebowale, A. A., Onabanjo, O. O. and Dixon, A. G. O. (2005). Effect of variety and drying methods on proximate composition and pasting properties of high quality cassava flout from yellow cassava roots. In: Proceedings of the African Crop Science Society Conference, Entebbe, Uganda. 5th – 9th December 2005.
[18] McKenna, B. M. and Lyng, J. C. (2003). Texture in food. In: Introduction to food rheology and its measurement. Booksgoogle.com. pp. 2-3. Retrieved 10 Aug 2014.
[19] Michiyo, W., Tomoko, M., Kikuchi, T., Hiroshi, K. and Naofumi, M. (2004). Application of pre- germinated brown rice for Bread making. Cereal Chem. Vol. 3, pp. 293-317. [20] Narayana, K. and Narasinga Rao, M. S. (1982). Functional
properties of raw and processed winged bean (Psophocarpus tetragonolobus) flours. Journal of Food Science 47: 1534-1538.
[21] Narayana, K. and Narasinga, R. M. S. (1984). Effect of acetylation and succinylation on the functional properties of winged bean flour. J. Food Sci. 49: 547-550.
[22] Newport Scientific (1998). Applications Manual for the Rapid Visco Analyzer using Thermocline for Windows. Newport Scientific Pty Ltd. ½ Apollo Street, Warriewood NSW 2102, Australia. Pp. 2-26.
[23] Okezie, O. B. and Bello, S. O. (1998). Analytical Chemistry of Plants. Heinmann Publishers. Pp. 445-450.
[24] Okorie, S. U., Ihemeje, A., Ojimaka, M. C. and Ekwe, C. C. (2013). Soaking and Boiling Effects on the Proximate Composition and Functional Properties of Ukpo (Mucuna Flagellipes), Egusi (Colocynthis citrullus) and Ogbono (Virginia gabonesis). Part-1: Natural and Applied Sciences vol. 4, No. 4. www.journals.savap.org.pk. Accessed 24th March, 2016.
[25] Oluwamukomi, M. O. and Jolayemi, O. S. (2012). Physico thermal and Pasting Properties of soy-melon-enriched “garri” semolina from cassava. Agric. Eng. Int. CIGR Journal. Vol. 14. No. 3 p. 105.
[27] Onimawo, A. I. and Egbekun, K. M. (1998). Comprehensive Food Science and Nutrutive Biochemistry. Rev. ed., University of Ibadan. Pp. 193-20728.
[28] Onweluzo, J. C. and Morankinyo, A. O. (1996). Effects of pre-dehulling treatments on the composition of the seeds of legume Afzelia Africana and its potential use in pasteries. Plant Foods for Human Nutr. 50: 203-210.
[29] Oshodi, A. A. and Ekperigin, N. M. (1989). Functional properties of pigeon pea flour (Cajanus cajan). Food Chem. 34: 187.
[30] Oshodi, A. A. and Fagbemi, T. N. (1992). Functional properties of defatted flour and protein isolate of fluted pumpkin seed flour. Ghana Journal of Chemistry 1: 216-226. [31] Owuamanam, C., Ogueke, C. and Edom, T. (2014). Use of
seed sprouting in modification of food nutrients and pasting profile of tropical legume flours. Nigerian Food Journal vol. 32 (1): 117-125.
[32] Ragaee, S. and Abdel-Aal, E. M. (2006). Pasting properties of starch and protein in selected cereals and quality of their food products. Food Chemistry 95 (1): 9-18.
[33] Sandhu, K. S., Singh, N. and Malhi, N. S. (2007). Some properties of corn grains and their flours. 1: Physicochemical, functional and chapatti-making properties of flours. Food Chemistry 101 (3): 938-946.
[34] Sanni, L. O., Kosoko, S. B., Adebowale, A. A. and Adeoye, R. J. (2004). The Influence of plum oil and chemical modification on the pasting properties of fufu flour. Int. J. Food Sci. 7 (2): 229-237.
[35] Sathe, S. K. Rangneker, P. D., Deshpande, S. S. and Salunkhe, D. K. (1982). Isolation and Partial characterization of Blackgram (Phasemungo L.) starch. J. Food Sci. 47: 1524-1527.
[36] Sathe, S. K. and Salunkhe, D. K. (1981). Functional properties of great Northern bean (Phaseolus vulgaris L.) proteins: Emulsion, foaming, viscosity and gelation properties. Journal of Food Science 46: 71-75.
[37] Shimels, A. E., Meaza, M. and Rakshit, S. (2006). Physicochemical properties, pasting behavior and characteristics of flour and starch from improved Bean (Phaseolus vulgaris L.) varieties grown in East Africa. CIGRE 8: 1-18.
[38] Shittu, T. A., Lasekan, O. O., Sanni, L. O. and Oladosu, M. O. (2001). The Effects of drying methods on the functional and sensory characteristics of pupuru-a fermented cassava product. ASSET-An International Journal of Agric. Sci., Sci., Environ. and Technol. 1 (2): 9-16.