© 2015 IJSRSET | Volume 1 | Issue 5 | Print ISSN : 2395-1990 | Online ISSN : 2394-4099 Themed Section: Engineering and Technology
System Safety Assessment by Developing Hazard Rate Function
Based on 5 years Incidents in an Oil Refinery Using Weibull
Analysis and its Estimators
Praveen Patel
*1, Dr. Nagendra Sohani
2 *1PhD. Scholar, Mechanical Engineering Department, Suresh Gyan Vihar Univercity, Jaipur, Rajasthan, India
2
Associate Professor, Mechanical Engineering Department, Institute of Engineering & Science, DAVV, Indore , Madhya Pradesh., India
ABSTRACT
A comprehensive study on system safety assessment of an Indian Oil Refinery incident for five year was done considering the effect of incidents on refinery infrastructure and human injury/causality. The impact of incidents has been assessed by two parameter first the time between two successive incidents and seconds its consequences. The hazard rate function and cumulative risk function for distinguished category of incident in oil refinery were developed. The study evaluated the status of safety level as well as the scope of improvement for the particular oil refinery safety.
Keywords: Hazard Rate Function, TBO, System Safety Assessment, Safety Analysis.
I.
INTRODUCTION
Oil refineries are the major source of world’s fuel consumption. The oil refineries are enrich with the hazardous process and operations which includes higher pressure and temperature. The existing system of oil refining and process around the country have been subjected to deterioration due to aging, aggressive environmental factors, inadequate design and improper protect and maintenance. These facility often require extensive maintenance, repair, renewal practices and even replacement of certain components. The integrity of these facility is primary interest of oil refinery based company, governmental agencies, consumers and other stack holder due to potential adverse consequences related to public health, safety and heavy financial liabilities in case of systems failure.
The few large fire and explosion in petroleum and chemical industries which were attracted the attention of
world society are as under
.
II.
METHODS AND MATERIAL
Table 1: List of Major Fire and Explosion accidents in Oil and Gas Industry
Date Location Cause Materi
al
Quanti ty (tones)
Death (d), injure d (i) 7 July
1951
Port Newark, NJ, USA
Fire Propan
e (70
2600 14i
1955 Ludwigsh
afen, FRG
Railroad accident
LPG * 2i
1955 Cottage
Grove, OR, USA
Storage vessel failure
LPG * 12d,
13i
8 Januar y 1957
Montreal, Canada
Fire Butane 5100 1d
1958 Michigan,
USA
Overfilli ng
Butane 55 1d
4 Januar y 1966
Feyzin, France
Fire Propan
e
1000 18d,
83i
Date Location Cause Materi
al
Quanti ty (tones)
Table 1.1 (Continued) 25 January 1969 Laurel, MS, USA Fire (derail)
Propane 65 2d,
976i
21 June 1970
Crescent City, IL, USA
Fire (Derail)
Propane (5)
275 66i
30 March 1972
Rio de
Janerio, Brazil
Fire Propane 100
0
37d
1972 Rio de
Janeiro, Brazil
LPG Storage
spheres
(five on
site) and cylinders
* 37d,
53i
5 July
1973
Kingman
, AZ,
USA
Fire Propane 100 13d,
95i 12 February 1974 Oneonta, NY, USA Fire (Derail) Propane (4)
288 25i
30 May 1978
Texas City, TX, USA
Fire Butanes(6
) 150 0 7d 10i 19 Novembe r 1984 Mexico City, Mexico
Fire Propane
(20) 300 0 650d , 6400 i August 1993 Panipat, India Pressure build-up
Ammonia * 6d,
25i 7 January
2001
Kanpur, India
Highway accident
LPG * 12d,
6i
1 July
2001
Jamnaga r, India
Damage LPG * 12d
19 January 2004 Skikida, Algeria Explosio n
LNG * 13d,
75i 29 October 2009 Jaipur, India
Fire Kerosine
(SKO) Motor Spirit (MS) 100 0 11d, 7i
A. Incident Pattern and Type
There is no general agreement about how accidents and incidents should be defined. In view of this author would like to focus on various types of data which might be included in these two categories and the practical implications. Most commonly used distinction between accidents and incidents is that accidents have a specific outcome while incidents have no outcome such as injuries, damage, fire, leakage etc. in an organization. Accident includes any undesired circumstances which give rise to ill-health, damage to property, plant, products, production loss and increased liabilities.
Incident includes all undesired circumstances which could cause accidents; it is preferable to think incidents as part of single, much larger, group of undesired events which leads to accident.
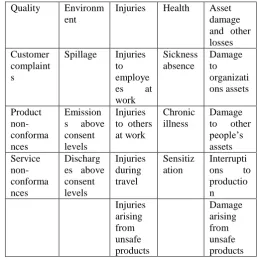
Table 2: The main types of accident and incident data
Quality Environm
ent
Injuries Health Asset
damage and other losses Customer
complaint s
Spillage Injuries
to employe
es at
work Sickness absence Damage to organizati ons assets Product non- conforma nces Emission
s above
consent levels
Injuries to others at work
Chronic illness
Damage
to other
people’s assets Service non- conforma nces Discharg es above consent levels Injuries during travel Sensitiz ation Interrupti
ons to
productio n Injuries arising from unsafe products Damage arising from unsafe products
B. Collection of Accident and Incident Data
One of the largest Oil Refinery of our country has been consider for this work and author had completed one month vocational training for the collection of accident and incident data for refinery. The major sources of accident and incident data within the oil refinery during vocational training includes Accidents Report, Accident
/ Incident Record, Accident notification and
investigating report. In the oil refinery management system follow the chronology of an accident and the author identified the following states to accomplish the same.
1. The person, who sustains the injury, or someone else,
reports that an accident/incident has happened, usually in a online system which is assessable to all EHS professional of refinery.
2. The EHS professional to whom the accident/incident
is reported, makes a written record of the salient points, usually in a risk register form.
3. The accident is investigated and, if it is sufficiently
4. The EHS professional who investigates the accident writes a report on his or her findings, to which are added any suggestions for remedial action.
5. The EHS professional who investigates the accident
report back to those involved in the outcome of the investigation and the action to be taken.
The vocational training follows the three major steps in collecting accident and incident data of the oil refinery. First step involve the critical examination of all reported accident and incident available with the EHS department of oil refinery. The second step for checking of non-reporting incident and accident was beginning. Personal interview with people who are likely to have experience or knowledge of the accident or incident were commenced. People are more willing to talk about accident or incident they did not report if they are confident that there will be no adverse consequences as a result of their revelations. The author has carried out an appropriate sample of interviews which make a reasonable accurate assessment of the proportion of accidents or incident which is going unreported. Inspections of locations where incident/ accident took place was done by author during these interviews and one set of incident record is keep ready for cross checking the statement given by individual person. A good data are available from year 2010 to 2015 for analysis of incident/accident within the oil refinery.
Classification of Accident/Incident Data
Incident type has been arranged date wise from last five years in risk register of the concern oil refinery. A short description about the incident/accident was found and based on which the type of incident/accident was categorize. The severity level broadly classified on to different aspect the first in terms of harm to personnel and second in terms of plant damage and loss production. The four major significant scales has been decided the severity level of individual incident which was took place. The detail description on these scales of consequences is given below.
We have set up a scale of harm to personnel as:
Minor - Reportable but non-disabling injuries causing over 3 days absence.
Critical – Disabling injury or severe injury requiring extensive recovery and 1 in 10 chance of fatality. Severe – Critical injuries and possibly 1 fatality. Catastrophic – One or more fatalities.
Also when a scale of loss in terms of plant damage and lost production is concern an incident/accident severity described as:
Minor - Short-term loss of production.
Critical - Damage to machines repairable in short time. Severe - Damage to plant, major repair costs and serious loss of production.
Catastrophic - Substantial damage to plant and potential loss of overall plant.
C. Proposed Safety Assessment using Weibull Analysis
The Weibull Distribution
The weibull distribution is one of the most widely used lifetime distribution in reliability engineering. It is a versatile distribution that can take on the characteristics of other types of distributions, based on the value of the shape parameter and scale parameter. To apply Weibull distribution to the available data from Oil Refinery we have to categories the data in four major category and the estimates of the parameters of the Weibull distribution can be found graphically via probability plotting paper, using least squares (rank regression) analysis
Estimation of the Weibull Parameters
The steps for determining the parameters of the Weibull representing the data, using probability plotting, are First rank the time between occurrence in ascending order as shown in table for All four major category. The method of probability plotting takes of the cdf of the distribution and attempts to linearize it by employing a specially constructed paper. The following sections illustrate the steps in this method using 2 parameter Weibull distribution.
1. Linearize the unreliability function.
2. Construct the probability plotting paper
3. Determine the X and Y positions of the plot
points.
Constructing the Paper
Complex requiring a double log reciprocal transformation as
y= ln (ln (1/1-median rank of y)) x= ln (TBO)
Figure 1: Weibull paper for Minor Incident 2010 to 2015
Least Square Analysis for Minor Incidents & Weibull Estimator ̂ ∑ ( ) (∑ ) (∑ ) ∑ ( ) (∑ ) ( )( ) ( ) ̂ ̂ ∑ ̂ ∑ ( ) ̂ ̂ ̂ ̂⁄ ̂ ( ) ̂
Figure 2: Weibull paper for Critical Incident 2010 to 2015
Least Square Analysis for Critical Incidents & Weibull Estimator ̂ ∑ ( ) (∑ ) (∑ ) ∑ ( ) (∑ ) ( )( ) ( ) ̂ ̂ ∑ ̂ ∑ ̂ ̂ ̂ ̂ ̂̂ ( ) ̂
Figure 3 : Weibull paper for Severe Incident 2010 to 2015 Least Square Analysis for Severe Incidents & Weibull Estimator ̂ ∑ ( ) (∑ ) (∑ ) ∑ ( ) (∑ )
100 101 102 103
-7 -6 -5 -4 -3 -2 -1 0 1 2
ln(TBO)Weibull Probability Plotting Paper Minor Incidents
ln (l n (1 /( 1 -M e d ia n R a n k o f T B O )) )W e ib u ll P ro b a b il it y P lo tt in g P a p e r -4 -3 -2 -1 0 1 2 /( 1 -M e d ia n R a n k o f T B O )) )W e ib u ll P ro b a b il it y P lo tt in g P a p e r 100 -2.5 -2 -1.5 -1 -0.5 0 0.5 1
ln(TBO)Weibull Probability Plotting Paper Severe Incidents
( )( ) ( )
̂
̂ ∑
̂
∑
(
)
̂ ̂ ̂
̂ ̂̂ (
)
̂
Figure 4: Weibull paper for Catastrophic Incident 2010 to 2015
Least Square Analysis for Catastrophic Incidents & Weibull Estimator
̂ ∑ ( ) (∑ ) (∑ ) ∑ ( ) (∑ )
( )( ) ( )
̂
̂ ∑ ̂ ∑
( )
̂ ̂ ̂
̂ ̂̂ ( )
̂
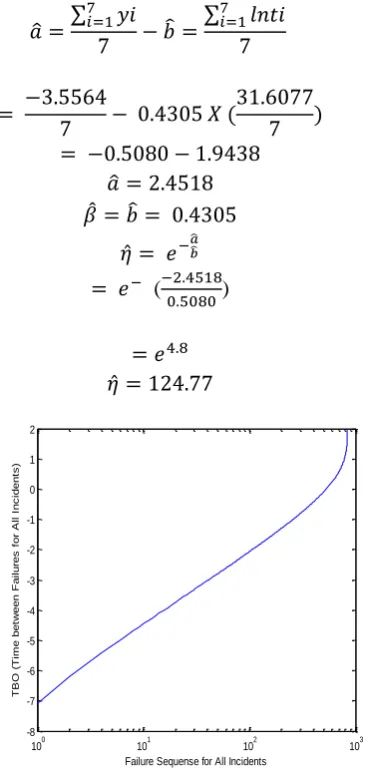
Figure 5: Weibull paper for All Incident 2010 to 2015 Least Square Analysis for All Incidents & Weibull Estimator
̂ ∑ ( ) (∑ ) (∑ )
∑ ( ) (∑ )
( )( ) ( )
̂
̂ ∑
̂
∑
( )
̂ ̂
̂ ̂⁄ ̂
( )
100 101 102
-5 -4 -3 -2 -1 0 1 2
ln(TBO)Weibull Probability Plotting Paper Severe Incidents
ln
(l
n
(1
/(
1
-M
e
d
ia
n
R
a
n
k
o
f
T
B
O
))
)W
e
ib
u
ll
P
ro
b
a
b
il
it
y
P
lo
tt
in
g
P
a
p
e
r
100 101 102 103
-8 -7 -6 -5 -4 -3 -2 -1 0 1 2
Failure Sequense for All Incidents
T
B
O
(
T
im
e
b
e
tw
e
e
n
F
a
il
u
re
s
f
o
r
A
ll
I
n
c
id
e
n
ts
̂
D.
Probability Distribution Function and
Hazard Rate Function Development
Weibull Probability Distribution function (PDF) is given by
( ) ( ) ( ) ( )
and Hazard function is given by
( ) ( ) ( )
( )
We have
( ) ( ) ( )
( )
( )
( ) ( )
( )
( )
( ) ( )
( )
( ) ( ) ( )
( ) ( )
( )
( )
III.
RESULTS AND DISCUSSION
S. No.
Type of Incident
Value of β (shape para meter)
Value of η (scale para meter)
Probability Distribution function f(x)
Hazard Rate Functio n h(x)
1 All 0.937 2.159 0.45 x-0.063 exp
(-0.46 x)0.937
0.45 x
-0.063
2. Minor 0.6618 3.363 0.295 x-0.3382
exp (-0.29 x)0.6618
0.29 x
-0.3382
3. Critical 0.7763 10.66 0.00074 x-0.223
exp (-0.09 x)0.7763
0.00074 x-0.223
4. Severe 0.8045 38.40 0.4x-0.195 exp
(-0.26 x)0.8045
0.4x
-0.195
5. Catastro
phic
0.4305 124.77 0.053x-569exp
(-0.008 x)0.4305
0.053 x
-0.569
IV.
CONCLUSION
The hazard function defined as the limit of the failure rate as the interval approaches zero. Thus the hazard function is the instantaneous failure rate of any incident type. The quantity h(x)dx represents the probability that a incident of particular category having time x will be took place within the small interval of time x to x+dx. Hazard function indicates the change in failure rate over the life of a population of point in time.
V.
REFERENCES
[1] Linn Iren Vestly Bergh, Siri Hinna, Stavroula Leka and
Aditya Jain (2014), “Developing a performance indicator for psychosocial risk in the oil and gas industry”, Safety Science Vol.62 PP. 98–106
[2] Seyhan Onder (2013), “Evaluation of occupational
injuries with lost days among opencast coal mine workers through logistic regression models”, Safety Science, Vol. 59 PP.86–92
[3] Xia Zhang, XiaoLi, and George Hadjisophocleous
(2013), “A probabilistic occupant evacuation model for fire emergencies using Monte Carlo methods”, Fire Safety Journal, Vol. 58 PP.15–24
[4] Eirik Bjorheim Abrahamsen, Frank Asche and Maria
[5] L. Kotek and M. Tabas (2012), “HAZOP study with qualitative risk analysis for prioritization of corrective and preventive actions”, Procedia Engineering, Vol. 42 PP. 808–815
[6] Wang Mingda, Chen Guoming, Fu Jianmin and Li
Weijun (2012), “Safety Analysis Approach of MFM-HAZOP and Its Application in the Dehydration System of Oilfield United Station”, Procedia Engineering, Vol. 43 PP. 437– 442
[7] J.Maiti, Vivek V. Khanzode, P.K. Ray (2009), “Severity
analysis of Indian coal mine accidents – A retrospective study for 100 years” Safety Science, Vol. 47 PP 1033-1042.
[8] J. Tixier, G. Dusserre, O. Salvi and D. Gaston (2002),
“Review of 62 risk analysis methodologies of industrial plants”, Journal of Loss Prevention in the Process Industries, Vol. 15 PP. 291–303
[9] Faisal I. Khan and S.A. Abbasi (2001), “Risk analysis of
a typical chemical industry using ORA procedure”, Journal of Loss Prevention in the Process Industries, Vol. 14 PP.43–59
[10] Faisal I. Khan and S.A. Abbasi (2000), “TORAP - a new
tool for conducting rapid risk- assessments in petroleum refineries and petrochemical industries”, Journal of Loss Prevention in Process Industries,. Applied Energy, Vol. 65 PP. 187-210
[11] Faisal I. Khan and S.A. Abbasi (1998), “Techniques and
methodologies for risk analysis in chemical process industries”, Journal of Loss Prevention in the Process Industries, Vol.11 PP. 261–277
[12] J.S. Arendt (1990), “Using Quantitative Risk