1
THE ULTRASONIC CHARACTERISATION OF SOLID-STATE BONDS
by
Amit Kumar Som, BSc, MSc
A Thesis Submitted for the Degree of Doctor of Philosophy
in the
Faculty of Engineering
UNIVERSITY OF LONDON
June 1991
Department of Mechanical Engineering University College London
Torrington Place London WC1E 7JE
ProQuest Number: 10610039
All rights reserved
INFORMATION TO ALL USERS
The qu ality of this repro d u ctio n is d e p e n d e n t upon the q u ality of the copy subm itted.
In the unlikely e v e n t that the a u th o r did not send a c o m p le te m anuscript and there are missing pages, these will be note d . Also, if m aterial had to be rem oved,
a n o te will in d ica te the deletion.
uest
ProQuest 10610039
Published by ProQuest LLC(2017). C op yrig ht of the Dissertation is held by the Author.
All rights reserved.
This work is protected against unauthorized copying under Title 17, United States C o d e M icroform Edition © ProQuest LLC.
ProQuest LLC.
789 East Eisenhower Parkway P.O. Box 1346
2
3 ABSTRACT
The ultrasonic characterisation of solid-state bonds, in particular diffusion bonds has been considered in this thesis. The study has concentrated on titanium sheet material diffusion bonded with similar materials on either side of the bond-line. A review of diffusion bonding, ultrasonic diffusion-bond non-destructive evaluation (NDE) and acoustic microscopy is presented.
A broadband Pulsed Digital Reflection Acoustic Microscope (PDRAM) with a centre frequency of 50 MHz has been designed and built as part of this study. The system is capable of imaging small flaws about 100 |im in diameter on the diffusion bond-line between two titanium plates typically 2 to 3mm thick. Calibration of the system has been conducted through the use of the optical concept of the Modulation Transfer Function (MTF) and evaluation of its various imaging modes have been presented.
4
ACKNOWLEGEMENTS
I would like to thank my supervisor Professor Leonard Bond who was a source of constant friendship, guidance and encouragement during my PhD.
Many friends and colleagues from universities and industry both in the UK and USA have contributed their help and most constructive ideas. They are too numerous to mention all of them but I would like to mention a special thanks to Dr. Nader Saffari of ARYA Technology Ltd.
I wish to thank the United Kingdom Science and Engineering Research Council and the Ministry of Defence for funding this work. In particular, I wish to acknowledge the help of Mr. Colin Gostello of the Royal Aerospace Establishment who has been the Ministry of Defence Contract Monitor for this project.
My interest in solid-state bonding was aroused out of extensive discussions between Mr Kevin Taylor of the Mil itary Aircraft Division (British Aerospace, Warton Aerodrome) and myself, and my grateful thanks to him for providing all the diffusion bonded samples for this project.
Thanks are due to Mr. John Maybury and Mr. Kevin Deeming of Cossor Electronics Ltd. for their help during the design, fabrication and testing of the gated peak detector board.
Most of all I want to thank my father Professor Ashoke Kumar Som who supported me in every way especially financially in the United Kingdom for the 4 years (1981 - 1985) as an Overseas Student prior to my postgraduate study. His faith and confidence in me was the major factor for my perseverance. No amount of thanks would do justice to the constant love and encouragement shown towards me by my mother M r s . Monica Som especially in the most difficult and important times. It is to my father and mother that I dedicate this thesis and all my efforts with much pride.
Finally a big "thank you" to my wife Suparna for all her love and understanding during the "writing up" period and to all her family for making 1990 a very happy year for me.
6 ige 3 4 10 20 22 26 30 32 34 34 42 43 45 46 53 59 67 70 76 80 TABLE OF CONTENTS
ABSTRACT
ACKNOWLEDGEMENTS LIST OF FIGURES LIST OF TABLES
BIBLIOGRAPHY OF PUBLICATIONS BY A.K. SOM
CHAPTER 1 INTRODUCTION 1.1 MOTIVATION
1.2 CONTRIBUTIONS 1.3 THESIS STRUCTURE
CHAPTER 2 BACKGROUND
2.1 SOLID-STATE BONDING 2.1.1 Introduction
2.1.2 Techniques and Processes 2.1.3 Mechanical properties of
diffusion bonded joints
2.1.4 Defect types in diffusion bonding 2.2 THE CHARACTERISATION OF DIFFUSION BONDS
2.2.1 Non ultrasonic NDE techniques
2.2.2 Experimental ultrasonic work to date 2.2.3 Theoretical ultrasonic work to date 2.3 ACOUSTIC MICROSCOPY
2.3.1 A review
2.3.2 Impulse vs. Gated toneburst excitation 2.3.3 Acoustic lenses
7 Page
CHAPTER 3 THE PULSED DIGITAL REFLECTION
3.1
ACOUSTIC MICROSCOPE (PDRAM)
DESIGN REQUIREMENTS AND FEATURES 86
3.2 THE SYSTEM 90
3.2.1 System control 94
3.2.2 The scanning rig 97
3.2.3 Ultrasonics 100
3.2.4 Digital data capture 101
3.2.5 The gated peak detector 101
3.3 SOFTWARE AND IMAGING
3.3.1 The acoustic imaging routine 102 3.3.2 Image manipulation and analysis 106
3.3.3 Imaging techniques 110
3.3.4 Time domain techniques 119
CHAPTER 4. SYSTEM CALIBRATION AND EVALUATION
4.1 INTRODUCTION 122
4.2 ULTRASONIC AND OPTICAL MTF
4.2.1 Basics of optical MTF characteriser 125
4.2.2 Assumptions 125
4.2.3 Differences between ultrasonic
and optical MTF 126
4.2.4 Ultrasonic impulse response for
evaluating ideal MTF 127
4.3 CONSIDERATIONS FOR EXPERIMENTAL DETERMINATION OF MTF AND ITS VERIFICATION
4.3.1 Factors affecting system MTF
measurements 130
4.3.2 Practical experimental procedure to determine MTF distribution at the exact focus using a horizontal
line scan 137
4.3.3 Characterisation of planes different
8 Page
4.4 COMPARISION OF THEORETICAL APPROXIMATION AND EXPERIMENTAL RESULTS
4.4.1 Theoretical approximations for comparision
with experiment 141
4.4.2 Experimental results 143
4.5 SUMMARY 149
CHAPTER 5 THEORETICAL TREATMENT
5.1 INTRODUCTION 151
5.2 COMPRESSION WAVES
5.2.1 Background 152
5.3 LEAKY RAYLEIGH WAVES 5.3.1 Background
5.3.2 Rayleigh wave interaction with welded
156
quarter-spaces 168
5.4 THE V(X) AND V(Z) TECHNIQUE 173
5.4.1 Application of V(x) to model evaluation 176
5.5 SUMMARY 184
CHAPTER 6 EXPERIMENTAL MEASUREMENTS 6.1 COMPRESSION WAVE MEASUREMENTS
6.1.1 C-scan measurement configuration 6.1.2 C-scan measurements on
187
diffusion bonded titanium 191
6.2 LEAKY RAYLEIGH WAVE MEASUREMENTS 6.2.1 Leaky Rayleigh wave measurement
configuration.
6.2.2 Acoustic and Optical images of diffusion
195
bonded titanium.
6.2.3 Leaky Rayleigh wave measurements on
197
9 Page
CHAPTER 7 ANALYSIS AND DISCUSSION OF RESULTS
7.1 Introduction 210
7.1.1 Analysis of images 210
7.1.2 Analysis of data and model evaluation 214
7.2 Discussion of results 222
CHAPTER 8 CONCLUSIONS AND RECOMMENDATIONS FOR FURTHER WORK
8.1 Conclusions 230
8.2 Recommendations for further work 232
APPENDICES
APPENDIX A : THE GP100 GATED PEAK DETECTOR BOARD 237 APPENDIX B : TABLE OF SOFTWARE 24 6 APPENDIX C : DEFOCUS OPTIMISATION BY BROADBAND V ( Z ) :
THEORY AND EXPERIMENT 247
APPENDIX D : DETERMINATION OF REFLECTION COEFFCIENTS
FROM V(X) DATA 257
APPENDIX E : METALLURGICAL INFORMATION ON SAMPLES 259 APPENDIX F : ELECTRON PROBE MICRO-ANALYSIS OF SAMPLES 260 APPENDIX G : THE LAYER RESPONSE MODEL 263 APPENDIX H : ACOUSTIC MICROSCOPE TRANSDUCERS 2 66 APPENDIX I : X-RAY RADIOGRAPH OF TITANIUM PLATE 2 67
10
Chapter 2.
2.1
2.2 * 2.3 2.4 2.5 2.6 2.7 2.8 2.9 2.10 2.11 2.12 2.13 2.14 2.15 2.16 2.17
LIST OF FIGURES
BACKGROUND
Development of the bond interface in solid- state diffusion bonding.
Principle of diffusion bonding. Three-sheet SPF/DB forming.
Conventional structure and integrated plan for door panels using SPF/DB
Inertia welded stainless steel 304L Confined tube closure welding
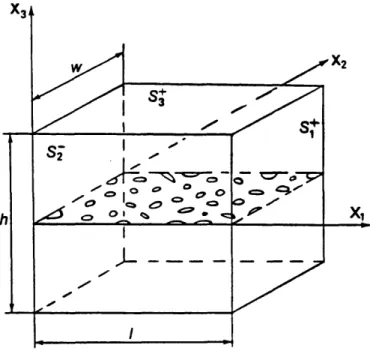
Cell containing distribution of cracks in x: x2 plane
(a) Definition of extra displacement (b) Geometry of ultrasonic setup
(c) Quasi-static model for the interface A reflection SAM: the basic system
Typical electronic circuitry for the reflection SAM
The scanning laser acoustic microscope Pulse coded acoustic microscopy
A pulsed acoustic microscope
(a) 3 typical transducer excitation pulses (i) Square wave
(ii) Half sine wave (iii) Spike or impulse (b) Pulse spectra
Gated toneburst spectra
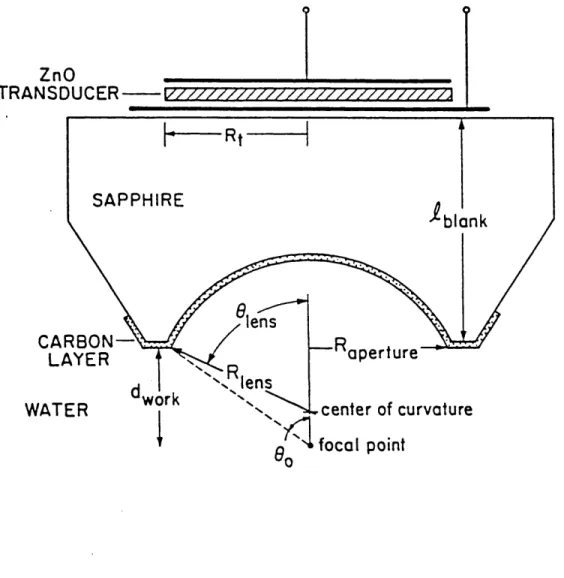
The acoustic microscope lens configuration 2 types of sensors used in acoustic
microscopy:
(i) circular transducer with a cylindrical lens
11
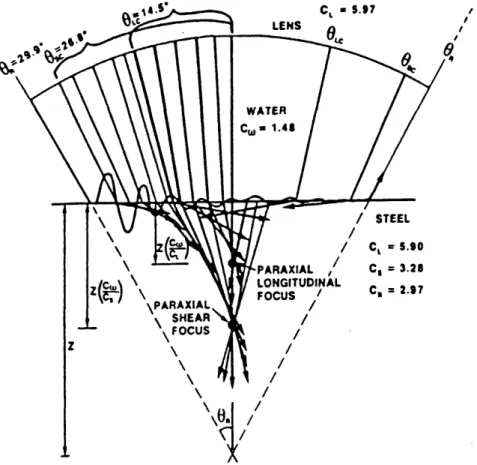
2.18 The angular spectrum for a water-steel interface showing the critical angles for longitudinal and shear waves, and the Rayleigh critical angle.
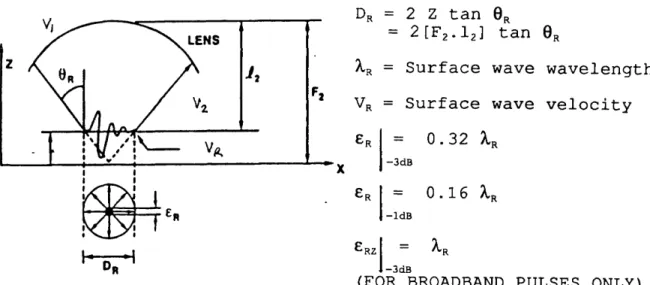
2.19 Summary of the equations and parameters for the lateral resolution of a focused beam in water or a high velocity specimen 2.20 A defocused lens transducer showing
generation of entry circle of surface waves 2.21 Summary of the equations and parameters for
the lateral resolution of a time resolved surface wave
Chapter 3. THE PULSED DIGITAL REFLECTION ACOUSTIC MICROSCOPE
3.1 Block diagram of the UCL PDRAM 3.2 Photograph of the UCL PDRAM in the
laboratory
3.3 (a) Layout of the various cards on the IBM expansion bus (b) Communication with the Motor-Drive-Controller Unit and Digital Oscilloscope via the General Purpose Interface Bus (GPIB)
3.4 Isometric view of gimbal mount/lens and water tank/tilt platform
3.5 Flowchart for acoustic imaging routine SCAN100
3.6 (a) Component geometry
(b) Return echo from various layers within component
(c) C-scan of component with histogram of image data
12 3.8 3.9 3.10 3.11 3.12
Chapter 4.
4.1
4.2
(a) B-scan configuration
(b) RF waveforms displayed as a "waterfall plot"
(c) RF waveforms as in (b) displayed in B-scan format
Top surface acoustic image of a British M penny coin
(a) Mouse femora S2-N1-LF (CONTROL) (b) Mouse femora S1-C2-LF (TREATMENT)
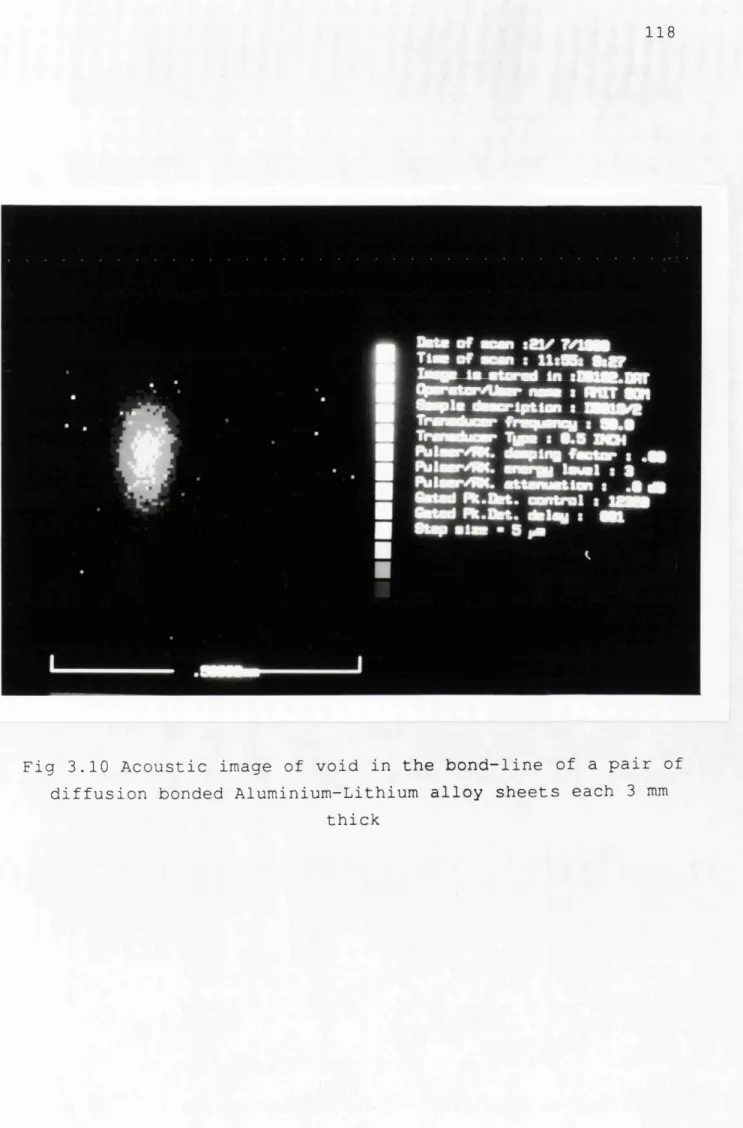
Acoustic image of void in the bondline of a pair of diffusion bonded Aluminium Lithium alloy sheets each 3 mm thick.
(a) Probe position for data capture
(b) RF data capture for signal reflected from subsurface cylindrical hole
Frequency spectrum for each of the pulses in Fig.3.11 (b)
(a) top surface
(b) reflection from top of cylinder (c) creeping wave component
SYSTEM CALIBRATION AND EVALUATION
A typical Optical Modulation Transfer Function (MTF)
Impulse response obtained using three
different detection methods, calculated using the line focusing case with a sine function.
(a) amplitude (b) intensity
(c) peak detection
(d) Influence of the three detection methods on the MTF
4.3 Needle used in calibration
(a) outline taken from photograph of the tip
(b) Ultrasonic image showing acoustic response of PDRAM with tip of needle set at the focus of a 50 MHz focused transducer.
4.4 (a) Comparision of experimental MTF obtained on titanium block with a 50 MHz transducer with various theoretical functions.
(i) 100 Mhz ideal MTF
(ii) Multifrequency ideal MTF (iii) 10 MHz MTF
(iv) Experimental MTF
(All theoretical data for incoherent optical lens)
(b) Frequency spectrum obtained from a pulse-echo measurement with a 50 MHz
5.84 mm focal length transducer, measured with zero damping factor. 4.5 Experimental Pulse-echo measurements with
a 50 MHz transducer on a glass plate with optimal damping.
(a) time domain response (b) frequency spectrum
4.6 Pulse-echo measurements with a 50 MHz transducer on a glass plate
(a) Measurement configuration
(b) Transducer output as scanned across edge of test block.
4.8
4.9
4.10
4.11
4.12
Chapter 5.
Pulse-echo measurements with a 50 MHz
transducer on a glass plate and the effect of variation in transducer height.
(a) Experimental configuration
(b) Normalised transducer output with height variations.
Transducer response, spherically focused. (a) Calculated 3-D amplitude distribution
for one quadrant of the beam cross section.
(b) Calculated LSF for peak, intensity and amplitude detected data.
(c) Calculated MTF for peak, intensity and amplitude detected data.
Experimental LSF
(a) Line spread function for 52.5 MHz (b) Smoothed LSF, obtained from (a)
Experimental Modulation Transfer Function at focus for the 50 MHz transducer,
filtered for 52.5 MHz. Full 3-D experimental MTF.
(a) 3-D MTF for various heights around the focus
(b) Contour plot for 3-D MTF for various heights around focus.
Acoustic image of electron microscope
copper support grid. Grid has 400 lines/inch, line width of 15 }im and 45 p.m square holes.
THEORETICAL TREATMENT 14 Page 140 142 144 145 146 148
5.1 Compression wave inspection: focused
versus planar transducers. 153
15 Page
5.3 Amplitude CR and CT curves for plane wave incidence on a perfect interface plotted versus impedance contrast
5.4 System of cartesian coordinates employed showing the incidence of a compressional wave on a free surface
5.5 A defocused acoustic transducer lens showing the existence of Leaky Rayleigh waves.
5.6 A typical V(z) curve for an AlSi bearing alloy
5.7 PLots of CR and CT versus frequency for angle of incidence:(a) and (b) 0° & 45°
(c) and (d) 75° & 89.5°
5.8 V(x) curve calculated for CR and CT values plotted in Fig 5.7 (a) with X=0°. Solid curve represents crack depth d=0.lA,R,
broken curve d=0.5XR and dotted curve d=XR. 5.9 Titanium V(x) curve for the 2 limiting
cases (1) No defect : CR = 0.0, CT = 1.0 (2) deep crack: CR= 0.4 exp(i0.6), CT = 0.0 5.10 Acquisition of broadband V(x) curve from
Titanium diffusion bonded sample
155
157
167
175
179
180
180
16 Page
Chapter 6
6.1
6.2
6.3
6.4
6.5
6
.
6. EXPERIMENTAL MEASUREMENTS
S:N ratio measurements made in the C-scan configuration using a focused transducer on diffusion bonded titanium
(a) Scan configuration
(b) with 0 dB receiver attenuation, 0 dB amplification
(c) with 15 dB receiver attenuation, 26 dB amplification
(a) The C-scan imaging configuration (b) Plan view of diffusion bond
(c) RF signal from bond-line showing S:N ratio
(a) Composite acoustic image (C-scan) of the entire titanium plate
(b) High resolution acoustic image of line-like feature about 3 mm in length on bond-line of plate in (a) (a) Bondline responses from various
regions of diffusion bonded titanium plate using compression waves
(b) System measurement configuration
Nomarski Differential Interference Contrast optical micrographs of diffusion bonded titanium samples.
(a) X 200 Sample M5 (acceptable) (b) X 200 Sample M5 (unacceptable)
Paraxial and Leaky Rayleigh wave components recorded from methanol/titanium system at an optimal defocus of 700 |im
Acoustic images of same area as Fig 6.4 (a) and (b)
(a) M5 (acceptable) X200 magnification (b) M6 (unacceptable) X200 magnification
17
6.8
6.9
6.10
Chapter 7. 7.1
7.2
7.3
7.4
Leaky Rayleigh wave images of diffusion bonded titanium.
(a) acceptable bond (b) unacceptable bond.
Leaky Rayleigh wave V(x) plots for diffusion bonded titanium
(a) acceptable bond (b) unacceptable bond
Leaky Rayleigh V(y) plots for diffusion bonded titanium.
(1) acceptable bond (2) unacceptable bond
(3) reference level from parent material
ANALYSIS AND DISCUSSION OF RESULTS
Comparison between plane wave model, FD model by Bond and Aristodemou (1988) and experimental measurements (this work) Numerical visualisation of a Ricker pulse of Rayleigh waves scattering from a 90° corner
Plot of bond strength vs. reflection coefficient for diffusion bonded
copper-copper samples bonded under various time and temperature conditions.
(a) Percentage of energy transmitted as a function of angle in polystyrene
(b) Percentage of energy reflected as a function of incident angle.
(a) Transmission coefficient for surface amplitude as a function of incident angle
(b) Reflection coefficient for surface amplitude as a function of incident angle.
Chapter 8. 8.1 APPENDICES A1 . A2. A3. A4 . Cl. C2 .
C 3 . C4 . C 5 . C 6 .
C7 .
Dl.
D 2 . F I .
CONCLUSIONS AND RECOMMENDATIONS FOR FURTHER WORK
Leaky Rayleigh wave scan of explosively bonded Aluminium - Lithium alloy
GP100 Block diagram
GP100 BNC connector description GP100 Setup configuration 1 GP100 Setup configuration 2
Flowchart for obtaining broadband-single frequency V(z) measurements with the UCL PDRAM
Reference signal for deconvolution (paraxial component of gb030) gated and padded with zeros.
Frequency spectrum of reference signal Time domain plot of complete RF waveform Broadband V(z) curve (0 - 100 MHz)
Variation of deconvolved spectra with defocus (a) 150 |im, 200 urn and 250 |im defocus
(b) 300 |im and 350 ^.m defocus
(c) 350 ^m, 400 |im, 450 |im and 500 Jim defocus Single frequency V(z) curve (32 MHz
component) for the methanol/titanium system over 500 |im defocus.
Paths traced out by surface waves in presence of a crack prior to detection.
(a) definitions: z=defocus, 0R = Rayleigh angle
(b) reflected ray for: 8x=2(z.tan 0R)/3 (c) reflected ray for: 8x=(z.tan 0R)/3 (d) reflected ray for: 8x=0
V(x) plot used in calculation of CR and CT Electron Probe Micro-Analysis (EPMA) across M5 (acceptable) titanium diffusion bond
19
F2.
Gl. G2 . G 3 .
1 1
.
1 2.
Page
Electron Probe Micro-Analysis (EPMA) across
M6 (unacceptable) titanium diffusion bond 261
The 3-layer system 264
3-layer system (Ti/water gap/Ti) 265 Ti/bond/Ti bond material with (a) 5%
acoustic impedance contrast (b) 10% acoustic
impedance contrast 265
Schematic of titanium plate ADB1 used for
LIST OF TABLES
Chapter 2. BACKGROUND
2.1 Mechanical properties of diffusion bonded joints
Chapter 5. THEORETICAL TREATMENT
5.1 Summary of results obtained for Rayleigh wave reflection and transmission
coefficients from welded quarter spaces by various workers.
5.2 Rayleigh wave reflection and transmission coefficients from welded quarter spaces by Bond and Aristodemou (1988)
Chapter 6. EXPERIMENTAL MEASUREMENTS
6.1 Statistics of the response obtained from different regions in titanium-titanium diffusion bonds when using compression wave measurements
6.2 Rayleigh critical angle (0R) for various water/solid combinations
6.3 The acoustic properties of water and methyl alcohol
6.4 Statistics for the response obtained from different regions in titanium-titanium diffusion bonds when using leaky Rayleigh wave measurements.
20 Page
43
172
172
193
196
197
21 Page
Chapter 7. ANALYSIS OF RESULTS
7.1 Reflection and transmission coefficient data for titanium-titanium diffusion bonds obtained from compression wave data
7.2 Reflection and transmission coefficient data for titanium-titanium diffusion bonds obtained from leaky Rayleigh wave data
215
BIBLIOGRAPHY OF PUBLICATIONS BY A. K. SOM
22
1) Som A K and Bond L J (1988) "High frequency scanning system". In IEE Colloquium Digest No.1988/30 SET Division. "Recent Developments in digital NDT design held at the Institute of Electrical Engineers
(1.3.88)
2) Som A K (1988) Conference Report on Quantitative Acoustic Microscopy. Held by the Royal Microscopical Society at Oxford University on 15th January 1988. ULTRASONICS 26(4) July 1988.
3) Som A K and Bond L J (1989) "Ultrasonic inspection of engineering ceramics". In Proceedings of the 27th Annual British Conference on Non-Destructive Testing. Portsmouth, 12-15 September 1988. Reliability in NDT. Edited by Brook C and Hanstead P D. Pergamon Press (Oxford) 1989.pp 235-248.
4) Som A K and Bond L J (1989) . "High frequency ultrasonic inspection". In Non Destructive Testing. Proceedings 12th World Conference on NDT. Amsterdam. The Netherlands. April 23-28 1989. Elsevier Science Publishers (Amsterdam) ppl661-1666
5) Som A K , Shiloh K and Bond L J (1989) . "High frequency transducer evaluation using modulation transfer function". In Advances in ultrasonic transducers and arrays. Paper 6.IEE Colloquium Digest No.1989/56, held at the Institution of Electrical Engineers
23 6) Som A K , Shiloh K and Bond L J (1989) . "Modulation
transfer function of high frequency ultrasonic transducers." In Proc. ULTRASONICS 1989, Madrid, Spain (July 1-7 1989) Butterworth Scientific, pp 730-735
7) Bond L J, Som A K and Taylor K J (1989) . "Diffusion bond inspection using a pulsed digital reflection acoustic microscope".In Proceedings, Review of Progress in Quantitative NDE. Vol9, Brunswick, Maine, USA. July 24 - 28, 1989. Plenum Press
(NewYork)
8) Shiloh K ,Bond L J and Som A K (1990). "The response and limits of detection of focused ultrasonic
transducers to single flaws and groups of flaws." In Proceedings, 8th International Conference ISQA, Jerusalem.
9) Som A K and Bond L J (1991). "Acoustic microscopy for diffusion bond inspection".In Research in Nondestructive Evaluation.(In preparation)
10) Som A K and Bond L J (1991) . "A Pulsed Digital Reflection Acoustic Microscope". In Measurement
Science and Technology (formerly J.Phys.E) (In preparation)
11) Bond L J , Som A K and Aristodemou E (1991). "Pulsed Rayleigh waves on welded quarter spaces." In
24 12) Bond L J, Chiang C H and Som A K (1991) "Acoustic
Microscopy for electronic materials." In Proceedings, Review of Progress in Quantitative NDE. Vol 11, Brunswick, Maine, USA. July 24-28, 1991. Plenum Press (New York) (In preparation)
13) Som A K, Broz J J, Bond L J and Greenberg A R (1991) . "Acoustic microscopy applied to the characterization of tail-suspension induced osteopenia in mouse femora." (Accepted as a Poster presentation at ULTRASONICS INTERNATIONAL'91,to be held at Le Touquet,France on 1-4 July 1991)
Chapter 1.
26
1.1 MOTIVATION
Over the past 20 years, a large number of structural problems have occurred in both civilian and mil itary aircraft components such as turbine engines with high costs both in human and financial terms. The role of Non-Destructive Evaluation (NDE) in inspecting and predicting failure in critical components has been widely documented by the aerospace community (AGARD (1985) AGARD (1988))
Various joining techniques are used in precision engineering. The NDE of one particular form of joining technology, that of the solid-state dr diffusion bonding between similar metallic alloys is considered in this thesis. A major advantage of using a solid state bonding technique is that it avoids many of the stress concentrations which occur in other joining processes (ASM Int. (1989), Garmong (1975)) and it is therefore increasingly being used in the aero-space and nuclear industries. However, ensuring the integrity of such joints is a difficult task. Hence there is a major need for methods which can be used to inspect diffusion bonded joints (ASM Int. (1989)). Current UK production of aircraft components using Super Plastic Forming / Diffusion Bonding (SPF/DB) technology include the hot-air ducts for the Tornado and access panels for the Airbus A310/A320.
A recent review of major contributions in the area of the measurement of the strength of these types of bonds reached the conclusion that physical principles preclude researchers from using one single technique that will uniquely measure bond strength in all cases (Thompson (1988)). The major points that emerged from this review are that there is the potential to exploit the relationship between the ultrasonic reflection and transmission coefficients to bond strength (Palmer et al.
27 many researchers working over a range of frequencies (Palmer et al.(1987), Sinclair et al.(1989), Thomas and Spingarn (1988)). However problems still remain and aspects of the ultrasound-bond interaction are not well understood. There remains the need to be able to non-destructively quantify "bond strength". Theoretical studies on the ultrasonic interaction with imperfect diffusion bonds have considered several models (Rose (1988), Sotiropoulos and Achenbach (1988), Nagy (1988)). These model based data have been supported by a body of experimental ultrasonic work (Palmer et al.(1987, 1988), Buck et al.(1989), Sinclair et al.(1989).
The use of ultrasonic C-scan methods such as the pulse- echo or through-transmission techniques for the automated inspection of in-service aircraft have been discussed and widely implemented by many workers in the aerospace industry (Sturrock et al.(1989), Sainz et al.(1989), Tracy (1989), Blondet and Molinero (1989) ) . These compression wave imaging systems, operating at relatively low frequencies of 20 MHz and less, are conventionally used to image the typically two-plate finished diffusion bonded structure, but they are only able to resolve regions of gross disbond.
The reasons for the limitations of these conventional ultrasonic systems include inadequate signal-to-noise ratio in the detected bondline signal, low resolution due to the low frequencies used and limited vertical discrimination in the systems that affect the quality of the final image.
When other NDE techniques are considered (ASM Int. (1989)) it is found that although micro-focus x-ray coupled with digital enhancement offers improved resolution and discontinuities as small as 50 |im have been detected (ASM Int (1989) ) , conventional radiography has not been able to provide the required quantitative information about bond
i
28
Optical techniques are currently used along with destructive examination to characterise diffusion bonds. For example, for two-plate structures, the quality of diffusion bonds fabricated from a particular "run" is determined by the time consuming process of cutting and mounting selected sections from the edge of the bonded two-plate structure as metallographic samples. These samples are mounted so as to provide the bond-line normal to the free surface. The samples are then, after polishing and etching, subjected to a qualitative optical classification at high magnification and on the basis of various visual pointers such the degree of grain growth across the bond-line, they are classified as "acceptable" , "borderline" or "unacceptable" bonds. Along with optical classification, destructive tests are carried out on smaller plate-like samples. It must be emphasised that no standards exist for the destructive testing of diffusion bonds. Most experimental determination of bond strength has considered ultimate tensile strength as a figure for bond strength. (Palmer et al.(1988)).
The motivation therefore, for this work was the need for a quantitative investigation of the use of high frequency ultrasound for inspection of diffusion bonds leading to an estimation of the bond strength. In this thesis, a two-fronted approach has been taken in characterising diffusion bonds through the development of a high resolution, broadband, ultrasonic, acoustic microscope operating with transducers with centre frequencies of approximately 50 MHz.
29 suitable half angles, the imaging of subsurface features by "leaky Rayleigh waves" is also possible. Acoustic images are a very useful tool in detecting areas of gross disbonds and individual features, but cannot provide any quantitative information about the quality of the bond .
1.2 CONTRIBUTIONS
30
The contributions of this study can be briefly summarised a s :
(1) A Pulsed Digital Reflection Acoustic Microscope (PDRAM) has been designed and constructed around specific requirements that include the material characterisation and imaging of a wide range of advanced materials such as ceramics and composites. The various imaging modes have been extensively tested.
(2) The system has been calibrated through the characterisation of commercially available ultrasonic lenses using the concept of Modulation Transfer Function from optics. A procedure for sizing the ultrasonic beam at focus has been presented and through the MTF, peak detection has shown to theoretically yeild a lower resolution image than power detection.
(3) The system has been applied to the particular problem of solid-state bonding in metallic alloys and conventional compression wave scans of diffusion bonded alloys have been conducted at high resolution of the order of 40 - 100 \im. Prior work in this field has concentrated either at low frequency (10 - 20 MHz ) or at very high frequency (2GHz) . The low frequency work has not been able to image small flaws of about 100 Jim in diameter. The very high frequency work has not been able to penetrate titanium plates 2-3 mm thick. By choosing the right system parameters, this work has been able to combine good lateral resolution (better than 45 |im) with good penetration into the material (2-3 mm) and adequate axial resolution of about 150 }J.m.
31 coefficients have been compared with both a. plane wave model and 01 finite difference model mentioned in (5).
(5) Compression wave interaction with a diffusion bond has first been considered as the simplistic case of plane wave
interaction on a perfect interface. This has been compared with results obtained in another study (Bond and Aristodemou
(1988)) from a Finite Difference (FD) Model predicting the reflection (CR) and transmission (CT) coefficients resulting from Rayleigh wave interaction with a system of welded quarter spaces.
During the course of this study two new observations were made and they can be summarised as follows:
a) Single point measurements of bond-line response have been observed to be inadequate for characterising large samples.
32 1.3 THESIS STRUCTURE
Chapter 2 provides a review of solid-state bonding techniques and their characterisation , both ultrasonic and non-ultrasonic methods. A review of acoustic microscopy is also provided.
The acoustic microscope has been designed with certain specific requirements in mind and these are discussed in the first part of Chapter 3. The system itself is then described and various examples of images taken in its various modes are provided along with an example of a time domain technique.
Chapter 4 is concerned with the calibration and evaluation of the system and this has been conducted using the optical concept of the Modulation Transfer Function (MTF).
The theoretical background to the ultrasonic techniques used in this thesis: compression waves and leaky Rayleigh waves is provided in Chapter 5. A brief review of work on the interaction of Rayleigh waves with welded quarter spaces including a finite difference formulation developed within the Ultrasonics Group at UCL is also provided.
Chapter 6 is concerned with the experimental measurements taken in the Compression wave and Leaky Rayleigh wave mode respectively. Acoustic and optical images of the same representative areas of diffusion bonded titanium are also provided and compared.
Both images and data are analysed in Chapter 7. Quantitative data predicted by the finite difference model is finally compared with experimental results obtained in
Chapter 6.
Chapter 2.
34 2.1 SOLID-STATE BONDING
2.1.1 Introduction
The technique of diffusion bonding (DB) is used to make high strength joints between metallic, non-metallic and dissimilar materials in components varying from electronic circuitry to aircraft structures. The development of the technique and its various uses particularly in advanced aerospace applications have been covered in a number of reviews (Fitzpatrick (1984), Beck and Winkler (1984) , Stephens and Swadling (1985). Dunkerton and Dawes (1985), Partridge et al.(1985), Partridge and Ward-Close(1989)).
The major thrust of the diffusion bonding work in the aerospace community has been directed towards titanium alloys (especially the most widely used 6% Aluminium 4% Vanadium alloy Ti-6A1-4V) and aluminium alloys (prompted by the development of metal matrix composites). Further interest in the use of diffusion bonding has been stimulated by its association with super plastic forming (SPF) as a combined process (SPF/DB) in the manufacture of high quality, low cost aerospace components (Beck and Winkler (1984), Weisert (1984), Holbein and Sahm (1984), Stephens and Swadling (1985)).
2.1.2 Techniques and Processes
Diffusion bonding (DB) can be divided into 2 techniques:
1) Diffusion welding : two metals are joined by pressure and temperature without melting. An interlayer foil or coating
may be used and the process is also referred to as solid-state DB or hot press bonding. Solid-state DB involves 4 mechanisms that take place roughly in 2 stages (Partridge and Ward-Close
(1989)) and they are:
surfaces of the 2 materials are shown in Figure 2.1
35
At the end of Stage 1, the bond interface consists of bonded areas separated by areas containing small voids and bonding in this stage is sensitive to stress and occurs much faster in the next stage: stage 2.
Stage 2: the third mechanism now takes place: diffusion followed by recrystallisation and grain boundary migration. This is the final stage of bonding and is essential for the development of high strength joints since it leads to the elimination of the planar grain boundary interface.
2) Diffusion brazing : two metals are heated to produce liquid at the bond interface via an interlayer foil or
coating. Pressure may or may not be used and the process is also referred to as liquid phase DB or activated DB (ADB) . This process is shown in Figure 2.2 as 4 stages (Adam and Steinhauser (1985))
36
Fig. 2.1 Development of the bond interface in solid-state Diffusion Bonding
1) single or double interlayer applied
2) Interlayer melts at T > 0.8 Tm matrix pressure 10 N/mm2
3) diffusion of interlayer, melting temperature lifts
4) result: a homogeneous bond: secondary grain structure of interlayer dissapears
37 A vacuum environment is preferred in order to maintain clean surfaces but in order to exploit the need for gas pressure as used in SPF/DB, an argon gas environment is also used.
An example of the 3-sheet SPF/DB process is given as Figure 2.3 (Stephens and Swadling (1985)). The 3 stages of applying the "stop off" (an insoluble coating which is applied to the mating surfaces in areas which are not required to be bonded) , pack bonding and forming with a gas at high pressure results in a structure that has a significant reduction in weight and in the "parts count".
An example of the large weight and cost savings gained by the introduction of SPF/DB is shown in Figure 2.4 where the conventional fabrication of the door panel of an aircraft fuselage consisting of 16 parts held together by 500 fasteners was replaced by a 2-sheet integrally stiffened SPF/DB assembly. (Dunkerton and Dawes (1985)). Current UK production of components using SPF/DB technology include the hot-air ducts for the Tornado, access panels for the Airbus A310/A320 and fan blades for the Rolls Royce RB211-535E4 engine.
In addition to the
two
main forms of joining metals outlined earlier, another solid-state bonding process that allows for the inexpensive joining of otherwise difficult-to- weld materials is inertial friction welding (Armstrong et al.C O R E S H E E T
S T O P O F F
c
B P A C K B O N D IN G
\
\
\
\
t t t t
F O R M IN G
39
Conventional structure
16 Parts 500 Rivets
r
z S L
Riveting
Integration plan
2
2-sheets
J = U
Diffusion bonding
(DB)
Fig.2.4 Conventional structure and integrated plan for door panels using SPF/DB
base material
heat affected zone ^pelted region
axis of rotation
Fig.2.5 Inertia welded stainless steel 304L
40 Another example of the use of solid-state bonding is provided by the nuclear industry in the resistance tube- closure welding or pinch welding process (Thomas et al.
(1986)). Solid-state bonding techniques eliminate many of the problems encountered in traditional fusion welds such as "hot cracking" and porosity. The pinch welding process is used mainly to reliably seal small stainless steel tubes and the process is illustrated in Figure 2.6.
9\p
* 5 C,
in
INq
tub® c7
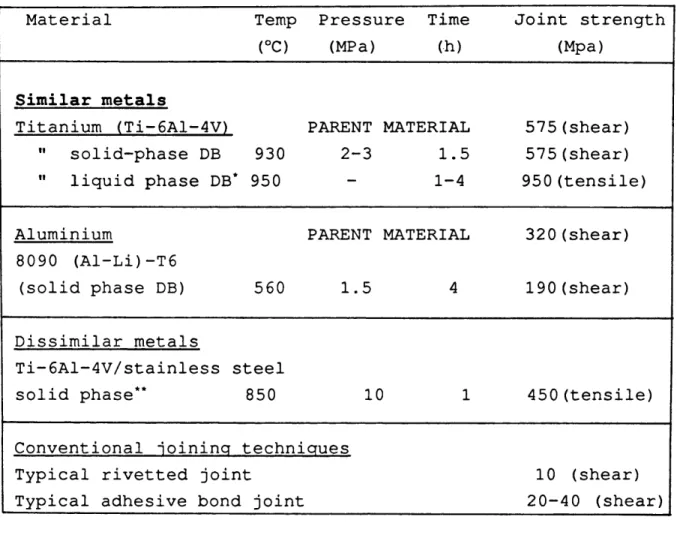
-42 2.1.3 Mechanical properties of diffusion bonded joints
43
Material Temp
(°C)
Pressure Time (MPa) (h)
Joint strength (Mpa)
Similar metals
Titanium (Ti-6A1-4V) PARENT MATERIAL 575 (shear) " solid-phase DB
" liquid phase DB* 930 950
2-3 1.5 1-4
575 (shear) 950 (tensile)
Aluminium
8090 (Al-Li)-T6
(solid phase DB) 560
PARENT MATERIAL
1.5 4
320 (shear)
190 (shear)
Dissimilar metals
Ti-6Al-4V/stainless steel
solid phase** 850 10 1 450 (tensile)
Conventional ioininc? techniaues Typical rivetted joint
Typical adhesive bond joint
10 (shear) 20-40 (shear) |
using Copper and Nickel interlayers using Vanadium and Copper interlayers
Table 2.1 Mechanical properties of diffusion bonded joints
2.1.4 Defect types in diffusion bonding
I
44 In determining which NDE method to use, it is necessary first to decide what kind of defect may be present.
DB joint defects fall into roughly 3 categories and these are:
1) Micro voids 2) Large voids
3) Intimate contact disbonds
Micro voids occur as a result of incorrect processing conditions and they have typical widths of 0.5 |im to 10 |im with diameters of around 15 p.m or larger with known constant depths (Tober and Elze (1985) ) . The size of defects is determined principally by the scale of roughness of the surfaces being bonded. The degree of surface roughness is dependent on the material and machining technique used. It has been shown that bonding becomes easier with finer surface roughness prior to bonding. As a result, due to the very fine scale of roughness involved in commercial machining techniques such as turning and grinding, the corresponding size of possible defects is extremely small compared with conventional welding defects (turning processes give a roughness height of about 2 |j.m while grinding about 0.5 |im. (Kapranos and Priestner (1987))
The cause of large voids/disbonds is most likely to be associated with argon gas entrapment eg. when bonding in an argon gas environment. Large void areas can also arise due to irregularities in the individual plates before the bonding process. Thin oxide skins, release agents used for SPF/DB (eg. graphite) and a combination of oxide/release agent with processing voids commonly lead to large voids (100 |lm or larger).
45 difficult to reliably detect and size because of the intimate nature of the materials.
2.2 THE CHARACTERISATION OF DIFFUSION BONDS
2.2.1 Non ultrasonic NDE techniques
Real time radiography coupled with microfocus X-ray source and digital image enhancement has been successfully used in detecting defects of 1mm in size (Alreja (1984)) and the claim has been made that defects down to 25 |im can be detected in titanium plates 5mm thick. The detectable defects have to be of unrealistically large sizes in order for this technique to be of any use.
The conductivity of a piece of metal is proportional to the area through which electrons can migrate. If there is a partial bond in the material, this migrational area will be reduced in the region of the bond and thus the resistance of the material will be greater than that of a perfect specimen of similar size. Using this technique, a large constant current is passed through two contacts down the specimen under test. The potential difference between points on the specimen surface is measured by 2 other contacts and the voltage drop along the length of the specimen containing the bond can be compared with an identical length of perfect material. There should then be a simple relationship between the difference in conductivity and the total bonded area. In practice however, Lodge and Briggs (1983) and Derby et al. (1983) have shown that above 7 0% bonding, the required sensitivity for this technique increases indefinitely. One serious problem with the technique is that the changes being observed are so small that they may be swamped by minute variations in experimental conditions or material properties.
46 accessible. This method is capable of revealing edge separations which may have occurred during bonding or subsequent processing. It also provides information when the unbonded areas extend to the surface of the detail parts, however, the method is ineffective when there is no path from the surface to internal defects.
2.2.2 Experimental ultrasonic work to date
Conventional ultrasonic testing of metals typically uses a frequency of 5 MHz, giving a wavelength of about 1mm in steel. The scattering due to a single void 50 |lm wide would be far too small to detect and unless the mean void - width to inter-void spacing is nearly unity, the bond would be transparent to this wavelength. Derby et a l . (1983) have tried to image diffusion bonds in steel using a gated toneburst excited transmission acoustic microscope at 140 MHz at which the wavelength in steel is about 40 |im.
There is a major problem in imaging polycrystalline materials with these wavelengths (and the toneburst excited system) at which ka « 1 (where k is the wave vector and a is a measure of grain size). There is a dappled appearance in the acoustic images due to multiple grain scattering and although this may contain useful information about grain size, it is an undesirable feature for bond inspection. This problem of grain scattering may be eliminated by using a lower frequency (Yue et a l . (1982)) where images taken at 60 MHz do not show the individual voids, but they do reveal gross unbonded areas.
47 strengths that are observed either during tensile testing or even accidentally during post-weld machining for example. When specimens do not have uniform bonding across the bond planes, the unbonded interfaces may be held in intimate contact via residual stresses.
One approach to this problem has been the ultrasonic interrogation of the bond plane and detection of the ultrasonic signal response combined with data reduction and pattern recognition algorithms for specimens deliberately manufactured with a range of strengths (Thomas and Spingarn
(1984, 1988), Thomas et a l . (1986, 1987)) .
The approach is briefly summarised as follows: samples were prepared with varying strength levels (destructively tested after collection of the ultrasonic data). Using ultrasonic transducers varying in frequencies from 30 MHz to 50 MHz, RF return echoes from the bondlines of each of the samples were captured and each sample was categorised either as a "test" or a "training" sample, each with its own RF waveform.
The training data was applied to evolve a classification algorithm and the test data was used to confirm the reliability of the algorithm. To describe quality of bonding, a classification scheme was chosen that was based on 4 quality levels from Class 1 (best weld possible) to Class 4 (a weld that holds together mechanically but has no ductility.) The procedure for extracting information from the ultrasonic waveforms included transforming the RF waveform into various time and frequency domains. Thirty three features were then extracted from the various domains, the optimal features were selected and then the quality of the bonds were classified with pattern recognition algorithms.
48 bonds but the underlying mechanisms for their behaviour were not discussed. The pattern recognition algorithms seemed to be somewhat dependent upon the materials from which the samples were fabricated, but all showed a good deal of commonality.
In a parallel study investigating tubing pinch welds, immersion focused probes with 35 MHz centre frequency and 2.54 cm focal lengths were used to scan the bond-lines in 304L stainless steel tubes (Rehbein et al.(1986), Rehbein et al.
(1987)). They observed that gross disbonds could be easily detected from changes in signals either reflected from or transmitted through the bond-line. Another observation made in this study was that signals that were "doubly transmitted" through the interface (ie. the back surface echo) showed a trend to lower values as the bond quality decreased.
The NDE of integrally fabricated turbine rotors where the turbine blades are either bonded to the disk in the manufacturing process or during rotor repair has been studied (Gray et a l .(1987,1988)) using both focused and planar transducers ranging in frequencies from 5 to 50 MHz. Three techniques emerged from this study as having good sensitivity to the bond. These included the use of critical angle longitudinal waves, leaky Rayleigh waves and "near-grazing incidence" longitudinal waves. It was found that a significant improvement in signal amplitude can be realised by inspection at angles near grazing incidence to the bond as compared to near normal incidence measurements. A secondary benefit claimed in this study was that the noise induced by the roughness of the component-surface was of lower relative amplitude.
49 In a series of studies conducted mainly on copper-copper diffusion bonds, broadband (2-15 MHz) focused probes were used to obtain contour plots of reflection coefficients from the interface (Palmer et 31.(1987,1988), Buck et al (1989)). Several tensile specimens were then cut from each diffusion bonded sample (keeping in mind its exact location on the original reflection coefficient contour map) and were then destructively tested to obtain their ultimate engineering stress which was then used as an indicator for the strength of the bond. When correlating the ultimate stress with the ultrasonic reflection coefficient, it was observed that the stress decreased monotonically with increasing values of reflection coefficient for a given surface roughness prior to bonding.
In addition to the tensile testing, slices perpendicular to the bond plane of each sample were mounted, polished and etched in order to carry out the determination of parameters such as the "fraction of bonded area" and the number of contacts or disbonds per unit area. Th e results obtained were used once again to test the "spring model" detailed in Section 2.2.3.
50 between steel alloys and aluminium alloys. The normalised frequency spectra for varying weld pressures showed certain potentials for identifying weld quality (it was found that generally the highest strength welds were made under conditions of greater pressure).
The bonding process may induce microstructural changes in the metal especially near the bond region (Rehbein et al.
(1987), Thomas et al.(1987)). One suggestion for the indirect monitoring of bond quality has been provided by Rose (1988) by the measurement of attenuation in IN100. If a sample is obtained with a single-phase material with equiaxed grains, then the attenuation a has been approximated in the Rayleigh
limit (Papadakis (1968)) as
a = Sk*a3 (2.1)
where a is the mean grain radius, k is the wave-vector and S is a material constant. Thus, at a fixed frequency, the attenuation is proportional to the radius cubed and is clearly sensitive to grain size. The results of the work suggests that attenuation might be used as a process control monitor for bond quality. A rise in attenuation during bonding might indicate excess grain growth and in an indirect manner, inappropriate bonding parameters. A detailed knowledge of the part’s metallurgy and of the bonding process is required for this scheme to be of practical use.
Addition to page 51
In a study by Weglein (1988), 200 MHz Rayleigh waves were utilised to scan the surface of a metallographic sample of Ti-6A1-4V cut normal to the bond-plane. A gated toneburst excited acoustic microscope was used. At a frequency of 200 MHz, the wavelength of Rayleigh waves in Titanium is 14.5 fim and hence this was also the approximate depth of penetration of the Rayleigh waves in the specimen. Acoustic scans were taken at 200 MHz and compared with optical micrographs of the same area and substantial image contrast variations in the bond area were achieved acoustically. The Acoustic Material Signature (AMS) method (Weglein (1985)) was then used to obtain quantitative determination of the average Rayleigh wave velocities in the 2 regions of the specimen: the bulk material and the bond. In its simplest form, the AMS records the variation of the detected transducer output magnitude as the transducer is gradually defocussed onto the specimen. The recorded output is obtained as a curve with a series of maximum and minimum points and the Rayleigh wave velocity can be related to the periodicity of these points. Measurements in the diffusion-bond region and in the bulk material indicated that a significant reduction in the Rayleigh wave velocity (about 11 %) had occurred in the region of the bond. The lower Rayleigh velocity suggested correspondingly reduced bulk moduli and consequently reduced strength in the bond region.
52 being the mode conversion due to shear waves. A signal processing technique known as cepstral analysis was used to detect the periodicity within the waveforms and thus remove their effect from the information originating from the bond. An example of using the technique on an actual defect is provided.
2.2.3 Theoretical ultrasonic work to date
53
Various workers have considered the diffusion bond region to be quite complex containing discrete features. One such model that shall be referred to as the "microcrack model" provides analytical solutions for the reflection and transmission coefficients assuming that the bond plane contains a distribution of microcracks. The other model shall be referred to as the "distributed spring model" where the interface is represented by a distributed spring determined by the change in static compliance of the medium with respect to one with a perfect interface. The model provides a description of the contact topology and predicts the reflection and transmission coeffcients from a diffusion bond line.
54
55 A plane time-harmonic wave u1 is incident on the cracked plane and is expressed as:
u 1 = UQ p exp(iJcL p.x) p - (0,0,1) (2.2)
For longitudinal waves:
«_ c = (X + 2 n) (2.3)
/r =— L r r* =L ' “ ' L
The amplitude factor uQ and the angular frequency CO characterise the incident plane wave while the Lame constants X, fi and the density p characterise the elastic solid.
For this incident plane wave, the reflection coeffcient CR for the distribution of cracks has been given by Sotiropoulos and Achenbach (1988) to have the form:
-i / an 1 /
CD =
■
-Mmnv
-
■
#
where :
u0 = the amplitude factor N= the number of cracks
N = N/l.w = the number of cracks per unit area
V n = the crack opening volume for the nth crack and is given by:
= A nu3 (*1#$ 2)dAt (2.5)
where:
An = the area of the nth crack
56 The transmission coefficient CT may then be calculated from:
CT = 1 - CR (2.6)
Similar expressions for shear waves and varying crack sizes, shape and crack spacings are also presented but they shall not be discussed here. The basis of the model is that in all cases, CR and CT are derived in terms of the dimensions of the cracks.
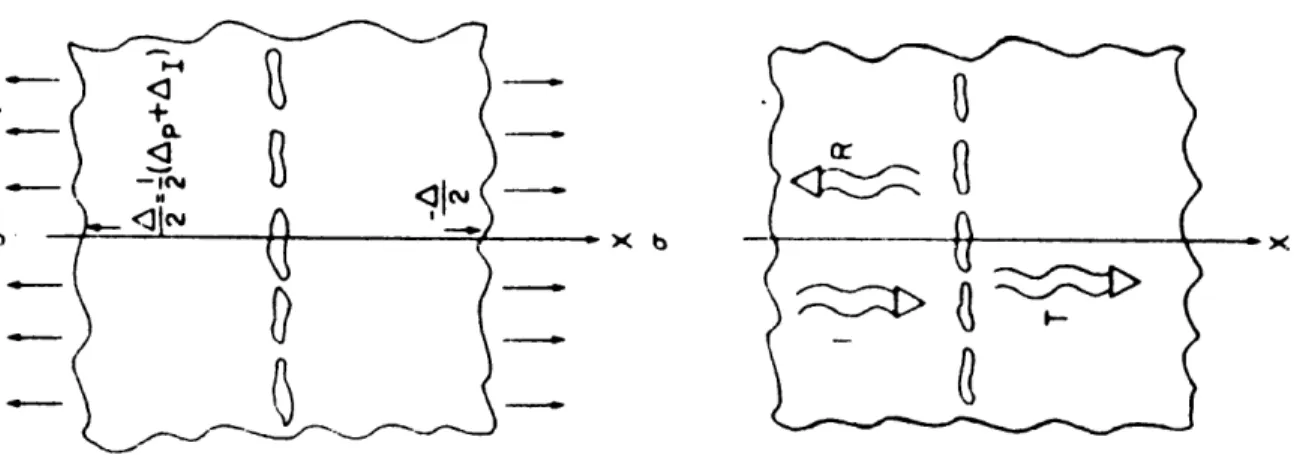
The "distributed spring model" (Baik and Thompson (1984)) shall now be discussed. When a tensile load a is applied to an elastic solid containing a planar collection of cracks or voids, the farfield displacement that would occur in the absence of the interface will be increased by local deformations at the interface. This can be seen from Figure 2.8 (a). When the load o is applied, the relative displacements of 2 points far from and on opposite sides of the interface can be written as the sum of the displacements A p which would have existed had the material been "perfect" plus the extra displacement due to the local deformations in the vicinity of the interface. If this interface contains cracks or pores, Ax>0 and for inclusions, A x can be positive or negative depending on the inclusions' shape and their elastic modulus with respect to the half spaces.
57
~ x b
Fig.2.8 (a) Definition of extra displacement (b) Geometry of ultrasonic setup
m
x=0
X
58
The interfacial stiffness K may be defined as
K = ^ (2.7)
and this may also be taken to be the stiffness of the distributed spring which, if used to join two half spaces of the original material, would reproduce the static displacement. (K can be evaluated from standard solutions for for a variety of interfacial conditions (Baik and Thompson (1984)). Figure 2.8 (b) illustrates the scattering of ultrasound from the same interface.
Once again, a time harmonic plane wave is assumed to be converted into a transmitting and a reflected wave and if the wavelength X of the ultrasonic energy is sufficiently large with respect to the contact separation, the scattering properties of the interface could be considered to be related to the response to a static load as in Figure 2.8 (a). The interface can then be modelled to be represented by the combination of spring and mass as shown in Figure 2.8 (c) and is known as the "quasi-static model" or the "distributed spring model" for an interface. In order to correctly reproduce the static deformation, the spring stiffness per unit area must be given by (2.7)
59
jcj (Z/2k - m/2Z)
(
2.8)(l-/no)2/4ic) + jfo> (Z/2k + m/2Z)
and
(1 + /no)2/4K)
(2.9)
(l-/na>2/4K) + jo) (Z/2k + m/2Z)
It must be stressed that for the quasi-static approximation to be valid, the resonance frequency of the spring-mass combination must obey the following relationship:
The stresses associated with the ultrasonic wave should also be sufficiently small so that the degree of contact at the
interface does not change during the stress cycle.
2.3 ACOUSTIC MICROSCOPY 2.3.1 A review
Since the underlying research and development behind the acoustic microscope has been reviewed in a number of excellent papers (Quate et al.(1979), Ash (1980), Nikoonahad (1983), Wickramasinghe (1984), Atalar and Hoppe (1986)), only a concise account shall be presented here.
The basic idea of an acoustic microscope was first put forward by the Russian scientist S. Ya Sokolov who realised that acoustic waves in water at gigahertz frequencies had wavelengths comparable to that of visible light but due to the lack of technology in generating such high frequencies at that time, he demonstrated a system operating at 1 MHz (Sokolov (1949)). After Sokolov's initial idea, many forms of acoustic microscope imaging have been explored during the last 40 years. A major advance however was the invention of the
60
scanning acoustic microscope (SAM) operating in the reflection mode as illustrated in Figure 2.7 (Lemons and Quate (1974)).
In this configuration, the object is immersed in a liquid (usually water) and placed at the focal plane of the acoustic lens. A piezoelectric transducer bonded to one end of the lens buffer rod converts the transmitted RF pulses into acoustic pulses which are bought to a focus at the focal plane of the lens. These acoustic pulses are incident upon the object and the reflected pulses are collected by the lens and the transducer converts them back into electrical pulses, which after detection, provides a video signal for display purposes. The acoustic pulses reflected by the object are modulated both in phase and amplitude . The lens is scanned over the entire field of view in a raster manner and an image is built up point by point. The lens is mounted on a precision translation stage with 3 degrees of freedom X,Y and Z where X and Y provide horizontal movements for locating the lens on the required field of view to be imaged and the vertical Z movement is used to focus the lens. The electronics of the system are shown in block diagram form in Figure 2.8
61
Mechanical ,*T-scan
/
/
Lens
Receiver Transmitter
Scan generator
Oisploy system
Object
Fig.2.9 A reflection SAM: the basic system
Lens
Low noise amplifier To z modulation
of TV monitor
Video amplifier
Isolator Pm switch Pm switch
Isolator
Sample and hold Timing electronics
62
A CW signal generator acts as the source and frequencies initially used were in the 1 GHz region. The output is pulsed by a series of cascaded PIN switches. On the detection side, a time gate suppresses the echoes from the surface of the lens and other unwanted signals. The signal from the object is subsequently amplified by a high gain amplifier. The baseband pulses are then "square law" detected and then further amplified. The pulses are finally fed into a sample-and-hold or a boxcar integrator circuit at the output which is the last stage before the display.
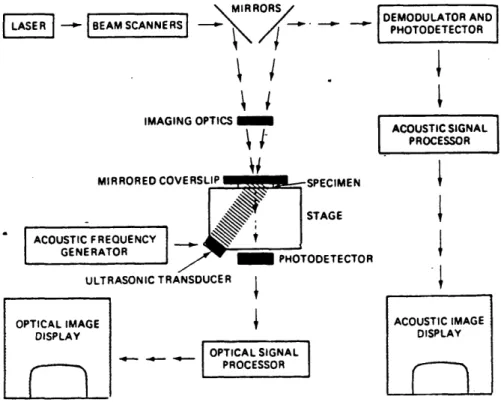
Another form of acoustic microscopy is the scanning laser acoustic microscope (SLAM) (Kessler and Yuhas (1978)). In the SLAM, the body of the sample under examination is illuminated by an unfocussed beam of acoustic energy and any inhomogeneity in the path of the acoustic beam eg. a defect causes the scattering and interference of the acoustic radiation. The scattering and interference show themselves as ripples on the surface of the sample and is recorded with a rapidly scanned focused laser beam. A diagram of the SLAM is shown as Figure 2
.
1 1.
LASER BEAM SCANNERS
IMAGING OPTICS MIRRORS
M
\
I
W
7T
W
MIRRORED COVERSLIP SPECIMEN
STAGE ACOUSTIC FREQUENCY
GENERATOR
PHOTODETECTOR ULTRASONIC TRANSDUCER
OPTICAL IMAGE DISPLAY
OPTICAL SIGNAL PROCESSOR
DEMODULATOR AND PHOTODETECTOR
ACOUSTIC SIGNAL PROCESSOR
ACOUSTIC IMAGE DISPLAY
Fig. 2.11 The scanning laser acoustic microscope
Pm switch
Compressor Expander
Lens
64
One of the problems associated with imaging arises due to the high impedance discontinuity at the interface between
the coupling fluid and the object under test. This greatly reduces the fraction of acoustic energy transmitted into the solid. Another problem is that the defect to be imaged is usually very close to the surface of the solid and hence the defect pulse arrives very shortly after the interface pulse and hence in order to discriminate against this interface pulse, broadband transducers have to be used that are capable of transmitting very short acoustic pulses. This further reduces the signal/noise ratio in the image.
One of the techniques of improving the signal/noise in such situations has been described ( Nikhoonahad et al. (1985)) which uses coded pulses for transmission followed by a matched filter for reception. The basic idea is shown in Figure 2.12.
An impulse is converted by a SAW delay line designed to expand to a long chirp pulse. At the receiver side, another SAW dispersive delay line this time compresses the long chirps reflected from different planes of the object to narrow pulses at the centre frequency of the SAW filters. The important concept here is that the noise, which is random in nature is not compressed. After time gating and amplification, the signal is converted into an image. Due to the wide input pulses used on transmission, it is possible to supply more energy per pulse using such a system as compared with the conventional SAM. The improvement in the signal/noise ratio can be shown to be the product of the pulse duration time T and the bandwidth B.
65 0.5 - 4.0 GHz and bandwidths from 0.5% to 1.0%). Owing to the high velocity in the solid, the image pulse which comes from the plane of interest arrives very soon after the surface echo. To obtain time gated imaging from a subsurface plane, the length of the acoustic pulse in the specimen should be shorter than twice the depth of interest.
Using the narrowband pulse methods mentioned so far, the image pulse interferes with the surface pulse and the final contrast in the image is effectively an interference micrograph of both surface position and materials properties that include any phase or attenuation modulation imposed upon the signal during its transit through the material.
In order to avoid these complications, narrow RF pulses are used so that images are now formed by displaying the amplitude of broadband acoustic pulses (with centre frequencies of between 10 to 100 MHz and bandwidths ranging from 80% to 120%. This forms the basis of the mode-of- operation of the Pulsed Digital Reflection Acoustic Microscope (PDRAM) designed and used in the study of solid-state bonding in this thesis.