FUZZY LOGIC APPLICATION IN GREEN TRANSPORT -
PREDICTION OF FREIGHT TRAIN ENERGY CONSUMPTION
Jovana Ćalić1, Milica Šelmić2, Dragana Macura3, Miloš Nikolić4
1,2,3,4 University of Belgrade, Faculty of Transport and Traffic Engineering, Belgrade, Serbia Received 14 March 2019; accepted 08 April 2019
Abstract: Rail freight transport is one of the most preferred modes of green transport since it emits three times less CO2 and particulates per ton-mile than road transport. Train energy consumption is the biggest issue related to rail traction costs. Data about freight trains energy consumption per year are not possible to define precisely, so it is convenient to use fuzzy logic as a tool for data prediction. In order to predict it, we provide Wang - Mendel method for combining both numerical and linguistic information into a common framework – a fuzzy rule base. Relevant input variables are: freight train kilometers, average freight trains weight and non-productive kilometers. The output variable from the defined fuzzy logic system is average energy consumption per year for rail freight transport. The proposed model is applied and tested on real data collected in the Republic of Serbia.
Keywords: train energy consumption, rail freight transport, prediction model, Wang- Mendel method, fuzzy rules.
2 Corresponding author: [email protected]
1. Introduction
The term green logistics represents all efforts to manage and minimize the ecological impact of logistics activities. The main aim of this concept is moving and delivering goods with the lowest cost, but with the highest standards and minimal environmental impact.
In that sense, rail freight transport is one of the most preferred modes of transport since it emits three times less CO2 and particulates per ton-mile than road transport. Besides
these ecological benefits, rail transport is the most cost-effective mode of transport.
Table 1
Average External Costs - EU-27 Member States (Periods: 2000 and 2008) [€/tonne km] INFRAS/IWW, 2004 CE/INFRAS/ISI, 2011
for 2000 for 2008
HDV 71.2 34
Road freight total 87.8 50.5
Rail freight 17.9 7.9
Inland waterways 22.5 11.2
Source: CE Delft, Infras, Fraunhofer ISI, 2011.
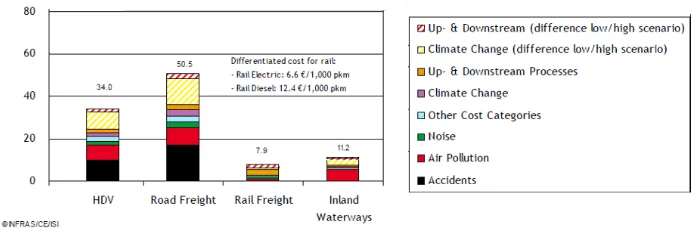
Fig. 1 shows a comparison of the external cost road and inland waterway modes of transport with the external cost of rail transport. Fig. 1 gives a ration of these costs. One can notice that ration for HDV (heavy duties vehicles) is increased from 3.98 in 2000 to 4.3 in 2008.
The biggest difference in the rations is for road freight total (from 4.91 in 2000 to 6.39 in 2008). Rations for inland waterways are the smallest in the both years (1.26 in 2000 and 1.42 in 2008). Fig. 2 gives a structure of external costs in 2008.
Fig. 1.
Average Cost Ration Compared to Rail (Freight Transport) Source: CE Delft, Infras, Fraunhofer ISI, 2011.
Table 1 and Fig. 1 and 2 show the advantages of the railway transport mode, which lead to an evident growth in rail freight logistics such as: cheap transport when compared to other modes of transport; more efficient as it allows larger volume of cargo transport to long distances; the transport of goods by train reduces the amount of fuel and emissions;
Fig. 2.
Structure of External Costs (Freight Transport for 2008) Source: CE Delft, Infras, Fraunhofer ISI, 2011.
The objectives of UIC (The International Union of Railways) are the rail share of freight land transport to be equal with the road and reducing specific average CO2 emissions from train operations by 50% reduction by 2030. A consequence of these objectives is the energy consumption increasing. Train energy consumption is a basic and the biggest issue related to the rail traction costs. Data about freight trains energy consumption per year are not possible to define precisely, so it is convenient to use fuzzy logic as a tool for data prediction. In a defined problem, fuzziness appears due to the lack of ability of exactly predicting certain values.
In this paper, the model for train energy consumption prediction is developed. In order to forecast freight train energy consumption per year, we provide Wang-Mendel method for combining both numerical and linguistic information into a common framework – a fuzzy rule base. Relevant input values are: freight trains kilometres, average freight trains weight, non-productive kilometres. The output value from a defined fuzzy logic system is average energy consumption per year for rail freight
transport. The proposed model is applied and tested on real data collected in the Republic of Serbia.
The paper is organized as follows. After Introduction, in Section 2, brief literature review is given. The developed model for determination of electric energy consumption for freight trains traction is presented in Section 3. Section 4 is dedicated to the case study, i.e. to the application of presented model on Serbian railway network. Last Section presents conclusions and future research directions.
2. Brief Literature Review
importance of input variables and proposed an algorithm for solving pattern recognition problems. Chen et al., (2007) emphasized that Wang Mendel rule generation method is the one of the earliest algorithms, but with one disadvantage. This method selects the rules with the maximum degree, without taking into consideration other conflicting rules. The authors compared three methods, and the main conclusion of the paper is that the weighted mean method has the best robustness and error-tolerance, consequently this approach is suitable for extracting rules from the real data with noise. The results obtained by Yanar and Akyurek (2011) indicated that Wang Mendel method provides better starting configuration for simulated annealing compared to fuzzy C-means clustering method.
Wang Mendel method was used for energy consumption forecasting in Jozi et al.,
(2017). Results showed that the proposed method using the combination of energy consumption data and environmental temperature is able to provide more reliable forecasts for the energy consumption than several other methods experimented before, namely based on artificial neural networks and support vector machines. Authors Yang
et al., (2010) presented an improved Wang Mendel method for electric load forecasting. They combined this approach with particle swarm optimization.
3. Model for Prediction of Electric Energy
Consumption for Freight Trains Traction
Electric energy consumption for freight trains traction depends on var ious parameters such as: the utilization factor of the overhead line and the electrical substations, the power of the locomotive, the corrected virtual coefficient, train speed, the length of the section and the specific electricenergy consumption per power. Since we do not have access to all these data, we apply Wang-Mendel method (Wang and Mendel, 1992) on the data which are available.
In order to predict the consumption of electric energy for the traction of freight trains on an annual basis, we take into account the following:
• Input variables:
1. Trains kilometres -TK [km] - It represents the number of kilometres that all electric locomotives passed by hauling freight trains, during one year. The greater the number of kilometres travelled, the greater the consumption of electric energy. Data are given annually.
2. Average weight of trains - AWT [tonne]
-It provides information on how much a freight train is loaded on average. Electric locomotive hauling heavy freight trains consumes more electric energy. Data are given annually.
3. Non-productive kilometres - NPK [km]
-The number of kilometres travelled by electric locomotives when they are out of the traction, or when they are not at the front of a train. Data are given annually.
• Output variable:
1. Average energy consumption - AEC [kWh]
- It represents the amount of electric energy consumed by all the locomotives while they performed freight trains traction. Data are given annually.
variable (Table 2). As it can be noticed each
set of desired input-output data is given in the form of: {(x1 (1), x
2(1), x3(1); y(1)), (x1(2), x2(2),
x3(2); y(2)), …, (x1(8), x2(8), x3(8); y(8))}.
Table 2
Values of Input and Output Variables, in the 2007-2014 period
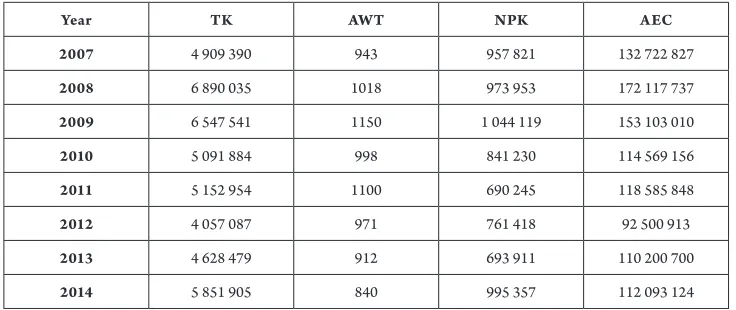
Year TK AWT NPK AEC
2007 4 909 390 943 957 821 132 722 827
2008 6 890 035 1018 973 953 172 117 737
2009 6 547 541 1150 1 044 119 153 103 010
2010 5 091 884 998 841 230 114 569 156
2011 5 152 954 1100 690 245 118 585 848
2012 4 057 087 971 761 418 92 500 913
2013 4 628 479 912 693 911 110 200 700
2014 5 851 905 840 995 357 112 093 124
Source: data collected in the Republic of Serbia
In the first step of Wang Mendel method, input and output spaces are divided into fuzzy regions. Assume that the domain intervals of x1, x2, x3 and y are [x1-, x1+], [x2-, x2+], [x3-,
x3+] and [y-, y+], respectively. We divide each domain interval into 2N+1 regions (N may vary from variable to variable) and assign each region a fuzzy membership (Table 3).
Table 3
Variable Domains
Variable Domain
Trains kilometres [in million km] [3.5, 7]
Average weight of trains [in tonnes] [700, 1300]
Non-productive kilometres [in thousand km] [500, 1200]
Average energy consumption [in million kWh] [80, 180]
The domain division for the variable “Trains kilometres” has been done into 3 fuzzy sets (Fig. 3): • Small [3.5, 3.5, 4, 5] - represents a small
volume of the freight train kilometres;
• Medium [4, 5, 6] - represents a medium volume of the freight train kilometres; • Large [5, 6, 7, 7] - represents a large
Fig. 3.
Membership Functions of “Trains Kilometres” Fuzzy Variable
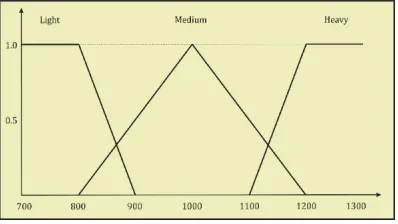
The domain division for the variable “Average weight of trains” has been done in same way. Domain division is shown in Fig. 4: • Light [700, 700, 800, 900] - represents
a light weight of freight trains;
• Medium [800, 100, 1200] - represents a medium weight of freight trains; • Heavy [1100, 1200, 1300, 1300] -
represents a heavy weight of freight trains.
Fig. 4.
Membership Functions of “Average Weight of Trains” Fuzzy Variable
For the variable “Non-productive kilometres”
domain has been divided in three fuzzy sets (Fig. 5):
• Small [500, 500, 600, 800] - represents a small amount of non-productive locomotive kilometres;
• Medium [600, 800, 1000] - represents a medium amount of non-productive locomotive kilometres;
Fig. 5.
Membership Functions of “Non-Productive Kilometres” Fuzzy Variable
Finally, it is necessary to cover a domain for
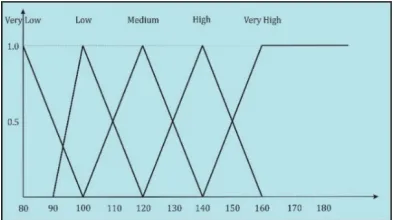
“Average energy consumption” fuzzy variable (Fig. 6) with the membership functions. The division has been carried out on 5 intervals. • Very low [80, 80, 100] - represents a very
low energy consumption.;
• Low [90, 100, 120] - represents a low energy consumption;
• Medium [100, 120, 140] - represents a medium energy consumption;
• High [120, 140, 160] - represents a high energy consumption;
• Ver y High [14 0, 160, 180, 180] - represents a ver y high energ y consumption.
Fig. 6.
Membership Functions of the Output Variable “Average Energy Consumption”
In the next step of Wang-Mendel method, the generation of the fuzzy rules should be done, based on numerical data. For each of the input-output pair, it is necessary to determine the membership degree to fuzzy sets that cover some of the intervals. After the membership degree determination,
the considered values join that fuzzy set to which they belong with the highest membership degree (Teodorović and Šelmić, 2012).
(x1(1), x2(1), x3(1); y(1)) =›[ x1(1)(4.9 in Medium, max), x2(1) (943 in Medium, max), x3(1) (957.821 in Large, max); y(1) (132.7 in High, max)] =› Rule 1.
Rule 1: IF x1 is Medium and x2 is Medium and x3 is Large, THEN y is High After this procedure we made 8 fuzzy rules, the one for each input-output pair of data.
The fuzzy rules obtain from numerical data are given below:
• If “TK” is Medium and “AWT” is
Medium and “NPK” is Large then “AEC” is High;
• If “TK” is Large and “AWT” is Medium
and “NPK” is Large then “AEC” is Very High;
• If “TK” is Large and “AWT” is Heavy and “NPK” is Large then “AEC” is Very High; • If “TK” is Medium and “AWT” is
Medium and “NPK” is Medium then “AEC” is Medium;
• If “TK” is Medium and “AWT” is Heavy
and “NPK” is Small then “AEC” is
Medium;
• If “TK” is Small and “AWT” is Medium
and “NPK” is Medium then “AEC” is
Low;
• If “TK” is Medium and “AWT” is
Medium and “NPK” is Small then “AEC” is Medium;
• If “TK” is Large and “AWT” is Light and “NPK” is Large then “AEC” is Medium;
Next step is to check all obtained rules and to eliminate same or conflict rules, i.e. rules that have same IF part but a different THEN part. In this example all defined rules are correct, there are no conflict or same rules.
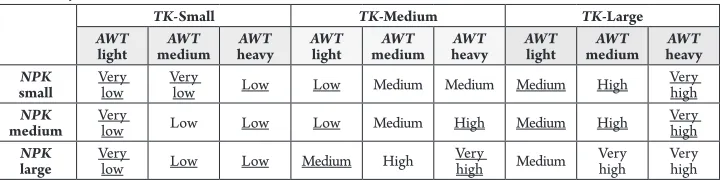
Most often, available pairs of input-output data are not sufficient to “cover” all the different situations that can happen in a particular system. Fuzzy rule base is more complete if the number of different input-output data pairs is bigger. In order to obtain better results fuzzy rule base may be amended with additional fuzzy rules generated by an expert. The final fuzzy rule base in the case of prediction of freight train average energy consumption in Serbia is shown in Table 4. Fuzzy rules generated by the experts are underlined.
Table 4
Final Fuzzy Rule Base
TK-Small TK-Medium TK-Large
AWT
light mediumAWT heavyAWT AWTlight mediumAWT heavyAWT AWTlight mediumAWT heavyAWT
NPK
small Very low Very low Low Low Medium Medium Medium High Very high
NPK
medium Very low Low Low Low Medium High Medium High Very high
NPK
4. Case Study – Results and Discussion
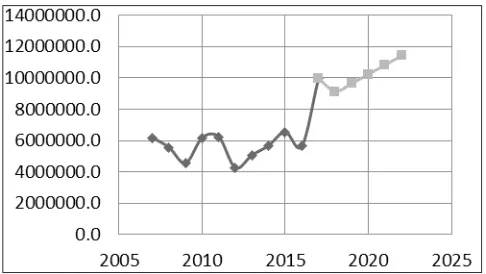
Considering the Serbian railway network, there is only 1278.7 km electrified railway lines that are one-third of the total network length (3735.8 km). The forecast of freight
traffic on Serbian railway network (Fig. 7) for period 2018-2022 shows an increase in freight traffic (Ćalić, 2018), and it is considered that most of the forecasted transport of goods will be carried out on electrified lines, as they are main lines.
Fig. 7.
Forecast Freight Train Transport for Period 2018-2022, on Serbian Railway Networks
In order to test our model we apply the following input data (for year 2013):
• TK = 4.628 million kilometres;
• AWT = 912 tonnes;
• NPK = 693.911 thousand kilometres.
After defuzzification process, for which the centre of gravity is used, the output value is obtained: AEC is 109 million kWh.
Table 5 shows comparison of the results between real data and the one obtained from Wang - Mendel method.
Table 5
Comparison of the Results
Year TK [mil km] AWT [tonne] [thousands of NPK
km] AEC [mil kwh]
AEC using Wang Mendel [mil kwh]
Deviation [%]
2007 4.909 943 957.821 132.723 133 0.21%
2008 6.890 1018 973.953 172.118 164 -4.95%
2009 6.547 1150 1 044.119 153.103 163 6.07%
2010 5.092 998 841.230 114.569 128 10.49%
2011 5.153 1100 690.245 118.586 125 5.13%
2012 4.057 971 761.418 92.501 103 10.19%
2013 4.628 912 693.911 110.201 109 -1.10%
From Table 5 and Fig. 8 it can be seen that developed Wang - Mendel method is able to predict energy consumption within 10% deviation in 5 cases, in 2 cases deviations
are near 10%, and in just one case deviation is close to 16%. These results are very encouraging for the further implementation of this model.
Fig. 8.
Comparison of the Results
5. Conclusion
Electric energy consumption for rail freight transport is uncertain and hard to be predicted. When the data on energy consumption from previous period are available, Wang-Mendel method could be used to obtain fuzzy rules. However, fuzzy rules that could be defined according to data from the past most often do not reproduce all possible situations, which could emerge as a result of input variables membership functions combinations. This often leads to imprecision and inaccuracy.
This paper presents the model for prediction of freight train energy consumption. Relevant considered input are: freight train kilometers, average freight train weight and non-productive kilometers. The developed model is verified through the real data collected in the Republic of Serbia.
Acknowledgment
This work has been supported by Serbian Ministr y of Education, Science and Technological Development through grants No. TR36002 and TR36022.
References
Ćalić, J. 2018. Prognoza veličine i strukture teretnog kolskog parka za Srbija Kargo a.d. [In English: Volume and structure forecast of freight wagon fleet for Serbia Cargo a. d.]. BSc. thesis. University in Belgrade, Faculty of transport and traffic engineering, Belgrade.
CE Delft, Infras, Fraunhofer ISI. 2011. External Costs of Transport in Europe: Update Study for 2008. Report commissioned by International Union of Railways UIC, CE Delft, Delft.
Jozi, A.; Pinto, T.; Praça, I.; Ramos, S.; Vale, Z.; Goujon, B.; Petrisor, T. 2017. Energy consumption forecasting using neuro-fuzzy inference systems: Thales TRT building case study, In Proceedings of the 2017 IEEE Symposium Series on Computational Intelligence (SSCI), 1-5.
Teodorović, D. 1999. Fuzzy logic systems for transportation engineering: the state of the art,
Transportation Research Part A 33: 337-364.
Teodorović, D.; Šelmić, M. 2012. Računarska inteligencija u saobraćaju [In English: Computer intelligence in traffic], University in Belgrade, Faculty of transport and traffic engineering, Belgrade.
Wang, L.; Mendel, J. 1992. Generating fuzzy rules by learning from examples, IEEE Transactions on systems, man and cybernetics 22(6): 1414-1427.
Wang, L.X. 2003. The WM method completed: A flexible fuzzy system approach to data mining, IEEE Transactions on Fuzzy Systems 11(6): 768–782.
Yanar, T.A.; Akyurek, Z. 2011. Fuzzy model tuning using simulated annealing, Expert Systems with Applications
38: 8159-8169.
Yang, X.; Yuan, J.; Yuan, J.; Mao, H. 2010. An improved WM method based on PSO for electric load forecasting,