Corresponding Author E-mail:[email protected] 754 | Page
Available online athttp://www.ijabbr.com
International journal of Advanced Biological and Biomedical Research
Volume 1, Issue 7, 2013: 754-766
The effect of water quality and irrigation methods on moisture and salinity
distribution of soil
Iman Saleh *1, Masoud Masoudi 2, Jahanshah Saleh3 and Khabat Khosravi 1
1
Ph.D. student in Watershed management Engineering, Faculty of Natural Resources, Sari Agriculture Science and Natural Resources University, Sari, Mazandaran, Iran. 2 Associate Professor of Shiraz University, Faculty of Agriculture, Department of Desert Management, Shiraz, Fars, Iran. 3 Assistant Professor, Dept. of Soil and Water Research, Agriculture and Natural Resources Research Center, Bandar-e-Abbas, Hormozgan, Iran
ABSTRACT
Current study was carried out with aim to evaluate the effect of pressurized irrigation methods and furrow irrigation method with municipal effluent on distribution of salinity and moisture in the soil profile. The experimental study was designed by split plot layout with three irrigation methods including furrow, surface drip (SD) irrigation and subsurface drip irrigation (SSD) and two water qualities (municipal effluent and fresh water) in a sugar beet field located in Corbal plain, Iran. Soil sampling was conducted in two sessions (prior to irrigation and after harvesting) at three depths of 0-20, 20-40, 40-60 cm and 15 points around areas where water leaked. Variance analysis of salinity showed a significant difference (p < 0.01) between irrigation methods, also between two water qualities in terms of salinity concentration, for three sampled depths of soil. The maximum value of salinity was found at the depth of 0-20 cm in subsurface drip irrigation by 1.66 dS/m, and the minimum value of salinity was found at the depth of 20-40 cm in furrow irrigation by 0.92 dS/m. Irrigation by municipal effluent caused a higher salinity concentration in the soil compared to fresh water regardless to the amount of water. Leaching operations, reducing the irrigation period and increasing the irrigation frequency, conducting researches and promoting the use of effluent are recommended in conclusion.
Key words: Salinity, Effluent, Surface Drip Irrigation, Subsurface Drip Irrigation, Furrow Irrigation.
INTRODUCTION
756 | Page from 8.2, 6.8 and 7.0 dSm−1 to 1.07, 1.12 and 3.5 dSm−1 in the soil layers of 0–30, 30– 60 and 60–90 cm respectively. Reuse of municipal treated effluents is highly recommended in irrigation particularly in arid and semi arid regions for plantations by drip systems. Pescod (1992) compared advantages and disadvantages of various irrigation methods while operation of municipal effluent and reported that, drip irrigation mitigates the problems caused by using effluent. Abduljavad et al. (2005) studied the effect of management of irrigation by saline water and salt tolerant tomato species. They mentioned that, drip irrigation is much more proper in terms of efficiency and saline water use. Hassanli et al. (2005) irrigated 14 various tree species during 25 months and announced that, soil salinity at depths of 0-30, 30-60 and 60-90 cm reduced from 8.2, 6.8 and 7 dS/m to 1.07, 1.12 and 3.5 dS/m respectively.
MATERIALS AND METHODS
In order to evaluate the effect of two water qualities (treated municipal effluent and fresh water) and three irrigation methods (surface drip irrigation or tape, subsurface drip irrigation and furrow) on salinity and moisture distribution in sugar beet cultivation, an experiment was conducted in the refinery station of Marvdasht, Iran with 340 mm annual precipitation and 2585 mm annual evaporation. The experiment was performed by split plot layout with three main factors (subsurface drip irrigation, surface drip irrigation and furrow) and two sub-factors (municipal effluent and fresh water) and three replications (totally 18 plots with size 6m by 7m) in a sugar beet field. For furrow irrigation method equipped by hydroflume, water entered the furrows by a 6 inch pipe and through an aperture which had been made in front of each furrow. In surface drip irrigation (SD) method which has some advantages such as high efficiency, to reduce evaporation and capability to mitigate environmental impacts while irrigation by municipal effluent, water was distributed through 16 mm lateral pipes along the plants. In subsurface drip irrigation (SSD) which in addition to advantages of surface drip irrigation, can prevent direct contact between human and wastewater, water was given the plants by plastic 16 mm pipes which were placed under the soil surface and at a depth of 15-20 cm, through automatic droppers. Diameters of polyethylene main pipes, manifold pipes and lateral pipes were respectively 50, 32 and 16 mm. Droppers of both pressurized irrigation methods were automatic and were placed with 30 cm distance from each other with 1.33 L/S water flow rate. Irrigation systems and considered plots were designed and performed after determining the location of each treatment and corresponding plots. Some characteristics of two studied water qualities have been presented in Table 1. and some soil characteristics of the experimental field before planting have been shown in Table 2.
Table 1. Chemical characteristics of irrigation water
Type of water
EC(dS/m) pH SAR CO3H- Cl- SO4
-2 Ca
+2
Mg+2 Na+ K+
(meq/L)
757 | Page
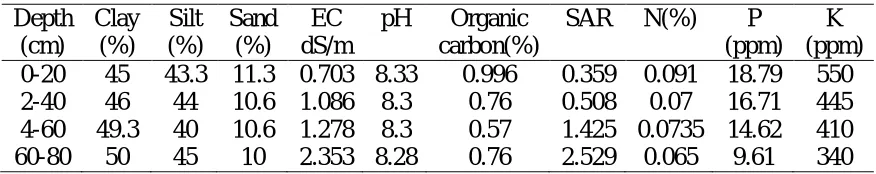
Table 2. Soil chemical and physical characteristics before planting
Depth (cm) Clay (%) Silt (%) Sand (%) EC dS/m
pH Organic carbon(%)
SAR N(%) P (ppm)
K (ppm) 0-20 45 43.3 11.3 0.703 8.33 0.996 0.359 0.091 18.79 550 2-40 46 44 10.6 1.086 8.3 0.76 0.508 0.07 16.71 445 4-60 49.3 40 10.6 1.278 8.3 0.57 1.425 0.0735 14.62 410 60-80 50 45 10 2.353 8.28 0.76 2.529 0.065 9.61 340
15 soil samples were taken at each sampling step after determining the middle point of each plot close to the water leaking point in pressurized irrigation methods and with distances of 15 and 30 cm. Soil sampling was carried out in 2 steps including, before planting and after harvesting sugar beet with 8 months interval. Soil samples were produced weighing 300-400 gr and transferred by especial plastic containers to the laboratory. Taken samples were immediately transferred to the laboratory and were divided into two parts to measure the soil moisture, salinity and acidity. To measure the weighted soil moisture, prepared samples were weighted by a digital scale (model: sartorus GM 3101) with 0.1 gr accuracy. Then soil samples were kept in an oven for 24 hours under 105 ᵒC temperature to determine their dry weight. After 24 hours, samples were weighted again. The weighted soil moisture was determined by calculating the difference between dry weight and wet weight divided by the weight of dry soil (Equation 1).
(1)
Where
: Percentage of weighted soil moisture The weight of wet soil
The weight of dry soil
Electrical conductivity (EC) was used in order to determine the amount of salinity.
To measure EC of saturated extract, firstly a saturated extract of soil sample was produced then, soil salinity was measured by a digital EC Meter (model: JENWAY 4150) for all samples. Statistical analysis was accomplished by SAS software.
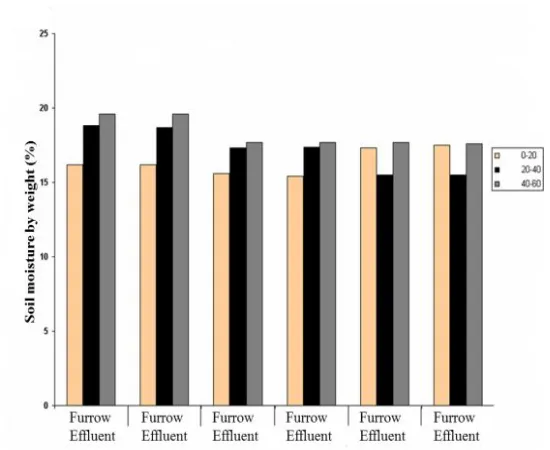
758 | Page 1. Soil moisture
Comparing mean amounts of moistures showed that in the first sampling step, the maximum amount of soil moisture among pressurized irrigation methods occurred at the depth of 40-60 cm with a weighted moisture by 16% in surface drip irrigation while, at the depth of 40-60 cm of furrow irrigation method there was a significant increase in the amount of soil moisture (16.5%) compared with other methods that probably is due to greater volume of used water in this method than other methods, leaking and more percolation of irrigation water. In the second sampling, the most amount of soil moisture was found at the depth of 0-20 cm in surface drip irrigation with a weighted moisture of 17.4% while, and at greater depths, the maximum amount of soil moisture was found in furrow irrigation method at the depth of 40-60 cm with an average of 19.6% weighted moisture. As it can be seen in Table 3. the amount of soil moisture at the deeper points (40-60 cm) in furrow method is greater than others.Totally, furrow irrigation method caused more soil moisture increase in lower depths due to greater volume of used water (11400 m3) during the growth period comparing other methods (8200 m3). Also the minimum amount of soil moisture in the soil surface was found in furrow method that surface evaporation is the reason of this happening.
Table 3. Comparison of soil weighted moisture means in various layers of the soil affected by
different irrigation methods
Irrigation Method
Soil weighted moisture (%)
(First sampling step)
Soil weighted moisture (%)
(Second sampling step)
0-20 20-40 40-60 0-20 20-40 40-60
(cm)
Furrow 11.8 a* 15.2 ab 16.6 a 15.5 c 18.7 a 19.6 a
S.S.D 12.3 a 15.5 b 15.8 b 16.2 b 17.3 b 17.7 b
S.D 11.5 a 13.8 b 16 ab 17.4 a 15.5 c 17.6 b
*: Means with dissimilar letters in each column have significant difference at the level of 5% based on Duncan Test.
759 | Page
Figure 1. Soil moisture variations in various treatments and depths in the first soil sampling step
Figure 2. Soil moisture variations in various treatments and depths in the second soil sampling
760 | Page 2. Soil salinity
Secondary salinity is a serious problem in irrigated crop lands in arid and semi-arid regions so, evaluating the salinity distribution in various irrigation methods can be effective for salinity management. In the first sampling step, the plots irrigated by furrow method with the average salinity of 1.2, 1.07 and 1.09 dS/m respectively at the depths of 0-20, 20-40 and 40-60 cm had a significant decrease comparing the amount of salinity accumulation in other irrigation methods. In the second soil sampling also, the minimum amount of soil salinity (EC) was found in furrow irrigation by 1.32, 0.92 and 1.1 dS/m at the depths of 0-20, 20-40 and 40-60 cm respectively.
Table 4. Comparison of salinity means (dS/m) in various soil layers affected by irrigation
methods
Irrigation Method
EC (Ds/m)
(First sampling step)
EC (Ds/m)
(Second sampling step)
0-20 20-40 40-60 0-20 20-40 40-60
(cm)
Furrow 1.2 b* 1.07 b 1.09 b 1.32 c 0.92 c 1.1 c
S.S.D 1.7 a 1.25 a 1.27 a 1.66 a 1.29 b 1.58 a
S.D 1.9 a 1.38 a 1.17 ab 1.53 b 1.39 a 1.45 b
*: Means with dissimilar letters in each column have significant differences at the level of 5% based on Duncan Test.
761 | Page
Table 5. Comparison of salinity means (dS/m) in various layers of soil affected by water quality
Type of water EC (dS/m) (First sampling) EC (dS/m) (Second sampling)
0-20 20-40 40-60 0-20 20-40 40-60
(cm)
Effluent 1.82 a* 1.57 a 1.46 a 1.6 a 1.3 a 1.4 a
F. water 1.38 b 0.9 b 0.89 b 1.4 b 1.08 b 1.28 b
*: Means with dissimilar letters in each column have significant difference at the level of 5% based on Duncan Test.
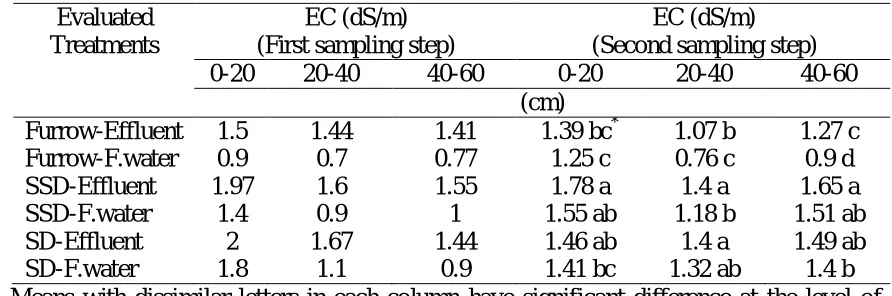
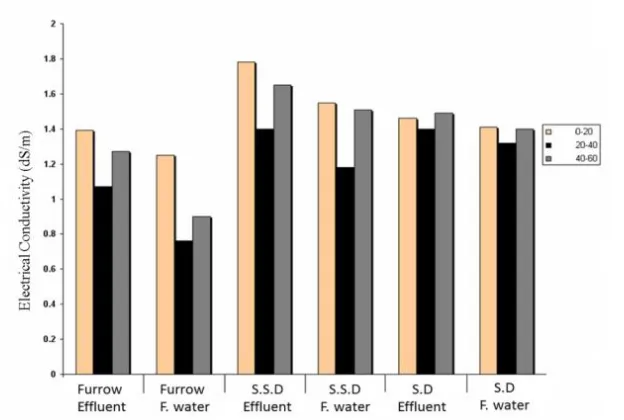
Generally, regardless to irrigation method, irrigated plots by municipal effluent showed greater salt accumulation in all three studied depths. There was a significant interaction between irrigation methods and water quality treatments. The maximum soil salinity of interaction treatments was measured at the depths of 0-20 cm in a treatment including subsurface drip irrigation – municipal effluent with 1.97 and 1.78 dS/m of EC in the first and second soil sampling steps respectively. The minimum measured EC of interaction treatments was at the depth of 20-40 cm of a treatment including furrow irrigation – fresh water with 0.7 and 0.76 dS/m in the first and second sampling steps respectively (Table 6).
Table 6. Mean salinity in the soil layers for various components of the interaction of irrigation
methods and water quality
Evaluated Treatments
EC (dS/m) (First sampling step)
EC (dS/m) (Second sampling step) 0-20 20-40 40-60 0-20 20-40 40-60
(cm)
Furrow-Effluent 1.5 1.44 1.41 1.39 bc* 1.07 b 1.27 c Furrow-F.water 0.9 0.7 0.77 1.25 c 0.76 c 0.9 d SSD-Effluent 1.97 1.6 1.55 1.78 a 1.4 a 1.65 a SSD-F.water 1.4 0.9 1 1.55 ab 1.18 b 1.51 ab SD-Effluent 2 1.67 1.44 1.46 ab 1.4 a 1.49 ab SD-F.water 1.8 1.1 0.9 1.41 bc 1.32 ab 1.4 b
*: Means with dissimilar letters in each column have significant difference at the level of 5% based on Duncan Test.
As it can be found from achieved data in table (6) although initial soil salinity at different depths was approximately same, the amount of soil salinity at different depths changed after irrigating by effluent for a year due to higher salinity of municipal effluent comparing fresh water and using various irrigation methods. All treatments irrigated by municipal effluent became more saline than plots irrigated by fresh water at all three depths of soil samplings. Also, pressurized irrigation methods made soil more saline than furrow irrigation method.
762 | Page As it is observed in figure (3) and figure (4), in all treatments and both soil sampling steps, salinity of soil surface (0-20 cm) was higher than deeper layers. These two figures obviously show the effect of using municipal effluent on soil salinity.
Figure 3. Soil salinity variations in various treatments and depths in the first soil sampling step
Figure 4. Soil salinity variations in various treatments and depths in the second soil sampling
763 | Page 3. Salinity distribution
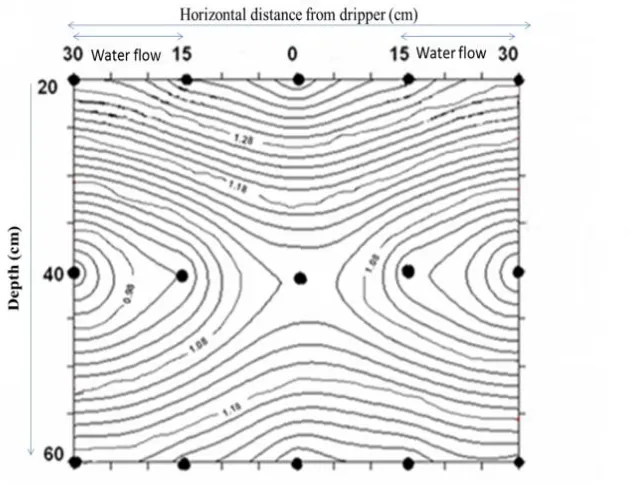
In subsurface drip irrigation method, the maximum amount of salinity was found at the distance of 30 cm from the dropper and at the depth of 0-20 cm. Lower salinity was seen closer to the dropper. Also, the minimum salinity was shown at the depth of 20-40 cm and in line with dripper. According to figure 5, the maximum amount of salinity was indicated on the soil surface.
Figure 5. Distribution of salinity in the soil profile in subsurface drip irrigation method
764 | Page
Figure 6. Distribution of salinity in the soil profile in surface drip irrigation method
765 | Page With regard to the results of this study, some points in using wastewater effluent are recommended as below:
- In irrigation methods with relatively high efficiency, salt accumulation increases in soil surface due to reduction of water losses of depth that result in impossibility of leaching. Therefore, leaching operation by high quality waters while using effluent for irrigation is recommended particularly in pressurized irrigation methods.
- Groundwater level control is required when wastewater effluent is used due to probability of groundwater pollution.
- Environmental impacts of effluent must be considered and studied.
- Reducing the irrigation period and increasing the irrigation frequency are recommended because wastewater effluents have much higher salinity than fresh waters.
- In drip irrigation method, it is recommended to activate the irrigation system when rainfall is occurred. It can be effective to improve leaching.
- More researches on the accumulation of various elements in the soil and around the water source can reveal more facts about the use of effluent in irrigation.
REFERENCES
Abdel Gavwad, G., Arsalan, A. Kaadouri, F. (2005). The effect of saline irrigation water management and salt tolerant tomato varieties on sustainable production of tomato in Syria. Agricultural Water
Management. 78, 39-53.
Bouri, S., Abida, H. Khanfir, H. (2008). Impacts of wastewater irrigation in arid and semi arid regions: case of Sidi Abid region, Tunisia. Environmental Geology. 53, 1421–1432.
Fernandez-Galvez, J., Clayton, J. A. R. and Aranzazu, P. (2010). Soil Quality as Affected by Wastewater Irrigation in a Semi-arid Agricultural Land. Challanges for soil management Book Series: Advances in
Geoecology. 41, 63-70.
Genhua, N. and Raul, C. (2010). Growth and Physiological Responses of Landscape Plants to Saline Water Irrigation: A Review. Hortscience. 45 (11), 1065-1609.
766 | Page Hassanli, A. M., Javan, M. and Saadat, Y. (2008). Reuse of municipal effluent with drip irrigation and evaluation the effect on soil properties in a semi-arid area. Environmental Monitoring and Assessment. 144, 151–158.
Klay, S., Charef, A., Ayed, L., Houman, B. and Rezgui, F. (2010). Effect of irrigation with treated wastewater on geochemical properties (saltiness, C, N and heavy metals) of isohumic soils (Zaouit Sousse perimeter, Oriental Tunisia). Desalination. 253, 180–187.
Murtaza, G., Ghafoor, A. and Qadir, M. (2006). Irrigation and soil management strategies for using saline – sodoc water in cotton – wheat rotation. Agricultural water management. 81, 98-114.
Perez, G., Martinez, M. J. and Sanchez, A. (2003). The role of low quality irrigation water in desertification of semi-arid zones in Murica, SE Spain. Geoderma. 21, 109-125.
Pescod, M. B. (1992). Wastwwater treatment and use in agriculture. FAO, Irrigation and Drainage paper. 47, 113 P.
Qadir, M., Ghafoor, A. and Murtaza, G. (2001). Use of saline – sodic waters through phytoremediation of calcareus saline – sodic soils. Agricultural water management. 50, 197-210.