3286
Navie Bayes Classifier For Wireless Capsule
Endoscopy Video To Detect Bleeding Frames
B.Priyadharshini,.T.Gomathi
ABSTRACT: To perceive the region and bleeding Frame in the Wireless Capsule Endoscopy Video, An automatic computer -aided technique is introduced to diminish the burden of physicians is highly insisted. The wireless capsule endoscopy (WCE), is an imaging techn ology which is recently recognized and doesn’t require any wired device. This device perceives abnormalities in GI tract i.e. (colon, throat, small digestive system and stomach). A WCE video comprises of 55,000 pictures. It is difficult to examine by clinicians. To finish up draining pictures out of fif ty five thousand WCE images makes the task extremely hard and high-priced. The major goal is to expand an automatic ambiguous bleeding detection method by means of super pixel segmentation and naive bayes classifier. Naive Bayes and super pixel segmentation are used to solve this problem.
————————————————————
I.INTRODUCTION
Wireless capsule endoscopy was developed in 1990 and published in 2000. It is design to visual inspection of the entire gastrointestinal tract [1]. It is a capsule shape device of 11*26mm which consists of optical dome a battery an RF transmitter an illuminator an image sensor. The capsule shape device is swallowed by the patient and it is pushed by the peristalsis and take the video of the entire gastro intestine and it is wirelessly transmitted to the data recording device. it will take 2-4 images per second for eight hours so for each patient WCE produces 55,000 images so it is very hard for physician to locate the bleeding frame [2].The major disadvantages of these wce is that it will consumed a large amount of data and it is time consuming [3]. One of the major problems associated with this wce is too many images to be physically checked by the clinician [4]. All these problems motivate us to turn the computer-aided technique In the paper the author put forward a new computer-aided technique for detection of bleeding region in the WCE frame. This use of chrominance moment of color texture feature of HSI color space[5]. The author[6] prefer six color features (Mean and varience of H,S,and V esteem) in the HSI shading space to segregate amongst bleeding and typical status.[7]presented another descriptor that is pyramids of hue histogram to portray the bleeding WCE pictures, consolidating bleeding and spatial data by consolidating enlightenment invariant shading histograms and the spatial pyramids strategy inspite of the fact that these strategies can recognize the bleeding frames form the ordinary ones in some degree large part of them concentrate the entire bleeding highlights from a wce pictures , disregarding the particular bleeding range of WCE pictures. In paper[4] the author proposed a strategy for consequently separating stomach, digestive tract and colon tissue by figuring shade immersion chromaticity histograms which are compacted utilizing a half and half change, joining the DCT and PCA.
In this paper, we propose words-based color histogram for bleeding location in WCE pictures. Our strategy is an augmentation of Bag of Words technique [8],[9]. So as to make the most of the color information of the bleeding pictures, we compute the color words by applying K-means clustering method to the pixel spoke to WCE pictures in the particular color space. At that point each WCE image is described as histogram of the bunch focuses (named words-based color histogram) to speak to the component vector. Finally navie bayes classifier are utilized as the classifier to detect bleeding frames[10].
In the second stage, we concentrate on limitation of the bleeding zones in the bleeding frames. Since the parts of different color spaces have diverse data, we review the bleeding pictures under various shading spaces like RGB, HSI/HSV, CMYK, CIELAB, YUV, XYZ [11] what's more, select the parts that highlight the bleeding territories. At that point, we make the principal arrange first-stage saliency brushing these parts together to reinforce the suspicious locales. In expansion, common saliency lies in the visual differentiation [12], [13]. In this manner, we extricate the second-stage saliency delineate the earlier that if the shading data of the area indicates expansive similitude to the red shading, then this district ought to have high saliency esteem. At last applying a suitable combination methodology of these two conspicuity maps and programmed limit, we can limit the bleeding area.
Our main contributions can be summarized in the following two aspects
1) We propose the words-based colour histogram to speak to the pictures. That is, we make utilization of center level elements instead of low-level elements that are for the most part utilized as a part of the written works
2) We propose a two-stage saliency extraction strategy to confine the draining regions in WCE images. Since these two-stage saliency maps highlight the bleeding districts and isolate bleeding mucosa from the uninformative parts, we could get the bleeding region hopefuls effectively
__________________
Assistant Professor,
ETCE Department
KL deemed to be university,
Sathyabama Institute of Science and Technology Vadeswaram ,Andhara Pradesh [email protected]
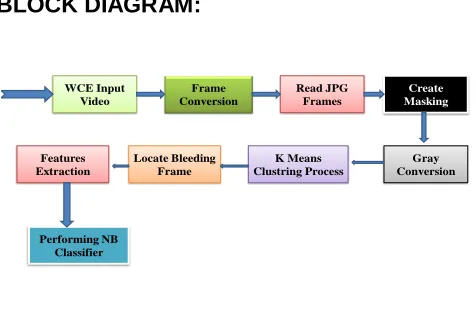
BLOCK DIAGRAM:
WCE Input Video
Frame Conversion
Read JPG Frames
Create Masking
Gray Conversion K Means
Clustring Process Locate Bleeding
Frame Features
Extraction
Performing NB Classifier
Fi
g.1. Block diagram of proposed method
II. METHOD OVERVIEW
The block diagram of the proposed technique is delineated in Fig. 1 furthermore, it includes two major steps. In the initial step of bleeding frame detection, we propose words-based color histograms to speak to WCE pictures. And then bleeding frame classification we propose navie bayes classifier to classify the bleeding and normal frames. At that point, we concentrate on the bleeding zone localization. We figure the first-stage saliency outline on the perception of the bleeding regions in the diverse color spaces furthermore, the second-stage saliency delineate on the characteristic property of bleeding ranges in the RGB color space. At last, we localize the bleeding ranges through the fusion strategy of the saliency maps and an appropriate threshold.
III.BLEEDING FRAME DETECTION
A.region of intrest extraction
WCE pictures are regularly darkened by the vast dark foundation, along these lines the picture highlights removed from the whole picture will reflect the visual defilement introduced in the picture fig.2(b). To address this calculate, we diagram the most extreme square engraved in the round picture as area of intrigue (ROI)without loss of the major picture data. The measure of the got ROI is 180 × 180 from the first picture with the measure of 256 × 256. It can be found that the removed ROIs are attractive since they illustrate the real picture highlights and give a decent portrayal furthermore, depiction of a WCE picture. The ROI pictures supplant the unique ones for the accompanying preparing, making the feature extraction methodology
substantially less
demanding.
Fig.2.(a) Orginal image
Fig.2. (b) ROI image
B. Colour feature extraction
3288 arbitrarily select 10% bleeding pictures and 10% ordinary
pictures from the datasets and figure the relating bunch focuses autonomously by contributing the pixel spoken to picture vectors in the color space to the K-means clustering technique [16].This method uses the color data of the WCE outlines and decreases the measurement of the color highlight. The linked bunch focuses from the bleeding dataset and the ordinary WCE dataset fill in as a vocabulary of visual words. At that point, we delineate different color information of each point in a WCE picture to the closest visual words and ascertain the quantity of each visual word, yielding a histogram (ω, d), where means the ith visual word in the K-means color groups furthermore, di numbers the recurrence of event of it. Using this technique, we portray the WCE pictures as the words-based color histograms. A vital choice in the development of the new component is the choice of the vocabulary estimate K. To assess how the vocabulary measure impacts the order execution with our approach, we bit by bit increment K from 10 to 100 and assess the arrangement comes about under each setting.
Fig.3. (a) cluster output
Fig.3.(b) cluster performance
IV.BLEEDING
FRAME CLASSIFICATION
Navie bayes classifier:
Naïve Bayes classification is a kind of trouble-free probabilistic classification methods based on Bayes’ theorem with the hypothesis of independence between features. The model is trained on training dataset to construct predictions by predict() function. This article initiates two functions naïve Bayes() and train() for the presentation of Naïve Bayes classification. Bayes’ theorem can be used to create prediction based on prior knowledge and current evidence. With accumulating evidence, the prediction is altered. In technical terms, the forecast is the back likelihood that agents are occupied with. The earlier information is named earlier likelihood that mirrors the most plausible supposition on the result without extra confirmation. Grouping images into (semantically) meaningful grouping using low-level visual features is a challenging and important problem in content-based image retrieval. Using binary Bayesian classifiers, we try to capture high-level concepts from low-level image features beneath the limitation that the test image does be in the right place to one of the classes. Specifically, we believe the hierarchical classification of vacation images; at the highest level, images are classified as indoor or outdoor; outdoor images are more classified as the classifiers have been considered and appraised on a database This also further expands a learning method to incrementally train the classifiers as additional data become obtainable. We also show preliminary results for feature reduction using clustering techniques. Our aim is to combine numerous two-class classifiers into a single hierarchical classifier. Leukemia is a malignant neoplasm of the blood and is one of the most important causes of death throughout the universe. Acute Lymphocytic Leukemia is the most common type of Leukemia and it generally affects children and adults abovefifty years old. Examination of Peripheral blood spread Image is a standout amongst the most generally utilized method for Leukemia location however it experiences issues, for example, subjective translations, operator tiredness and efficiency. The purpose of this work is to develop a method that can classify lymphocyte and lymphoblast nuclei from the ALL-IDB2 dataset. In the current paper,from an arrangement of forty Images of Lymphocytes and Lymphoblasts, core is divided utilizing K implies bunching technique taking after which an arrangement of components are extricated. Gullible Bayesian classifier was utilized as a part of this work for Lymphocyte arrangement which give in 75% accuracy.
V.BLEEDING LOCATION DETECTION
A.first-stage saliency
uncover the irregularity of dying, hence, we examine the draining pictures under various shading segments of different shading spaces, for example, RGB, CIELAB, CIEXYZ, YCbCr, CMYK, HSV, and HSI. As appeared in Fig. 4(a), strikingly, we have watched that the second part of the changed WCE pictures in the CIELAB [17] furthermore, CMYK [18] shading spaces highlights the draining areas also, isolates draining mucosa tissues from the uninformative parts. With a specific end goal to stress the draining mucosa, a saliency delineate is made by doling out various weights to the previously mentioned two planes that highlight the draining regions with the accompanying condition:
(x,y)=α A(x.y)+β M(x,y) (1)
B. Second-stage saliency
When clinicians see the WCE pictures, they might be pulled in by the draining territories in view of red shading in RGB space of the changes in the diverse shading spaces. Consequently, we characterize the second notable areas as those locales with extensive similitude to the red shading values, which implies that if a pixel has a more noteworthy R esteem and littler G, B values, no doubt rosy and ought to be allocated higher saliency esteem. Thus, we determine the second-organize saliency delineate on the accompanying three stages. To start with, we use a 5∗5 Gaussian channel on the first picture to dispense with fine surface subtle elements and also clamor and coding ancient rarities. At that point, the saliency maps for R, G, and B shading channels are figured by
(x,y)= 1-exp (2)
(x,y)=1-exp (3)
(x,y)=1-exp (4)
where , , and are the relating values in the RGB
space. The parameters , and are picked as =
0.32, = = 0.45 alter the three shading saliency guide to [0, 1]. It can be found that in the recipe (2)–(4), the district with bigger , littler , and will have higher
, and .At last, the second-organize saliency outline
for a picture I could be planned as the blend of the three channel saliency maps:
(x,y)=
1
3
(5)C. Fusion strategy &threshold
The previously mentioned two saliency maps limit the dying regions in the WCE pictures from various perspectives, one is from the shading space change and the other is from the perspective of the clinician. In this manner, we could
determine our proposed saliency delineate combining them by the accompanying equation:
= + (6)
where is the relating combined saliency outline +
= 1. We alter from 0.1 to 1 with 0.1 additions each
opportunity to assess the diverse weights to the last dying restriction. Once these two-arrange saliency maps are intertwined together, the draining locales are probably going to be reinforced. At long last, subsequent to applying a thresholding calculation, we could promote restrict the genuine draining districts; the saliency guide will be further prepared into a double veil picture.
Fig..4(a)First stage saliency
3290
Fig.5(c) localized bleeding area
D.Criteria for bleeding localization
To quantitatively evaluate the confinement execution, a pixel based examination between the confined draining areas and the ground truth marked by the clinicians is performed. The three measurements utilized as a part of this investigation are exactness, the false positive proportion (FPR), and the false negative proportion (FNR) [19], [20], which are ascertained by the accompanying equation
Precision= (7)
FPR= (8)
FNR= (9)
where true positive (TP) cases are the draining zones[21] that are accurately named as the bleedings, while false positive (FP) are the ones mistakenly named as the bleedings. False negative (FN) speak to the districts [22], [23] which are not named as the bleedings but rather ought to have been.
CONCLUSION:
In this paper a novel technique for bleeding frame classification in the WCE image Blood bleeding region detection using wireless Capsule endoscopy video’s is performed, which is used to find bleeding region from videos. This proposed system provides the patient a painless model and digitalized monitoring system. This system monitors the bleeding area of human regions. It is encouraging to see that our proposed technique gives better than all the existing works
REFERENCES
[1] [1]Santi segui,Michal drozdzal,guillem pascual,petiaradeva,Carolinamalagelada,Fernando aspiroz,jordi vitria,‖generic feature learning for wireless capsule endoscopy analysis‖, 2016,pp.163-172.
[2] [2]Ahnaf rshik Hassan,mohammad ariful haque,‖computer-aided gastrointestinal haemorrhage detection in wireless capsule endoscopy videos,‖2015,pp. 341-553
[3] [3] B.Li and M.-H. Meng, ―Computer-aided detection of the bleeding regions for capsule endoscopy images,‖IEEE
Trans.biomed.Eng.,vol.56,no.4,pp.1032-1039,Apr.2009.
[4] [4]Tao Ma,yuexian zou,zhiqiang xiang,lei li and yili,IEEE,‖wireless capsule endoscopy image classification based on vector sparse coding .pp:582-585,yr:2014
[5] [5]Y. Fu,W. Zhang, M. Mandal, andM.-H. Meng, ―Computer-aided bleeding detection in WCE video,‖ IEEE J. Biomed. Health Inform., vol. 18, no. 2,pp. 636–642, Mar. 2014.
[6] [6]L.Cui,c.Hu,Y.Zou,andM,H.Meng,‖bleeding detection in wireless capsule endoscopy images by
support vector
classifier,‖inproc.IEEEInt.conf.inform.autom,2010,p p.1746-1751.
[7] [7]G,Lv,G.Yan,and Z,Wang,‖bleeding detection in wirelesscapsule endoscopy images based on color invariants and spatial pyramids using support
vector machines,‖in pro.IEEE
annu.int.conf.pp.6643-6646.
[8] [8]j.sivic and A.Zisserman,‖video google:A text retrieval approach to object matching in videos,‖IEEEInt.conf.comput.vision,2003,pp.1470-1477.
[9] [9]G.Csurka,C.dance,L.Fan,j.willamowski,and C.Bray,‖visual categorization with bags of keypoints,‖in proc.2004,pp.1-2.
[10][10]DhanashreeS,Medhekar,MayurP,Bote,Shruti D,Deshmukh,‖Heart disease prediction system using naive bayes,‖vol.2 ISSUE 3,march.2013. [11][11]G.Sharma and H.J.Trussell,‖digital color
imaging,‖IEEE Transvol.6.pp.901-932,jul.1997. [12][12]R.Achanta,F.Estrada,p.wils,andS.Susstrunk,‖sa
lient region detection and segmentation,‖in computer vision system .2008,pp.66-75.
[13][13]S.Goferfan,L.Zelnikmanor,andA.Tal,‖context – aware saliency detection,‖IEEE Trans .patternAnal.mach.intell.,vol.34,no.10,pp.1915-1926,oct.2012.
[14][14]S.Segui,M.Drozdzal,F.Vilarino,C.Malagelada,F. Azpiroz,P.Radeva,and J.Vitria,‖catagorization and segmentation of intestinal content frames for wireless capsule endoscopy,‖IEEE Trans,pp.1341-1352.2012.
[15][15]S.Hwang j.oh,j.cox,s.j.trang,and
[16][16]T.Kanungo,D.M.Mount,N.S.Netanyahu,C.D.Pia tko,R.Silverman,and A.Y.Wa,‖an efficient k-means clustering algorithm:analysis and implementation,‖IEEETreans .pp.881-892.2002. [17][17]J.Schanda,colorimetry:understanding the CIE
system.2007.
[18][18]Y.Zhao,Z.Fan,andM.E.Hoover,‖frequency domain infrared water making for printed CYMK image,‖IEEE Trans.pp.2725-2728.2011..
[19][19]F.Conversano,E.Casciaro,R.Franchini,S.Casci aro,and A.Lay-Ekuakille,‖fully automatic 3D segmentation measurements of human liver vessels from contrast-enhanced CT.‖IEEE Trans.pp.1-5.2014.
[20][20]F.Conversano,R.Franchini,C.Demitri,L.Massopt ier,F.Montagna,A.Maffezzoli,A.Malvasi,and
S.Casciaro,‖hepatic vessel segmentation for 3D
planning of liver surgery:experimental evaluation of a new fully automatic algorithm,‖vol.18.pp.461-470.2011.
[21][21] T.Gomathi,:‖ Performance analysis of parallel co-operative spectrum sensing using scheduling algorithm in CRNS‖, International Journal of Applied Engineering Research ISSN 0973-4562, Volume 10, Number 2 (2015) pp. 2733-2747,2015.
[22][22]T.Gomathi,:‖ Compression and Segmentation of JPEG Images Using DWT‖ Research Journal of Pharmaceutical Biological Chemical Sciences (ISSN: 0975-8585), Volume 6, issue 2(March-April),2015.