Neuropsychiatric Disease and Treatment
Dove
press
O r i g i N a l r e s e a r c h
open access to scientific and medical research
Open access Full Text article
altered functional connectivity of primary visual
cortex in late blindness
Zhi Wen1,*
Fu-Qing Zhou2,*
Xin huang3
han Dong Dan3
Bao-Jun Xie1
Yin shen3
1Department of radiology, renmin hospital of Wuhan University, Wuhan, 430060, hubei, china; 2Department of radiology, The First affiliated hospital of Nanchang University, Jiangxi Province Medical imaging research institute, Nanchang, 330006, Jiangxi, china; 3eye center, renmin hospital of Wuhan University, Wuhan, 430060, hubei, china
*These authors contributed equally to this work
Background: Previous studies demonstrated that early blindness is associated with abnormal intrinsic functional connectivity (FC) between the primary visual cortex (V1) and other sensory areas. However, the V1 pattern of spontaneous neural activity occurring in late blindness (LB) remains unknown. The purpose of this study was to investigate the intrinsic FC patterns of V1 in LB.
Materials and methods: Thirty LB individuals (18 males and 12 females; mean age: 38.76±14.43 years) and 30 sighted controls (SCs) individuals (18 males and 12 females; mean age: 38.67±13.85 years) closely matched for age, sex, and education, underwent resting-state magnetic resonance imaging scans. Region of interest analysis was performed to extract the cor-relation coefficient matrix among each pair of Brodmann area (BA) 17 and FC between V1 and vision-related subcortical nuclei.
Results: Compared with SCs, LB individuals showed a decreased FC between the left V1 and the bilateral cuneus (CUN)/lingual gyrus (LGG)/calcarine (CAL) (BA 18/19/30) and left precentral gyrus (PreCG) and the postcentral gyrus (PostCG) (BA 2/3/4). Also, LB individuals showed a decreased FC between the right V1 and the bilateral CUN/LGG/CAL (BA 18/19/30) and the left PreCG and PostCG (BA 2/3/4/6) (voxel-level: P,0.01, cluster-level: P,0.05). Meanwhile, LB individuals showed a decreased FC between the left V1 and the right V1 and increased FC between the left V1 and the right superior colliculus, the right V1, and the left hippocampus (P,0.05). Moreover, a positive correlation was observed between the onset age of blindness and FC values in V1 to CUN/LGG/CAL in LB.
Conclusion: Our results highlighted that LB induces a decreased FC between V1 and higher visual areas, motor cortices, and somatosensory cortices at rest. This might indicate that LB humans could present with impaired top-down modulations, visual imagery, and vision-motor function.
Keywords: late blindness, intrinsic functional connectivity, primary visual area, functional magnetic resonance imaging
Introduction
Visual deprivation leads to cross-modal plasticity in the primary visual cortex (V1) of the human brain. Visual experience plays a major role in promoting the development of visual cortex during the critical development periods.1–3 In early blindness (EB) individuals, visual deprivation leads to functional and structural architecture changes in the visual cortex. The visual cortex of EB adults shows a shift of visual information to nonvisual stimuli, including auditory perception,4 tactile perception,5 and language perception.6 Meanwhile, increased energy metabolism and neural activities have been observed in EB individuals.7,8 Moreover, EB has been associated with structural modification in the visual cortex due to visual deprivation before critical development periods. Indeed, thicker cortical thickness in visual cortices has been shown in EB correspondence: Yin shen
eye center, renmin hospital of Wuhan University, No 238 Jie Fang road, Wuhan, hubei 430060, china Tel +86 138 7155 0513 email [email protected]
Bao-Jun Xie
Department of radiology, renmin hospital of Wuhan University, No 238, Jie Fang road, Wuhan, hubei 430060, china
Tel +86 153 3713 6699 email [email protected]
Journal name: Neuropsychiatric Disease and Treatment Article Designation: Original Research
Year: 2018 Volume: 14
Running head verso: Wen et al
Running head recto: FC of V1 in late blindness DOI: 183751
Neuropsychiatric Disease and Treatment downloaded from https://www.dovepress.com/ by 118.70.13.36 on 25-Aug-2020
For personal use only.
Dovepress
Wen et al
adults compared with SCs.9 Previous neuroimaging studies have revealed decreased gray matter volume in the visual pathway and the visual cortex in EB individuals.10,11 Further-more, visual deprivation before and after sensitive periods of visual form showed different functional connectivity (FC) patterns within the occipital cortex.12,13 Another study reported that EB participants showed more brain functional reorganization than late blindness (LB) individuals.14 Altered FC between V1 and other nonvisual cortices also occurred in EB individuals.15 All the above mentioned studies have focused on the alterations of functional and structural archi-tecture in the visual cortex in EB individuals. However, the pattern of spontaneous neural activity changes in V1 in LB remains unknown.
Retinitis pigmentosa (RP) patients provide a unique model to address this issue. Indeed, RP is a hereditary retinal disease characterized by a progressive visual loss. The worldwide prevalence of RP is about 1 in 4,00016 and RP begins mainly during adulthood.17 The peripheral visual loss in RP is due to the progressive degeneration of rod photoreceptor cells, followed by the degeneration of cone photoreceptor cells, which eventually ends up in blindness. In this study, we selected RP patients who have suffered from vision loss in their adulthood. These RP patients thus had visual deprivation after critical development periods in visual formation.
The human brain shows blood oxygenation level-dependent (BOLD) signals at rest, which are closely linked to the spontaneous neural activity. Resting-state magnetic resonance imaging (MRI) based on BOLD signals has been successfully applied to investigate the alterations in spontane-ous neural activity.18–20 Resting-state function connectivity (RSFC) is a method that calculates the temporal coherence of the BOLD signals between distant brain regions.21 Therefore, the RSFC method is an effective tool to investigate the neural activity connections between separated brain areas. More-over, FC is based on a region of interest (ROI), which allows researchers to target a prior brain region before calculating its temporal coherence with other brain regions. Increased FC between the primary somatosensory cortex and the visual area has been shown in EB adults using a positron emission tomography (PET) method.22 Yu et al demonstrated that EB individuals showed a decreased FC between V1 and the sensorimotor and auditory cortices.23 Another study reported that decreased FC between visual and other sensory cortices was observed in EB.24 However, the effect of visual depriva-tion after critical development periods on the spontaneous neural activity in V1 remains largely unknown.
Consequently, the purpose of this study was to determine whether spontaneous neural activity changes in V1 occurred in LB individuals. Moreover, we examined the strength of FC between V1 and some vision-related subcortical nuclei, such as lateral geniculate nucleus (LGN), superior colliculus, and hippocampus (Hipp) between two groups. We hypothesized that LB showed a different FC pattern between V1 and other brain regions relative to EB. These results may provide some useful information for the understanding of the underlying reorganization of V1 occurring in LB individuals.
Materials and methods
Participants
In total, 30 right-handed LB individuals due to RP (18 males and 12 females; mean age: 38.76±14.43 years) and 30 right-handed sighted controls (SCs) (18 males and 12 females; mean age: 38.67±13.85 years) participated in the study. The research protocol followed the Declaration of Helsinki and was approved by the medical ethics committee of the Renmin Hospital of Wuhan University. All subjects were given an informed written consent form for agreement to participant in this study.
All subjects met the following criteria: 1) no contrain-dications for MRI scanning (eg, no cardiac pacemaker or implanted metal devices, and so on); 2) no claustrophobia; 3) no heart disease, hypertension, and cerebral diseases. (The high resolution T1-weighted imaging of all subjects was checked by an experienced radiologist.)
All LB individuals met the following criteria: 1) onset age of blindness .12 years; 2) no experience of vision after visual deprivation; 3) no ocular surgical history.
All SCs participants met the following criteria: 1) no ocular diseases (myopia, cataracts, glaucoma, optic neuritis, retinal degeneration, etc); 2) binocular visual acuity $1.0; 3) no ocular surgical history; 4) no mental disorders.
Mri parameters
MRI scanning was performed on a 3-T MR scanner (Discov-ery MR750W system; GE Healthcare Bio-Sciences Corpo-ration, Piscataway, NJ, USA) with eight-channel head coil. Whole-brain T1-weights were obtained with magnetization prepared gradient echo image (MPRAGE) with these param-eters: (repetition time/echo time =8.5/3.3, thickness =1.0 mm, no intersection gap, acquisition matrix =256×256, field of view =240×240 mm2, flip angle =12°).
Functional images were obtained by using gradient echo-planar imaging sequence with the following parameters (rep-etition time =2,000 ms, echo time =25 ms, thickness =3.0 mm,
Neuropsychiatric Disease and Treatment downloaded from https://www.dovepress.com/ by 118.70.13.36 on 25-Aug-2020
Dovepress Fc of V1 in late blindness
gap =1.2 mm, acquisition matrix =64×64, flip angle =90°, field of view =240×240 mm2, voxel size =3.6×3.6×3.6 mm3, 35 axial) . All subjects underwent MRI scanning with eyes closed and without falling asleep.
Functional Mri (fMri) data preprocessing
Digital Imaging and Communications in Medicine format of the functional images was converted to Neuroimaging Informatics Technology Initiative format using MRIcron software (http://www.cabiatl.com/mricro/mricron/dcm2nii. html). All preprocessing was performed using the toolbox for Data Processing & Analysis of Brain Imaging (http:// www.rfmri.org/dpabi),25 which is based on Statistical Para-metric Mapping (SPM8; http://www.fil.ion.ucl.ac.uk/spm) implemented in MATLAB 2013a (MathWorks, Natick, MA, USA) including briefly the following steps. 1) The first 10 volumes of each subject were discarded due to the signal reaching equilibrium. 2) The remaining 230 volumes of func-tional BOLD images were corrected for slice timing effects, motion corrected, and realigned. Data from subjects whose head motion was .2 mm or for whom rotation exceeded 2°
during scanning were excluded. 3) Individual T1-weighted MPRAGE structural images were registered to the mean fMRI data, and then the resulting aligned T1-weighted images were segmented using the Diffeomorphic Anatomical Registration Through Exponentiated Lie Algebra toolbox for improved spatial precision in the normalization of fMRI data.26 Normalized data (in Montreal Neurological Institute 152 space) were re-sliced at a resolution of 3×3×3 mm3. 4) Smoothing was performed with a 6 mm full-width-half-maximum Gaussian kernel. 5) Data with linear trend were removed, and temporal band-pass was filtered (0.01–0.1 Hz). 6) Linear regression analysis was used to regress out several covariates (six head motion parameters, mean frame-wise displacement, global brain signal, and averaged signal from white matter signal and cerebrospinal fluid). 7) We regressed out the global signal to obtain the whole brain FC index.27
Definition of ROI in LGN, SC, and Hipp
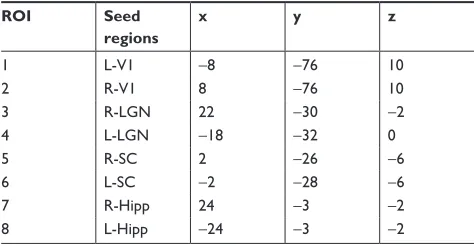
The ROI in bilateral V1, bilateral LGN, bilateral SC, and bilateral Hipp were selected according to previous studies,23,28–30 left V1(x=-8, y=-76, z=10) and right V1 (x=7, y=-76, z=10) and left LGN (x=-18, y=-32, z=0) and right LGN (x=22, y=-30, z=-2) and left SC (x=-2, y=-28, z=-6) and right SC (x=2, y=-26, z=-6) and left Hipp (x=-24, y=-3, z=-2) and right Hipp (x=24, y=-3, z=-2) (Table 1). For FC in V1 analysis, correlation analysis of time course was performed between the spherical seed
region and each voxel of the whole brain for each subject using REST software (http://www.resting-fmri.Sourceforge. net).31 Then, all FC maps were z-transformed with Fisher’s r-to-z transformation to reduce the influence of individual variations for group statistical comparisons. For FC between V1 and vision-related subcortical nuclei analysis, Pearson’s correlation coefficients between the mean time series of each pairwise V1 and vision-related nuclei were computed and converted to z-values using Fisher’s r-to-z transformation for group statistical comparisons.
Ophthalmic testing
For visual acuity testing, the visual acuity of all participants was measured by applying the logarithm of minimum angle of resolution table. Then, we checked the blind eyes with a flashlight to make sure they have no sensation of light. (All participants in this study were examined by two experienced ophthalmologists.)
statistical analysis
One-sample t-test was conducted to assess intragroup patterns of z-values functional connectivity (zFC) maps using SPM8 software (voxel-level: P,0.001, Gaussian random field [GRF] correction). Two-sample t-test was used to compare two group differences in the zFC maps and in the pairs of zFC maps between V1 and vision-related nuclei using the GRF method which was used to correct for multiple comparisons and regressed covariates of age and sex using the SPM 8 software (two-tailed, voxel-level: P,0.01, GRF correction, cluster-level: P,0.05).
Pearson correlation coefficient was used to assess the relationships between the zFC values of different brain regions and behavioral data in LB using SPSS version 20.0 software (IBM Corporation, Armonk, NY, USA).
Table 1 MNi coordinates for selected seed regions
ROI Seed
regions
x y z
1 l-V1 -8 -76 10
2 r-V1 8 -76 10
3 r-lgN 22 -30 -2
4 l-lgN -18 -32 0
5 r-sc 2 -26 -6
6 l-sc -2 -28 -6
7 r-hipp 24 -3 -2
8 l-hipp -24 -3 -2
Note: MNi coordinates for vision-related nuclei.
Abbreviations: hipp, hippocampus; l, left; lgN, lateral geniculate nucleus; MNi, Montreal Neurological institute; r, right; rOi, region of interest; sc, superior colliculus; V1, primary visual cortex.
Neuropsychiatric Disease and Treatment downloaded from https://www.dovepress.com/ by 118.70.13.36 on 25-Aug-2020
Dovepress
Wen et al
Results
Demographics measurements
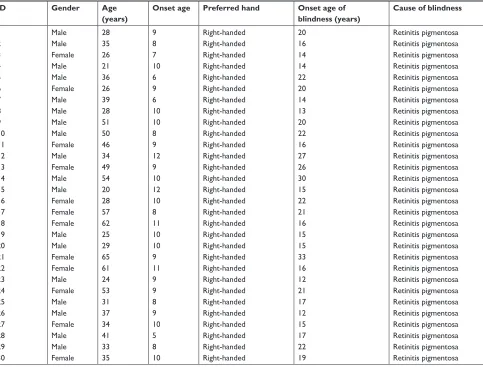
The demographics measurements of the LB group included parameters such as gender, age, preferred hand, onset age, onset age of blindness, and cause of blindness. Details are provided in Table 2.
Fc differences in rOi in V1
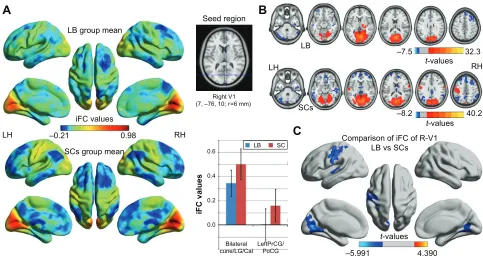
Distribution mean zFC patterns of left V1 and right V1 in group-level of LB and SCs subjects in the typical frequency band (0.01–0.1 Hz) are shown in Figures 1A and 2A. Intra-group patterns of zFC maps of left V1 and right V1 between the two groups are shown in Figures 1B and 2B. Compared with SCs, LB individuals showed decreased FC between the left V1 and the bilateral cuneus (CUN)/lingual gyrus (LGG)/ calcarine (CAL) (Brodmann area [BA] 18/19/30) and left precentral gyrus (PreCG) and postcentral gyrus (PostCG) (BA 2/3/4) (Figure 1C and Table 3). Also, LB individuals
showed decreased FC between the right V1 and the bilateral CUN/LGG/CAL (BA 18/19/30) and left PreCG and PostCG (BA 2/3/4/6) (Figure 2C and Table 3) (voxel-level: P,0.01, GRF correction, cluster-level: P,0.05).
Fc differences between V1 and
vision-related nuclei
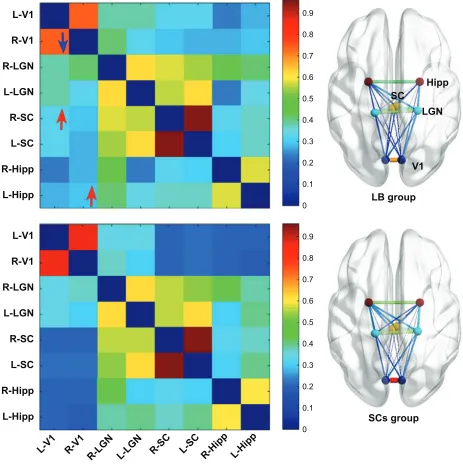
Compared with SCs, LB individuals showed decreased FC between the left V1 and the right V1 and increased FC between the left V1 and the right superior colliculus, the right V1, and the left Hipp (P,0.05) (Figure 3 and Table 4).
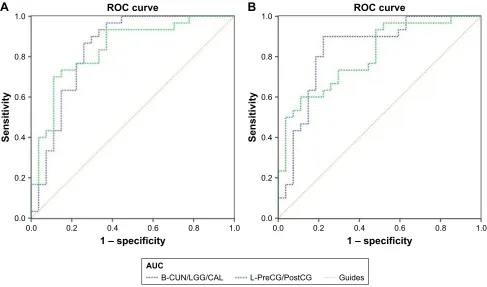
receiver operating characteristic (rOc)
curve
The mean FC values of the different brain regions were analyzed by the ROC curves. The areas under the curves for FC values were as follows: ROC curve in zFC in left V1: LB , SCs, for bilateral CUN/LGG/CAL 0.838
Table 2 Demographics and characteristics of late blindness
ID Gender Age
(years)
Onset age Preferred hand Onset age of blindness (years)
Cause of blindness
1 Male 28 9 right-handed 20 retinitis pigmentosa
2 Male 35 8 right-handed 16 retinitis pigmentosa
3 Female 26 7 right-handed 14 retinitis pigmentosa
4 Male 21 10 right-handed 14 retinitis pigmentosa
5 Male 36 6 right-handed 22 retinitis pigmentosa
6 Female 26 9 right-handed 20 retinitis pigmentosa
7 Male 39 6 right-handed 14 retinitis pigmentosa
8 Male 28 10 right-handed 13 retinitis pigmentosa
9 Male 51 10 right-handed 20 retinitis pigmentosa
10 Male 50 8 right-handed 22 retinitis pigmentosa
11 Female 46 9 right-handed 16 retinitis pigmentosa
12 Male 34 12 right-handed 27 retinitis pigmentosa
13 Female 49 9 right-handed 26 retinitis pigmentosa
14 Male 54 10 right-handed 30 retinitis pigmentosa
15 Male 20 12 right-handed 15 retinitis pigmentosa
16 Female 28 10 right-handed 22 retinitis pigmentosa
17 Female 57 8 right-handed 21 retinitis pigmentosa
18 Female 62 11 right-handed 16 retinitis pigmentosa
19 Male 25 10 right-handed 15 retinitis pigmentosa
20 Male 29 10 right-handed 15 retinitis pigmentosa
21 Female 65 9 right-handed 33 retinitis pigmentosa
22 Female 61 11 right-handed 16 retinitis pigmentosa
23 Male 24 9 right-handed 12 retinitis pigmentosa
24 Female 53 9 right-handed 21 retinitis pigmentosa
25 Male 31 8 right-handed 17 retinitis pigmentosa
26 Male 37 9 right-handed 12 retinitis pigmentosa
27 Female 34 10 right-handed 15 retinitis pigmentosa
28 Male 41 5 right-handed 17 retinitis pigmentosa
29 Male 33 8 right-handed 22 retinitis pigmentosa
30 Female 35 10 right-handed 19 retinitis pigmentosa
Neuropsychiatric Disease and Treatment downloaded from https://www.dovepress.com/ by 118.70.13.36 on 25-Aug-2020
Dovepress Fc of V1 in late blindness
$
6HHGUHJLRQ%
/HIW9 ±±U PP
%LODWHUDO
FXQH/*&DO /HIW3U&*3R&*
L)&YDOXHV
/% 6& /+
/% ±
WYDOXHV
±
WYDOXHV
6&V
5+
/+
±
WYDOXHV
5+ &RPSDULVRQRIL)&RI/9
/%YV6&V
&
/%JURXSPHDQ
L)&YDOXHV
6&VJURXSPHDQ ±
/+ 5+
Figure 1 Significant zFC maps of left V1 differences between two groups.
Notes: (A) Distribution mean zFC pattern of left V1 in group-level of LB and SC subjects in the typical frequency band (0.01–0.1 Hz). (B) Intragroup patterns of zFC maps of left V1 between two groups. (C) Significant zFC maps of left V1 differences between two groups (voxel-level: P,0.01, grF correction, cluster-level: P,0.05).
Abbreviations: GRF, Gaussian random field; iFC, intrinsic functional connectivity; LB, late blindness; LH, left hemisphere; RH, right hemisphere; SCs, sighted controls; V1, primary visual cortex; zFC, z-values functional connectivity.
$
6HHGUHJLRQ%
5LJKW9
±U PP
%LODWHUDO
FXQH/*&DO /HIW3U&*3R&*
L)&YDOXHV
/% 6& /+
/%
±
WYDOXHV
±
WYDOXHV
6&V
5+
±
WYDOXHV &RPSDULVRQRIL)&RI59
/%YV6&V
&
/%JURXSPHDQ
L)&YDOXHV
6&VJURXSPHDQ ±
/+ 5+
Figure 2 Significant zFC maps of right V1 differences between two groups.
Notes: (A) Distribution mean zFC pattern of right V1 in group-level of LB and SC subjects in the typical frequency band (0.01–0.1 Hz). (B) Intragroup patterns of zFC maps of right V1 between two groups. (C) Significant zFC maps of right V1 differences between two groups (voxel-level: P,0.01, grF correction, cluster-level: P,0.05).
Abbreviations: GRF, Gaussian random field; iFC, intrinsic functional connectivity; LB, late blindness; LH, left hemisphere; RH, right hemisphere; SCs, sighted controls; V1, primary visual cortex; zFC, z-values functional connectivity.
Neuropsychiatric Disease and Treatment downloaded from https://www.dovepress.com/ by 118.70.13.36 on 25-Aug-2020
Dovepress
Wen et al
Table 3 Significant differences in the FC of V1 between LB and SCs
Brain regions BA Peak t-scores MNI coordinates (x, y, z) Cluster size (voxels)
Fc in left V1
Bilateral cuneus/lingual gyrus/calcarine 18/19/30 -5.567 9, -75, 6 1,280
left precentral gyrus and postcentral gyrus 2/3/4 -4.183 -48, -24, 45 442
Fc in right V1
Bilateral cuneus/lingual gyrus/calcarine 18/19/30 -5.503 -15, -72, 3 1,238
left precentral gyrus and postcentral gyrus 2/3/4/6 -3.812 -60, -12, 33 422
Note: The statistical threshold was set at the voxel level with P,0.01 for multiple comparisons using Gaussian random-field theory (two-tailed, voxel-level: P,0.01, grF correction, cluster-level: P,0.05).
Abbreviations: BA, Brodmann area; FC, function connectivity; GRF, Gaussian random field; LB, late blindness; MNI, Montreal Neurological Institute; SCs, sighted controls; V1, primary visual cortex.
/9
59
5/*1
//*1
56&
/6&
5+LSS
/+LSS
/9 59 5/*1 //*1 56& /6& 5+LSS /+LSS
6&VJURXS
/9
59
5/*1
//*1
56&
/6&
5+LSS
/+LSS
+LSS
/%JURXS /*1 6&
9
Figure 3 Significant zFC maps of V1 and vision-related nuclei differences between two groups.
Notes: Visualization for abnormal rs-FC within V1 and vision-related nuclei between two groups(voxel-level: P,0.01, grF correction, cluster-level: P,0.05). red arrows denote increased Fc; blue arrows denote decreased Fc.
Abbreviations: FC, functional connectivity; GRF, Gaussian random field; Hipp, hippocampus; L, left; LB, late blindness; LGN, lateral geniculate nucleus; R, right; SCs, sighted controls; sc, superior colliculus; V1, primary visual cortex.
Neuropsychiatric Disease and Treatment downloaded from https://www.dovepress.com/ by 118.70.13.36 on 25-Aug-2020
Dovepress Fc of V1 in late blindness
(P,0.001; 95% CI: 0.726–0.950); for left-PreCG/PostCG 0.838 (P,0.001; 95% CI: 0.733–0.944) (Figure 4A); ROC curve in zFC in right V1: LB , SCs, for bilateral CUN/ LGG/CAL 0.835 (P,0.001; 95% CI: 0.723–0.946); for left-PreCG/PostCG 0.804 (P,0.001; 95% CI: 0.691–0.916) (Figure 4B).
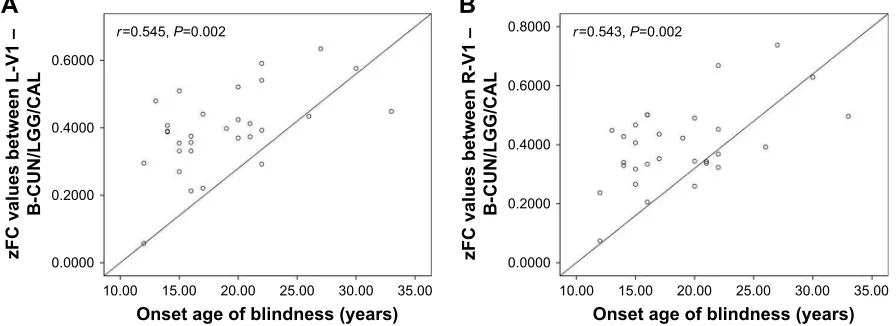
correlation analysis
In the LB group, a positive correlation was observed between the onset age of blindness and FC values in the left V1 (r=0.545, P=0.002; Figure 5A) and the right V1 (r=0.543, P=0.002) in LB (Figure 5B).
Discussion
To the best of our knowledge, the RSFC method used in this study provides a novel tool to assess correlation coefficients of BOLD signal time course between different brain regions. Our study was the first to investigate the effects of visual deprivation after key development periods on spontaneous functional organization between V1 and other brain areas. Compared with SCs, LB individuals exhibited decreased FC between the left V1 and the bilateral CUN/LGG/CAL (BA 18/19/30) as well as the left PreCG and PostCG (BA 2/3/4). Also, LB adults showed decreased FC between the right V1 and the bilateral CUN/LGG/CAL (BA 18/19/30) as well as the left PreCG and PostCG (BA 2/3/4/6). More-over, compared with SCs, LB individuals showed decreased FC between the left V1 and the right V1 and increased FC between the left V1 and the right SC, the right V1, and the left Hipp. Finally, the onset age of blindness showed posi-tive correlations between FC values of the left V1 and the left CUN/LGG/CAL (r=0.545, P=0.002), and FC values of the right V1 and the right CUN/LGG/CAL (r=0.543, P=0.002).
Table 4 abnormal rs-Fc within the vision-related nuclei between two groups
ROI 1 ROI 2 P-values
l-V1 r-V1 0.000127
l-V1 r-sc 0.031
r-V1 l-hipp 0.037
Note: rs-Fc within V1 and vision-related nuclei between two groups.
Abbreviations: hipp, hippocampus; l, left; r, right; rOi, region of interest; sc, superior colliculus; V1, primary visual cortex; rs-Fc, resting state-functional connectivity.
0.0 0.0 0.2 0.4 0.6 0.8 1.0
0.2 0.4 0.6
1 – specificity ROC curve
Sensitivit
y
0.8 1.0 0.00.0
0.2 0.4 0.6 0.8 1.0
0.2 0.4 0.6
1 – specificity ROC curve
Sensitivit
y
0.8 1.0
AUC
B-CUN/LGG/CAL L-PreCG/PostCG Guides
A
B
Figure 4 ROC curve analysis of the mean zFC values for altered brain regions.
Notes: (A) ROC curve in zFC in left V1: LB , scs, for B-cUN/lgg/cal 0.838 (P,0.001; 95% ci: 0.726–0.950); for l-Precg/Postcg 0.838 (P,0.001; 95% ci: 0.733–0.944). (B) ROC curve in zFC in right V1: LB , scs, for B-cUN/lgg/cal 0.835 (P,0.001; 95% ci: 0.723–0.946); for l-Precg/Postcg 0.804 (P,0.001; 95% ci: 0.691–0.916).
Abbreviations: aUc, area under the curve; B, bilateral; cal, calcarine; cUN, cuneus; Fc, functional connectivity; l, left; lgg, lingual gyrus; Postcg, postcentral gyrus; Precg, precentral gyrus; rOc, receiver operating characteristic; V1, primary visual cortex.
Neuropsychiatric Disease and Treatment downloaded from https://www.dovepress.com/ by 118.70.13.36 on 25-Aug-2020
Dovepress
Wen et al
U 3
2QVHWDJHRIEOLQGQHVV\HDUV
$
])&YDOXHVEHWZHHQ/9±
%&81/**&$/
U 3
2QVHWDJHRIEOLQGQHVV\HDUV
%
])&YDOXHVEHWZHHQ59±
%&81/**&$/
Figure 5 Significant correlation was observed between the onset age of blindness and zFC values in the (A) left V1 (r=0.545, P=0.002) and (B) right V1 (r=0.543, P=0.002) in lB individuals.
Abbreviations: B, bilateral; cal, calcarine; cUN, cuneus; Fc, functional connectivity; l, left; lgg, lingual gyrus; r, right; V1, primary visual cortex.
It is well known that the visual pathway consists of a ventral stream and a dorsal stream, which are the main routes for the processing of visual information. The ventral stream pathway originates from V1, goes through V2 and V4, and projects to the inferior temporal cortex, where identifica-tion of objects takes place. The dorsal stream starts from V1, goes through V2, V6, and V5, and finally projects to the posterior parietal cortex, which plays an important role in spatial information.32 Visual signals are processed in visual stream, following top-down modulations through feedback connections. The feedback connection between these visual areas contributes to the comprehension of the visual scene, visual attention, and visual recall.33,34 A previ-ous study provided evidence that V1 was closely associ-ated with higher visual cortices relassoci-ated to visual imagery function in normal sighted individuals.35 Neuroimaging studies have demonstrated that mental image function is involved in V1 and higher visual cortices activation.36,37 The degeneration of the visual pathway and the visual cortex is subsequent to visual deprivation in late life. A previ-ous diffusion tensor imaging study revealed that reduced fractional anisotropy in optic radiations is observed in LB compared with normal sighted individuals.38 Meanwhile, another study reported that late-blinded individuals induced by RP exhibited lower gray matter volume in the visual cortices.39 Abnormal structural changes in visual cortices may be related to the spontaneous neural activity in the visual area. Alternatively, Qin et al demonstrated that LB showed a decreased FC density in V1.14 Consistent with these findings, we observed decreased FC between the bilateral V1 and the bilateral CUN/LGG/CAL (BA 18/19/30) in LB individuals, indicating a disconnection in
the visual network. Furthermore, a positive correlation was observed between the onset age of blindness and FC values between bilateral V1 and BA 18/19/30 in LB individuals, indicating that the duration of blindness is closely related to the FC within the visual network. Thus, we speculate that visual deprivation after critical development periods induces impairment of top-down modulations, visual imag-ery function, and visual attention.
PreCG is the location of the primary motor cortex, which plays an important role in motor control, especially in movement control. In normal sighted subjects, the coor-dination of visual and motor cortices is involved in a variety of tasks implying vision-motor function. Vision-motor function is critical in the integration of visual perception and motor skills.40,41 A previous study revealed that visual and motor cortices were associated with similar activation during a visual tracking task.42 Meanwhile, PreCG showed a significant positive correlation with V1 without any task stimulation.35 Thus, there is a robust correlation between the visual and motor cortices in normal sighted subjects. A previous fMRI study reported a significant decreased FC between V1 and the motor cortices in EB.23 In support of these study findings, the reduced visual input in LB may also contribute to the decreased FC between the bilateral V1 and the left PreCG. Decreased FC between the bilateral V1 and the left PreCG was observed in our study, which might be due to the right-handed subjects in our study. Moreover, cross-modal plasticity occurs in visual cortices in blind subjects.43 Since the visual cortex is involved in the motor function of LB individuals, we speculated that the reduced visual input and cross-modal plasticity might contribute to the decreased FC between motor cortices and V1.
Neuropsychiatric Disease and Treatment downloaded from https://www.dovepress.com/ by 118.70.13.36 on 25-Aug-2020
Dovepress Fc of V1 in late blindness
PostCG is the site of the primary somatosensory cor-tex, which is involved in multiple sensory perceptions. PostCG is also responsible for the touch and pain sense.44,45 Previous studies have demonstrated that the visual cortex and PostCG showed robust correlation in SCs, which involved in combining processing of spatial visual and somatosen-sory information.35,46 In our study, our results revealed a significantly reduced FC between V1 and left somatosen-sory cortices in LB individuals compared to SCs. For one reason, the reduced visual input might lead to decreased FC between the V1 and somatosensory cortices in LB individu-als. For another reason, the phenomenon might reflect the cross-modal plasticity in V1. In blind humans, tactile stimuli activate the visual cortex through the somatosensory cortex.47 Indeed, Braille reading leads to the activation of the visual cortex in blind individuals.48 Sadato et al found that the blind individuals had visual cortex activation during tactile tasks, whereas SC showed deactivation using the PET method.5 The visual cortex might be activated by other sensory modalities. Ptito M et al demonstrated that visual deprivation from an early age could lead to the visual cortex being recruited to a role in somatosensory processing.49 Thus, we speculated that the visual cortex shows a shift of visual information to soma-tosensory processing. These changes might lead to alterations of intrinsic connectivity between the visual cortices and somatosensory cortices in blind humans. A previous study also reported decreased FC between the V1 and somatosen-sory cortices in EB individuals.23 Combined with these points, we concluded that the reduced visual input and visual cortices representations of sensory modalities might contribute to the decreased FC between somatosensory cortices and V1. Decreased FC between the bilateral V1 and the left PostCG was observed in our study, which might be due to the right-handed subjects.
Furthermore, decreased FC between the left V1 and the right V1 was observed in LB groups relative to SCs groups. Hou et al demonstrated decreased interhemispheric FC in V1 in EB individuals.50 Another study reported that monocular blindness was associated with decreased interhemispheric FC in V1.51 Consistent with these studies, we found that LB groups showed a significant decreased interhemispheric FC in V1, indicating abnormal interhemispheric coordination in V1. Interestingly, increased FC between the left V1 and the right superior colliculus was observed in LB groups rela-tive to SCs groups. Superior colliculus plays an important role in visual spatial attention.52 The increased FC between V1 and superior colliculus might reflect the reorganization of visual spatial attention in LB individuals.
Conclusion
In summary, our results highlighted that visual deprivation after sensitive development periods induces decreased FC between V1 and higher visual areas, motor cortices, and soma-tosensory cortices at rest. These results may provide some useful information for the understanding of the underlying reorganization of V1 occurring in LB individuals. Our findings indicate that LB adults might present with abnormal top-down modulations, visual imagery, and vision-motor function.
Acknowledgments
We acknowledge the assistance provided by the National Nature Science Foundation of China (grant no. 81470628 and 81800872), International Science & Technology Cooperation Program of China (2017YFE0103400), and Young Teachers’ Independent Research Funding of Wuhan University (no 2042018kf0178). This was not an industry supported study.
Disclosure
The authors report no conflicts of interest in this work.
References
1. Mower GD, Christen WG. Role of visual experience in activating critical period in cat visual cortex. J Neurophysiol. 1985;53(2):572–589. 2. Desai NS, Cudmore RH, Nelson SB, Turrigiano GG. Critical periods for
experience-dependent synaptic scaling in visual cortex. Nat Neurosci. 2002;5(8):783–789.
3. Fox K, Daw N, Sato H, Czepita D. The effect of visual experience on development of NMDA receptor synaptic transmission in kitten visual cortex. J Neurosci. 1992;12(7):2672–2684.
4. Collignon O, Vandewalle G, Voss P, et al. Functional specialization for auditory-spatial processing in the occipital cortex of congenitally blind humans. Proc Natl Acad Sci U S A. 2011;108(11):4435–4440. 5. Sadato N, Pascual-Leone A, Grafman J, et al. Activation of the
pri-mary visual cortex by Braille reading in blind subjects. Nature. 1996; 380(6574):526–528.
6. Ofan RH, Zohary E. Visual cortex activation in bilingual blind indi-viduals during use of native and second language. Cereb Cortex. 2007; 17(6):1249–1259.
7. De Volder AG, Bol A, Blin J, et al. Brain energy metabolism in early blind subjects: neural activity in the visual cortex. Brain Res. 1997; 750(1–2):235–244.
8. Liu C, Liu Y, Li W, et al. Increased regional homogeneity of blood oxygen level-dependent signals in occipital cortex of early blind indi-viduals. Neuroreport. 2011;22(4):190–194.
9. Jiang J, Zhu W, Shi F, et al. Thick visual cortex in the early blind.
J Neurosci. 2009;29(7):2205–2211.
10. Ptito M, Schneider FC, Paulson OB, Kupers R. Alterations of the visual pathways in congenital blindness. Exp Brain Res. 2008;187(1): 41–49.
11. Pan WJ, Wu G, Li CX, Lin F, Sun J, Lei H. Progressive atrophy in the optic pathway and visual cortex of early blind Chinese adults: a voxel-based morphometry magnetic resonance imaging study. Neuroimage. 2007;37(1):212–220.
12. Collignon O, Dormal G, Albouy G, et al. Impact of blindness onset on the functional organization and the connectivity of the occipital cortex.
Brain. 2013;136(Pt 9):2769–2783.
Neuropsychiatric Disease and Treatment downloaded from https://www.dovepress.com/ by 118.70.13.36 on 25-Aug-2020
Dovepress
Wen et al
13. Büchel C, Price C, Frackowiak RS, Friston K. Different activation patterns in the visual cortex of late and congenitally blind subjects.
Brain. 1998;121(Pt 3):409–419.
14. Qin W, Xuan Y, Liu Y, Jiang T, Yu C. Functional connectivity density in congenitally and late blind subjects. Cereb Cortex. 2015;25(9): 2507–2516.
15. Burton H, Snyder AZ, Raichle ME. Resting state functional connectivity in early blind humans. Front Syst Neurosci. 2014;8(159):51. 16. Hartong DT, Berson EL, Dryja TP. Retinitis pigmentosa. Lancet.
2006;368(9549):1795–1809.
17. Tsujikawa M, Wada Y, Sukegawa M, et al. Age at onset curves of retinitis pigmentosa. Arch Ophthalmol. 2008;126(3):337–340. 18. Jiang C, Yi L, Su S, et al. Diurnal variations in neural activity of healthy
human brain decoded with resting-state blood oxygen level dependent fMRI. Front Hum Neurosci. 2016;10:634.
19. Auer DP. Spontaneous low-frequency blood oxygenation level- dependent fluctuations and functional connectivity analysis of the “resting” brain. Magn Reson Imaging. 2008;26(7):1055–1064. 20. Friston KJ, Frith CD, Liddle PF, Frackowiak RS. Functional
connectiv-ity: the principal-component analysis of large (PET) data sets. J Cereb
Blood Flow Metab. 1993;13(1):5–14.
21. Ogawa S, Lee TM, Kay AR, Tank DW. Brain magnetic resonance imaging with contrast dependent on blood oxygenation. Proc Natl Acad
Sci U S A. 1990;87(24):9868–9872.
22. Wittenberg GF, Werhahn KJ, Wassermann EM, Herscovitch P, Cohen LG. Functional connectivity between somatosensory and visual cortex in early blind humans. Eur J Neurosci. 2004;20(7):1923–1927. 23. Yu C, Liu Y, Li J, et al. Altered functional connectivity of primary visual
cortex in early blindness. Hum Brain Mapp. 2008;29(5):533–543. 24. Burton H, Snyder AZ, Raichle ME. Resting state functional connectivity
in early blind humans. Front Syst Neurosci. 2014;8:51.
25. Yan CG, Wang XD, Zuo XN, Zang YF. DPABI: data processing & analysis for (Resting-State) brain imaging. Neuroinformatics. 2016; 14(3):339–351.
26. Goto M, Abe O, Aoki S, et al. Diffeomorphic Anatomical Registration Through Exponentiated Lie Algebra provides reduced effect of scanner for cortex volumetry with atlas-based method in healthy subjects.
Neuroradiology. 2013;55(7):869–875.
27. Murphy K, Birn RM, Handwerker DA, Jones TB, Bandettini PA. The impact of global signal regression on resting state correlations: are anti-correlated networks introduced? Neuroimage. 2009;44(3): 893–905.
28. Dai H, Morelli JN, Ai F, et al. Resting-state functional MRI: functional connectivity analysis of the visual cortex in primary open-angle glau-coma patients. Hum Brain Mapp. 2013;34(10):2455–2463.
29. Krebs RM, Woldorff MG, Tempelmann C, et al. High-field FMRI reveals brain activation patterns underlying saccade execution in the human superior colliculus. PLoS One. 2010;5(1):e8691.
30. Giovanello KS, Schnyer DM, Verfaellie M. A critical role for the anterior hippocampus in relational memory: evidence from an fMRI study comparing associative and item recognition. Hippocampus. 2004; 14(1):5–8.
31. Song XW, Dong ZY, Long XY, et al. REST: a toolkit for resting-state functional magnetic resonance imaging data processing. PLoS One. 2011; 6(9):e25031.
32. Wang J, Zhou T, Qiu M, et al. Relationship between ventral stream for object vision and dorsal stream for spatial vision: an fMRI + ERP study. Hum Brain Mapp. 1999;8(4):170–181.
33. Gilbert CD, Li W. Top-down influences on visual processing. Nat Rev
Neurosci. 2013;14(5):350–363.
34. Lu KH, Jeong JY, Wen H, Liu Z. Spontaneous activity in the visual cortex is organized by visual streams. Hum Brain Mapp. 2017;38(9): 4613–4630.
35. Wang K, Jiang T, Yu C, et al. Spontaneous activity associated with primary visual cortex: a resting-state FMRI study. Cereb Cortex. 2008; 18(3):697–704.
36. Kosslyn SM, Thompson WL, Kim IJ, Alpert NM. Topographical rep-resentations of mental images in primary visual cortex. Nature. 1995; 378(6556):496–498.
37. D’Esposito M, Detre JA, Aguirre GK, et al. A functional MRI study of mental image generation. Neuropsychologia. 1997;35(5):725–730. 38. Dietrich S, Hertrich I, Kumar V, Ackermann H. Experience-related
structural changes of degenerated occipital white matter in late-blind humans – a diffusion tensor imaging study. PLoS One. 2015;10(4): e0122863.
39. Machado AR, Pereira AC, Ferreira F, et al. Structure-function correla-tions in Retinitis Pigmentosa patients with partially preserved vision: a voxel-based morphometry study. Sci Rep. 2017;7(1):11411. 40. Daly CJ, Kelley GT, Krauss A. Relationship between visual-motor
integration and handwriting skills of children in kindergarten: a modi-fied replication study. Am J Occup Ther. 2003;57(4):459–462. 41. Pelz J, Hayhoe M, Loeber R. The coordination of eye, head, and hand
movements in a natural task. Exp Brain Res. 2001;139(3):266–277. 42. Kruse W, Dannenberg S, Kleiser R, Hoffmann KP. Temporal relation
of population activity in visual areas MT/MST and in primary motor cortex during visually guided tracking movements. Cereb Cortex. 2002; 12(5):466–476.
43. Gizewski ER, Gasser T, de Greiff A, Boehm A, Forsting M. Cross-modal plasticity for sensory and motor activation patterns in blind subjects. Neuroimage. 2003;19(3):968–975.
44. Ploner M, Schmitz F, Freund HJ, Schnitzler A. Differential organi-zation of touch and pain in human primary somatosensory cortex.
J Neurophysiol. 2000;83(3):1770–1776.
45. Wrigley PJ, Press SR, Gustin SM, et al. Neuropathic pain and primary somatosensory cortex reorganization following spinal cord injury.
Pain. 2009;141(1–2):52–59.
46. Nir Y, Hasson U, Levy I, Yeshurun Y, Malach R. Widespread func-tional connectivity and fMRI fluctuations in human visual cortex in the absence of visual stimulation. Neuroimage. 2006;30(4):1313–1324. 47. Cunningham SI, Weiland JD, Bao P, Tjan BS. Visual cortex activation
induced by tactile stimulation in late-blind individuals with retinitis pig-mentosa. Conf Proc IEEE Eng Med Biol Soc. 2011;2011:2841–2844. 48. Burton H, Snyder AZ, Conturo TE, Akbudak E, Ollinger JM,
Raichle ME. Adaptive changes in early and late blind: a fMRI study of Braille reading. J Neurophysiol. 2002;87(1):589–607.
49. Ptito M, Kupers R. Cross-modal plasticity in early blindness. J Integr
Neurosci. 2005;4(4):479–488.
50. Hou F, Liu X, Zhou Z, Zhou J, Li H. Reduction of interhemispheric functional brain connectivity in early blindness: a resting-state fMRI Study. Biomed Res Int. 2017;2017:6756927.
51. Shao Y, Bao J, Huang X, et al. Comparative study of interhemispheric functional connectivity in left eye monocular blindness versus right eye monocular blindness: a resting-state functional MRI study. Oncotarget. 2018;9(18):14285–14295.
52. Krauzlis RJ, Lovejoy LP, Zénon A. Superior colliculus and visual spatial attention. Annu Rev Neurosci. 2013;36:165–182.
Neuropsychiatric Disease and Treatment downloaded from https://www.dovepress.com/ by 118.70.13.36 on 25-Aug-2020
Neuropsychiatric Disease and Treatment
Publish your work in this journal
Submit your manuscript here: http://www.dovepress.com/neuropsychiatric-disease-and-treatment-journal
Neuropsychiatric Disease and Treatment is an international, peer-reviewed journal of clinical therapeutics and pharmacology focusing on concise rapid reporting of clinical or pre-clinical studies on a range of neuropsychiatric and neurological disorders. This journal is indexed on PubMed Central, the ‘PsycINFO’ database and CAS,
and is the official journal of The International Neuropsychiatric Association (INA). The manuscript management system is completely online and includes a very quick and fair peer-review system, which is all easy to use. Visit http://www.dovepress.com/testimonials.php to read real quotes from published authors.
Dovepress
Dove
press
Fc of V1 in late blindness
Neuropsychiatric Disease and Treatment downloaded from https://www.dovepress.com/ by 118.70.13.36 on 25-Aug-2020