Abstract—Experimental pain has extensively been used as a
tool for investigating neural mechanisms and the psychological factors involved in pain processing. The detection of existence and/or level of pain is vital when verbal information is not present e.g. for infants, disabled persons, anesthetized patients and animals also. This study shows that there is a firm relation between Electroencephalogram (EEG) and chronic pain levels and EEG can be used as a reliable tool for detecting, measuring and diagnosing pain levels in humans.
This paper proposed a use of wavelet coherency in order to estimate the three pain levels and its usage as an index for pain measurement. Besides, wavelet coefficients are studied to show consistencies with EEG dynamic were extracted to provide the feature vector. A Hidden Markov Model (HMM) and a support vector machine (SVM) scheme was used for pain levels classification. This study confirms the hypothesis that brain pattern under the chronic pain mental task is mapped on EEG and the dependency of brain patterns to EEG is possible and detectable.
Index Terms—Chronic pain index, electroencephalogram,
SVM, HMM.
I. INTRODUCTION
The brain mechanisms during chronic pain become an interesting topic in recent years. Studying evoked brain potentials can access brain responses to phasic pain. Steriade et al. has been studied the relation between brain status and cortical EEG activities [1], [2].
Lopes and Steriade et al. studied the tonic experimental pain stimulus, its effect on EEG subbands in the cortical areas and reported decrease in alpha and increase in gamma amplitude [1]-[3]. A few EEG changes have been repeatedly observed during processing of tonic pain. Although this hypothesis has a strong theoretical basis, it was not confirmed in recent clinical studies performed over the past two decades.
Steriade et al. and Dowman et al. studied the effect of pain on brain mechanism and reported a decrease in fronto-central, but a large number of studies reported no changes [2]-[4]. Huber et al. and Chang et al. found decrease in the alpha on primary somatosensory cortex [5]-[7].
These results have been obtained without any consistency. The brain mechanism and EEG pattern during pain generally is due to sensory processing and to all effective and cognitive processes linked to sensory processing [5], [8]. It seems that the lack of clear and consistent answer to this question is related to the methods used for analysis. All of these studies
Manuscript received January 19, 2015; revised April 28, 2015. The authors are with the Computer Science Department, Stevens Institute of Technology, New Jersey, USA (e-mail: [email protected], [email protected]).
used statistical methods that are inconsistent with dynamic characteristic of EEG. Most methods used so far have relied on stationary EEG signals. However, this assumption could lead to inconstant results.
Schulz et.al studied individual pain sensitivity prediction using EEG and reported 83% accuracy [9]. Panavaranan and Wongsawat used a fuzzy logic intelligent method in order to classify the pain level and reach to 96.97% of accuracy [10]. It should be noted that all of past researches have considered only one level of pain and studied its detection and classification based on existence or absence of pain. However, in this study 3 levels of pain; no-pain, pain and unbearable pain have been considered in which the two last levels have significantly similar EEG patterns and hard to differentiate and measure.
II. METHODS
A. Data Collection
Thirteen young, healthy right-handed volunteers have been participated in this study. They were suffering from any acute and chronic diseases. They were studied drug free and were given a detailed explanation about the test procedure before test. Complete EEG recordings, based on the 10/20 electrode system, were obtained.
The recording sessions took place in a sound-attenuated room with dimmed luminescence. After lead fixation, 2 min baseline EEG was recorded in order to find the pathological EEG patterns and individual pain threshold of each subject.
Pain condition was imposed using bucket of ice water. Subject was asked put his left hand on the bucket and if the pain became unbearable he could take his hand out of the water. The subjects report the perceived pain intensity rate verbally as well. Volunteers were allowed to avoid continue in case of inconvenience. The mean temperature during the test were fixed at 4.4 ± 1.1 °C [11].
EEG was recorded with 200HZ sampling frequency, down sampled to 128HZ and an epileptic filter with 0.5-30HZ bandwidth has been applied as preprocessing. Two seconds segments were also used for windowing.
B. Wavelet Coherency
Wavelet coherency has been used here to follow the coherency time-course between EEG signals. It has been used recently in physics to estimate interactions of nonstationary signals [12]. One of most important features of wavelet coherency is that it considers the phase relationships between two signals. Phase changes in brain activity pattern associated with the subject`s physiologic state [13].
In general, the coherence function defined as below; two zero-mean random process x and y have been considered, the
Pain Level Measurement Using Discrete Wavelet
Transform
coherence between x and y at frequency f is defined:
(1) where is the cross-spectral between x and y. It can be
shown that if is close to 1, then x can be linearly approximated of y.
Following Miligen et al. and Santoso et al., signals are decomposed using Morlet Wavelet. It is worth mentioning that many other wavelets can be used, but Morlet Wavelet is simple and suitable for spectral estimation. For frequency f and time t is defined [13], [14].
(2) where is the product of Gaussian function centered at time t, with sinusoidal wave at frequency f. If we show the wavelet transform of signal x(u) by
(3)
where δ is a scalar that depend on frequency. Considering these relations the wavelet coherence WCo(t, f) is defined as below:
(4) The physical interpretation of the wavelet coherence is same as classic coherence estimation. Namely, it is also estimate the degree of linear relationship between two signals. So it is used as an index for pain levels which is changes between 0 and 1.
C. Feature Extraction
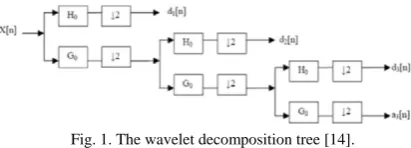
In this study, we developed a time-frequency wavelet based scheme for EEG signals. The discrete wavelet transform decomposed the signal into coarse approximation and detail information and analyzed it at different frequency subbands with different resolutions. Fig. 1 shows the multiresolution decomposition procedure for signal x [n].
Fig. 1. The wavelet decomposition tree [14].
Gs indicate the low pass filters and Hs represent high pass filters. At each level, high pass filter produces detail information, d[n]. Meanwhile, low pass filter associated with scaling function produces coarse approximations, a[n].using this approach, high frequency resolution at time and low frequency resolution at frequency will be achieved [15].
Choosing the proper wavelet coefficients and the number of decomposition levels plays an important role in EEG analysis. The number of decomposition levels was chosen according to the EEG dominant sub frequencies. Table I shows different wavelet decomposition levels corresponding
to EEG sub frequencies.
D2 (16-32 HZ) mostly include the β rhythm (18-26 HZ) and D3 (8-16HZ) include the μ rhythm (8-12 HZ). The sub band D4 (4-8HZ) and A4 (0-4 HZ) represents θ (5-7 HZ) and δ (0-4HZ) respectively.
In order to decrease the dimension of the extracted features, statistical analysis have been used to characterize the time frequency of EEG distribution.
1) Mean of coefficient’s absolute value for each sub band. 2) Standard division of coefficient`s for each sub band. 3) Minimum of coefficient`s for each sub band
4) Maximum of coefficient`s for each sub band.
Mean indicates the frequency distribution of the signal and standard division represents variability in its distribution. These two features also consistent with EEG dynamical pattern. In order to cover the statistical EEG characteristic, minimum and maximum were extracted as well.
TABLEI:THE WAVELET DECOMPOSITION LEVELS AND CORRESPONDING
FREQUENCIES
Decomposed Signal Frequency range (HZ)
D1 32-64
D2 16-32
D3 8-16
D4 4-8
A4 0-4
D. SVM Classifier
Support vector machines (SVM) are basically binary classification algorithms. If the input data is linearly separable, SVM computes the hyper-plane that maximizes the margin, i.e., the distance from nearest training points (Fig 2).
Fig.2. SVM hyper-plane[16].
When the data are not linearly separable, they mapped to the higher dimensional space where such a separating hyper plane can be found using the “kernel trick”. The kernel function k(x,x_i^SV) implicitly compute x→∅(x) mapping and subsequent scalar multiplication ∅(〖x)〗^T∅(x_i^SV). One of the key elements of SVM classifier concerns the choice of kernel. It is shown that RBF kernel has the best performance in EEG processing. We also experimented with Gaussian, MLP and polynomial kernels which their results were not satisfactory. The only free parameter, in SVMs control the trade off between the maximization of margin and the misclassification.
The trade-off parameter C was selected at 100 and kernel parameter σ was chosen 0.5 [16], [17]. 10-fold cross validation was applied also in order to find the optimized parameters where the results were close with the selected parameters [18].
E. HMM
Hidden Markov Model (HMM) is a statistical model that has been used to different areas [17]-[20]. Lotte et al. applied HMM on EEG based brain computer interfaces [17]. Obermaier et al. used mHMM for online classification of single trial EEG data and improved online experiment determination of minimal classification error [19]. Solhjoo et al. classified EEG-based mental task and hypnotized subjets using HMM [21], [22].
HMM can model temporal or sequential structures of the EEG signal by combining the observation and hidden states. In order to use HMM as a classifier, feature vectors are same as observation sequences. For training the model Expectation Maximization (EM) algorithm has been used. Training model consist of estimating the transient probability between every state of the model and observation sequence. Selecting the hidden state, the number of symbols in every state in dHMM and the number of Mixture Gaussian models in mHMM depends on the underlying physiological event. Considering ERD/ERS signal e.g. four emitting state can be selected which is corresponding to four significant phases (silence, desynchronization, synchronization, silence) of ERD/ERS [23].
Fig. 3. An illustration of HMM which is consistent with EEG [21].
We have applied discrete HMM (dHMM) in which observation sequence has been made discrete and quantized. The number of states of models were chosen between 1 and 4 which are correspond to EEG sub bands, and the number of quantization level was seleceted between 22 and 28. Initial probability matrices have been chosen randomly.
In mixture model HMM (mHMM) the observation sequence model used some Gaussian mixture models. The Gaussian mixtures initiated by K-means and then trained with EM. The number of Gaussian mixtures has been considered between 1-10. In order to decrease the effect of initial condition, randomly cross validation has been used for both dHMM and mHMM both.
III. RESULTS
In this study we claim that brain patterns under the chronic pain change significantly and it is possible to differentiate these levels. We have applied a use of wavelet coherency as
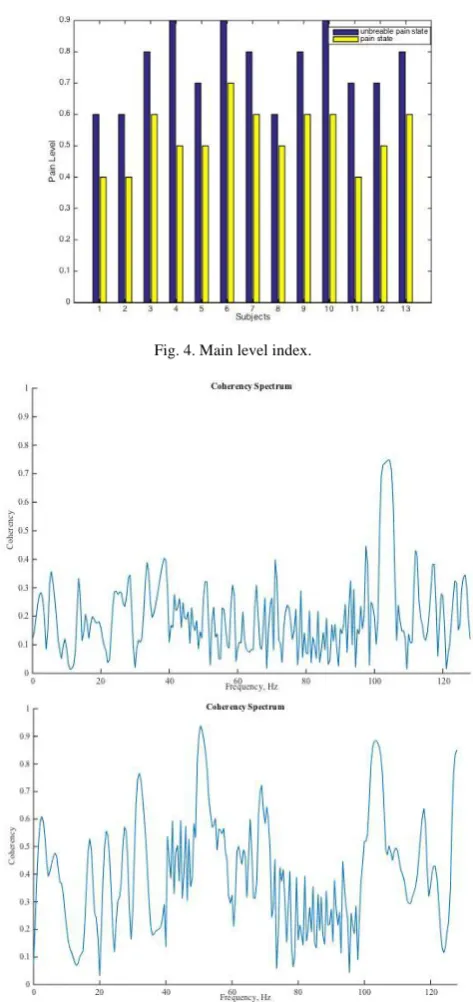
an index of pain levels. It shows EEG signals dependency during three levels of pain namely; no-pain, pain and intolerable pain. Alpha has been distinguished as the most important EEG subband so alpha ratio has been extracted for all of the subjects. It used as a tool to investigate the wavelet coherency and their changes have been studied during three levels of pain. The pain level index increases correspond to the pain severity. Fig. 4 shows the index level of pain during three existing levels from all thirteen subjects. The bar chart shows that the level of pain in rest state is lower than level of pain in the pain state and unbearable pain. Pain level estimation confirms that wavelet coherency is proper tool to reflect pain level.
Fig. 4. Main level index.
Fig. 5. Coherency spectrum between no-pain and pain (top), pain and
intolerable pain (below).
Fig. 5 shows the wavelet coherency diagram between pain and no-pain (top), between pain an intolerable pain (below) for one of the subjects. As it can be seen from diagram the START SILENCE
ERO
coherence between EEG signals during the no-pain and pain levels is moderate. In other words, since the brain phase completely differs in transition from baseline (no-pain) to pain the dependency between these two patterns is small. However, transition form pain to intolerable pain has been reflected with an increase in coherency as a factor of more similarity in these two brain state levels. It should be mentioned that main frequencies of human EEG signals are included in 0-30HZ bandwidth.
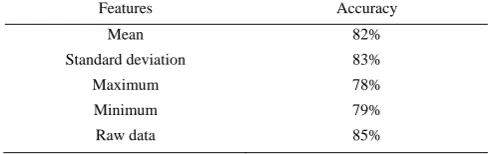
The classification results also confirm our claim that the EEG pattern changes significantly during pain and relaxation. It is found that relaxation (no pain) and pain differentiate very well. Hence Raw data classification lead to high accuracy. In other words, for classifying between no-pain and pain raw data would be enough and there is no need for feature extraction (see Table II). Table II shows the classification result for no-pain and pain levels.
Table III results proved that the brain pattern under pain and intolerable pain is much more similar so differentiating between these two levels is more problematic and lead to lower accuracy.
TABLEII:NO-PAIN AND PAIN LEVELS CLASSIFICATION BASED ON SVM Features Accuracy
Mean 82%
Standard deviation 83% Maximum 78% Minimum 79% Raw data 85%
The raw data could not be used for pain and intolerable pain classification (see Table III) since the brain mechanism under these workloads are unlikely to differentiate with out any further processing. Table III represents the classification rate between pain and intolerable pain using wavelet coefficients. The results were reported for both SVM and HMM classifiers and it compares their power in EEG classification.
TABLEIII:PAIN AND INTOLERABLE PAIN CLASSIFICATION
SVM(RBF) SVM(POLY) dHMM mHMM Mean 78% 72% 63% 65% Standard
deviation
74% 69% 60% 63% Maximum 69% 66% 58% 64% Minimum 67% 67% 59% 63% Raw data <50% <50% <50% <50%
TABLEIV:COMBINED FEATURES CLASSIFICATION
SVM(RBF) SVM(POLY) dHMM mHMM Combined
features
95% 90% 78% 65%
In order to improve the accuracy, we combined the four features and applied them once as a classifier input. Table IV shows the result of combined feature classification which shows that increasing the number of inputs might lead to better performance.
In general, RBF kernel SVM has the better result comparing to polynomial kernel and hidden markov model classifiers.
The strong theoretical foundations of the SVM allow us to
optimize several parameters of a kernel function using analytical methods. The overfitting was avoided by controlling the trade-of between the training error minimization and the learning capacity of the decision functions.
IV. DISCUSSION
Distinguish pain level or its existence lead to improve the treatment methods. A lot of studies have been reported inconsistent results about pain and its effect on brain mechanisms. However, despite its strong theoretical basis, experimental results are not satisfactory and all of these papers studied only the existence or nonexistence of pain [1]-[10]. In this study, we have shown that brain mechanism has changed significantly comparing pain and no-pain levels. We also propose a use of wavelet coherency to use it as a pain level measurement tool. Pain severity corresponds to increase the index .
It has been shown that despite the close dependency and correlation between pain and intolerable pain, it is possible to differentiate them with very high accuracy. This result proves that EEG processing using special methods makes pain level diagnosis possible.
Wavelet coherency showed that the EEG signals are less coherent during no-pain and pain levels. Furthermore, consistent with its theoretical basis the dependency between EEG patterns increased during the same mental workload which it was explained above.
A classification method based on SVM and HMM proposed in this paper. It showed that SVM has a better performance on EEG data and confirm the pervious studies results [24]. In general, mHMM has a better performance than dHMM. In mHMM computations are more complicated since feature vectors use some Gaussian mixture models. It also uses statistical characteristics of signal as an input so it could help giving better results. It has also shown that features combination increased the classifiers performance significantly except mHMM accuracy rate. In general, the mHMM performance does not change considerably using combined feature which might because it made mixture model HMM more complicated than before and increased its complexity.
REFERENCES
[1] M. Steriade, P. Gloor, R. R. Llinas, F. H. L. D. Silva, and M. M.
Mesulam, “Basic mechanisms of cerebral rhythmic activities,”
Electroencephalogram Clin Neurophysiology, vol. 76, pp. 481–508, 1990.
[2] F. Britton and M. Skevington, “A mathematical model of the gate control the theory of pain,” Journal of Theoretical Biology,vol. 137, pp. 91-105, 1989.
[3] L. L. Egsgaard, L. Wang, and L. A. Nielsen, “Volunteers with high versus low Alpha EEG have different pain–EEG relationship: A human experimental study,” Exp Brain Res, 2009.
[4] F. H. L. D. Silva, “Neural mechanisms underlying brain waves: From neural membranes to networks,” Electroencephalogram Clin Neurophysiology, vol. 79, pp. 81–93, 1991.
[5] R. Dowman and T. M. Darcey, “SEP topographies elicited by innocuous and noxious sural nerve stimulation dipole source analysis,”
Electroencephalogr Clin Neurophysiol, vol. 92, pp. 373-391, 1994. [6] M. T. Huber and J. Bartling, “EEG Responses to tonic heat pain,” Exp
Brain Res, vol. 173, pp. 14–24, 2006.
[7] P. F. Chang, L. A. Nielsen, T. G. Nielsen, P. Svensson, and C. Chan, “Topographic effects of tonic cutaneous nociceptive stimulation on
human electroencephalograph,” Neurosci Lett,vol. 305, pp. 49–52, 2001.
[8] A. C. N. Chen, S. F. Dworkin, J. J. Haug, and J. Gehrig, “Topographic brain measures of human pain and pain responsivity,” Pain, vol. 37, pp. 129– 141, 1989.
[9] E. Schulz and A. Zherdin, “Decoding and individual`s sensitivity to pain from the multivariate analysis of EEG data,” Cereb Cortex, vol. 22, vol. 5, pp. 1118-1123, 2012.
[10] M. Vatankhah, V. Asadpour, and R. F Rezaee, “Perceptual pain classification using ANFIS adapted RBF kernel support vector machine for therapeutic usage,” Applied Soft Computing, vol. 11, pp. 032, 2012.
[11] P. Panavaranan and Y. Wongsawat, “EEG-based pain estimation via fuzzy logic polynominal kernel support vector machine,” in Proc. International Conference on Biomedical Engineering, 2013. [12] J. P. Lachaux, A. Lutz, D. Rudrauf, D. Cosmelli, M. L. V. Quyen, J.
Martinerie, and F. Varela, “Estimating the time-course of coherence between single-trial brain signals: An introduction to wavelet coherence,” Neurophysiol Clin, vol. 32, pp. 157-174, 2002.
[13] S. Santoso, E. Powers, R. Bengtson, and A. Ouroua, “Time-Series analysis of nonstationary plasma fluctuations using wavelet transforms,” Rev Sci Instrum ,vol. 68, pp. 898–901, 1997.
[14] V. Milligen, E. Sanchez, T. Estrada, C. Hidalgo, B. Branas, and B. Carreras, “Wavelet bicoherence: A new turbulence analysis tool,” Phys Plasmas, vol. 2, pp. 3017–3032, 1995.
[15] . Gu ler and E. Derya, “Adaptive neuro-fuzzy Inference system for classification of EEG signals using wavelet coefficients,”
Neuroscience Methods, vol. 148, pp. 113–121, 2005.
[16] F. Lotte, M. Congedo, A. Lecuyer, F. Lamarche, and B. Arnaldi, “A review of classificaction algorithm for EEG-based brain-computer intrfaces,” Journal of Neural Engineering,7002.
[17] F. lotte, M. Congedo, A. Lecuyer, F. Lamarche, and B. Arnaldi, “A review of classification algorithm for EEG based brain computer interfaces,” Journal of Neural Engineering, vol. 4, 2007.
[18] T. Joachims, “Estimating the generalization performance of a SVM efficiently,” in Proc. the International Conference on Machine Learning (ICML), Morgan Kaufman, 2000.
[19] B. Obermaier, C. Guger, C. Neuper, and G. Pfurtscheller, “Hidden markov models for online classifction of single trial EEG,” Pattern Recognition Letters, vol. 22, pp. 1309-1299, 2001.
[20] W. Xu, Z. Huang, and C. Guan, Kernel Based Hidden Markov Model with Application to EEG Signal Classification, 7002.
[21] S. Solhjoo, A. M. Nasrabadi, and M. R. H. Golpayegani, “EEG-based mental task classification in hypnotized and normal subject,” in Proc. 72th Annual International Conference of the IEEE-EMBS, Shanghai, China, 2005.
[22] S. Solhjoo, A. M. Nasrabadi, and M. R. H. Golpayegani, “Classification of chaotic signals using hmm classifiers: EEG-based mental task classification,” in Proc. the European Signal Processing Conference, Antalya, 2005
[23] J. Dolezal, J. Stastny, and P. Sovka, "Recognition of direction of finger movement from EEG signal using markov model,” in Proc. 3rd European Medical and Biological Engineering, Prague, Czech Republic, 2005.
[24] F. Guler and E. D. Ubeyli, “Multiclass support vector machines for EEG-signals classification,” in Proc. IEEE transaction on information technology in biomedicine, 2007, vol. 11.
Maryam Vatankhah is a PhD student in computer
science at Stevens Institute of Technology, New Jersey, USA in 2013.