188
International Journal of Pharmaceutical Sciences and Drug Research
2015; 7(2): 188-192
Research Article
CODEN (USA): IJPSPP
ISSN: 0975-248X
Analytical Method Development and Validation of Olanzapine by High
Performance Liquid Chromatography
Ayyagari Rama Murthy
1*, K. Raghu Babu
1, N. A. Vekariya
21Andhra University College of Engineering, Visakhapatnam -530003, Andhra Pradesh, India
2Aurobindo Pharma Ltd, Hyderabad, Telangana, India
ABSTRACT
Objective of the study was to develop and validate a new rapid, sensitive, reverse phase High Performance Liquid Chromatography technique for the estimation of Olanzapine in bulk and dosage form. Chromatographic separation was achieved on a BDS Hypersil C18, (150 mm × 4.6 mm, 5μm) with a mobile phase of 0.01M Tetra
butyl ammonium hydrogen sulphate: Methanol (60:40) v/v. The flow rate was 1.0 ml/min, temperature of the column was maintained at ambient and detection was made at 228 nm. The run time was as short as 10.0 min. The developed method was validated according to the International Conference on Harmonization (ICH) guidelines with respect to linearity, accuracy, precision, specificity and robustness. The developed method was linear for Olanzapine from 10 - 80μg/ml and the linear regression obtained was 0.9994. Recovery of Olanzapine was found to be in the range of 99.6 -101.7%. Precision, evaluated by intra- and inter-day assays had relative standard deviation (R.S.D) values within 1.0 %. The ruggedness of the method was validated by performing the analysis by two different analysts and no significant difference in the result was found. Robustness of the method was checked by varying flow rate by 0.2 ml/min and the result was not affected significantly. The analysis of the marketed sample indicated that the method can also be applied to dosage form successfully. The method is precise, accurate, linear, robust and fast. The retention time and run time was very short; hence it is cost effective, making it more economical and rapid. Hence, this method can be used for the analysis of large number of samples.
Keywords: Olanzapine, HPLC, Validation, bulk, Pharmaceutical dosage form.
INTRODUCTION
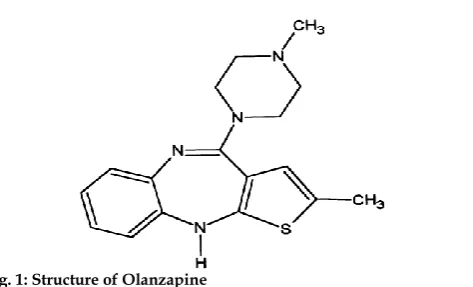
Olanzapine (2-methyl-4-(4-methyl-1-piperazinyl)-10H-thieno-[2,3b][1,5]benzodiazepine) (Fig. 1) is an atypical antipsychotic the U.S. Food and Drug Administration (FDA) for the treatment of schizophrenia and bipolar disorder. Olanzapine is structurally similar to clozapine, but is classified as athienobenzodiazepine.
*Corresponding author: Mrs. Ayyagari Ramamurthy,
Flat No. C 401, Gala Aria, South Bopal, Ahmedabad-380058, Gujarat, India;
E-mail: [email protected]
Received: 22 January, 2015; Accepted: 26 February, 2015
Fig. 1: Structure of Olanzapine
Int. J. Pharm. Sci. Drug Res. March-April, 2015, Vol 7, Issue 2 (188-192)
Company; the drug went generic in 2011. Sales of Zyprexa in 2008 were $2.2B in the US alone, and $4.7B in total. Pharmacological research has demonstrated that Olanzapine has nanomolar receptor affinity for dopamine D1 –D5, serotonin 5HT, 2A / 2B/ 2C, 5HT3 and 5HT6 receptors. In addition Olanzapine is a potent antagonist of α1-adrenergic and histamine H1 receptors 1, 2, 3. It is important to note that the atypical antipsychotics offer many clinical benefits in the treatment of schizophrenia compared to traditional antipsychotics such as phenothiazines and butyrophenones, also called ‘classical neuroleptic agents” and have emerged as first line therapy for schizophrenia. [1]
Since its introduction in a therapy of psychiatric disorders in 1997, the need for reliable, sensitive and fast methods for its analysis in bulk samples and pharmaceutical preparations is obvious. [2] Several
methods have been already reported for the determination of olanzapine, including hyphenated techniques: spectrophotometric [3-7], HPLC-MS [8-9],
HPLC [10], Capillary zone electrophoresis [10] and
GC-MS. [11] HPLC methods are preferred most because of
its accuracy, precision and relative less cost.
The author in the present study reports a simple, precise, accurate and economic HPLC analytical method suitable for bulk and dosage form analysis. The developed method was validated as per ICH guidelines and suitable statistical tests were performed on validation data.
MATERIALS AND METHODS Instrument
The specifications of HPLC instrument used are as follows. A gradient high pressure liquid chromatograph (Shimadzu, class LC-Series), system controller SCL 10AVP, with LC-10 AT pump and a Hypersil C18 Column (150 mm × 4.6 mm i.d., particle
size 5μm) was used. The HPLC system was equipped with the Shimadzu class VP-5.0 software. UV/Vis spectrophotometer (Shimadzu), sonicator (Lab companion), Balance (Mettler Toledo) and pH meter (Lab India) were used in the research.
Chemicals and reagents
All the chemicals used were either of A.R. grade or HPLC grade. Acetonitrile (RANKEM, HPLC Grade), Methanol (RANKEM, HPLC Grade), Sodium acetate RANKEM, HPLC Grade), Tri-Fluro Acetic acid (MERCK, AR Grade), Tetra butyl ammonium hydrogen sulphate (SD Fine, AR Grade) and Water (Mili Q) were used in the research work. Olanzapine was obtained as a gift sample from Chandra Lab., Hyderabad, India. Marketed product Olanzapine Tablet 5 mg of brand name Oliza-5 manufactured by Intas Pharma, India was purchased from local market.
Determination of wavelength
Olanzapine was dissolved in methanol to prepare drug solution of 10 ppm. The λmax of Olanzapine using this
solution was determined on UV–visible
spectrophotometer in the range 200-400 nm. The λmax
value for Olanzapine was found to be 228 nm.
Selection of Mobile Phase
The standard solution of Olanzapine was run and combination of solvents have been tried to get a symmetric and stable peak. Each mobile phase was filtered through 0.45μ membrane filter. From the various mobile phase tried as per literature [12], mobile
phase containing 0.01M Tetra butyl ammonium hydrogen sulphate: Methanol (60:40) %v/v was selected, since it gave sharp peak with symmetry within limits and significant retention time.
Preparation of Mobile Phase
Preparation of 0.01M Tetra butyl ammonium hydrogen sulphate
Dissolve 0.33954 g of Tetra butyl ammonium hydrogen sulphate in small amount of distilled water transferred in to 100 ml volumetric flask and make up to final volume with water.
Preparation of mobile phase
600 mL of the 0.01M Tetra butyl ammonium hydrogen sulphate was mixed with 400 mL of methanol. The solution was degassed in an ultrasonic water bath for 5 minutes and filtered through 0.45μ filter under vacuum.
Standard solutions
Weighed 25 mg Olanzapine and transferred it into 25 ml volumetric flask add sufficient amount of mobile phase and sonicated to dissolve, made up the volume with mobile phase. Pipette out 0.5 ml of resulting solution and transfer it into 10 ml volumetric flask and made up the volume with mobile phase.
Sample solution For Bulk
Taken 5 mg of Olanzapine into a 10 ml volumetric flask. Added about 7 ml of mobile phase and sonicated to dissolve it completely and made volume up to the mark with mobile phase. Mixed well and filtered through Whatmann filter paper (No.41). Further pipetted out 1 ml of the above stock solution into a 10 ml volumetric flask and diluted up to the mark with the same solvent. Mixed well and filtered through Whatmann filter paper (No.41).
For Tablet
Weighed 5 Olanzapine Tablets and calculate the average weight. Accurately weighed and transferred the sample equivalent to 5 mg of Olanzapine into a 10 ml volumetric flask. Added about 7 ml of mobile phase and sonicated to dissolve it completely and made volume up to the mark with mobile phase. Mixed well and filtered through Whatmann filter paper (No.41). Further pipetted out 1 ml of the above stock solution into a 10 ml volumetric flask and diluted up to the mark with the same solvent. Mixed well and filtered through Whatmann filter paper (No.41).
Chromatographic Conditions
Int. J. Pharm. Sci. Drug Res. March-April, 2015, Vol 7, Issue 2 (188-192)
0.45μm-membrane filter and sonicated for 15 min. The flow rate of the mobile phase was maintained at 1.0 ml/min. The column temperature was set at 25±1°C and the detection was carried out by UV-Detector wavelength at 228 nm. The run time was set at 10 min and the volume of the injection loop was 10μL. Prior to injection of the drug solution, the column was equilibrated for at least 30 min with the mobile phase flowing through the system. The data were acquired, stored and analyzed with the software class N-2000 CHROMTECK (SHIMADZU).
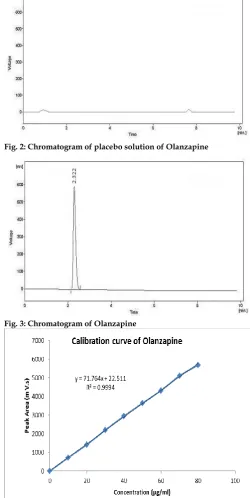
The chromatogram obtained through the injection of the placebo solution did not contain any other peak at the retention time of Olanzapine. The chromatogram peak purity tools show that the peak was 100% pure. Thus, it was shown that the peak at 2.32 min was not due to any interference from the excipients in the formulation.
The Liquid Chromatographic method was validated for the following parameters
Calibration Procedure
The calibration curve was plotted with five concentrations of the standard drug solution 10.0-80.0ppm and chromatography was repeated five times for each dilution. The linearity was evaluated by linear regression analysis. Before injecting solutions, the column was equilibrated for at least 30 min with the mobile phase flowing through the system. Five determinations were carried out for each solution, peak areas were recorded for all the solutions. The correlation graph was constructed by plotting the peak areas obtained at the optimum wavelength of detection versus the injected amounts of the respective concentrations.
Linearity and range
By using the working standard, aliquots of 10.0, 20.0, 30.0, 40.0, 50.0, 60.0, 70.0 and 80.0 ppm were prepared. Five dilutions of each of the above mentioned concentrations were prepared separately and from these five dilutions, 10μl of each concentration of the drug were injected into the HPLC system and their chromatograms were recorded. Peak areas were recorded for all the peaks and a standard calibration curve of peak area against concentration was plotted.
Precision
The precision of the assay was determined in terms of intra and inter-day variation in the peak area for a set of drug solution of known concentration of 80%, 100% and 120% (40 ppm, 50 ppm and 60 ppm respectively) assayed five times on the same day and on three different days.
The intra and inter day variation in the peak ratio of the drug solution was calculated in terms of co-efficient of variation (CV) and obtained by multiplying the ratio of standard deviation to the mean with 100(CV=SD/MEAN × 100).
Robustness
As defined by the ICH, the robustness of an analytical procedure describes to its capability to remain
unaffected by small and deliberate variations in method parameters. Robustness was performed by small variation in the chromatographic conditions and found to be unaffected by small variations like ±0.2 ml/min in flow rate of mobile phase.
Ruggedness
Ruggedness of the method was determined by analyzing 50µg/ml samples for Olanzapine in two different analysts. The results of the two different HPLC systems are compared and discussed in the Result and Discussion section below.
Fig. 2: Chromatogram of placebo solution of Olanzapine
Fig. 3: Chromatogram of Olanzapine
Fig. 4: Calibration curve of Olanzapine
RESULTS AND DISCUSSION
Int. J. Pharm. Sci. Drug Res. March-April, 2015, Vol 7, Issue 2 (188-192)
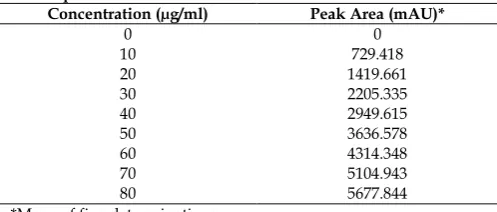
retention times were found to be approximately same. The averages of 5 such determinations of peak areas are shown in Table 1. When the concentrations of Olanzapine and its respective peak areas were subjected to regression analysis by least squares method, a good linear relationship (r2 = 0.9994) was
observed between the concentration of Olanzapine and the respective peak areas in the range 10.0-80.0μg/ml. The regression of Olanzapine was found to be Y= 71.764x+22.511, where ‘Y’ is the peak area and ‘X’ is the concentration of Olanzapine (Table 2).
Table 1: Calibration of RP-HPLC Method for Determination of Olanzapine
Concentration (µg/ml) Peak Area (mAU)*
0 0
10 729.418
20 1419.661
30 2205.335
40 2949.615
50 3636.578
60 4314.348
70 5104.943
80 5677.844
*Mean of five determinations
Table 2: Results of the data analysis for the quantitative determination of Olanzapine
Statistical parameters RP-HPLC Concentration range, μg/ml 10.0-80.0
Regression equation Y= 71.764x+22.511 Correlation co-efficient (r2) 0.9994
Limit of detection (LOD), μg/ml 0.402 Limit of quantification (LOQ), μg/ml 1.186
Table 3: Intra and Inter-Day Precision for Olanzapine
Concentration of Olanzapine
(μg/ml)
Observed concentration (μg/ml) of Olanzapine Found
Intra-Day Inter-Day Mean (n=5) RSD (%) Mean (n=5) RSD (%)
40 40.37 0.62 40.57 0.62
50 50.43 0.41 50.53 0.50
60 60.33 0.53 60.60 0.33
Table 4: Accuracy of Olanzapine
Sample Percentage (%) recovery Mean
S1-80% 100.5
100.9
S2-80% 101.7
S3-80% 100.6
S1-100% 99.6
100.5
S2-100% 100.7
S3-100% 101.3
S1-120% 101.1
100.4
S2-120% 99.7
S3-120% 100.3
Table 5: Robustness Results for variations in Flow Rate (ml/min) Flow rate Retention time (min) Tailing factor
0.8 2.28 0.868
1.0 2.32 0.895
1.2 2.45 0.953
Table 6: Assay of Olanzapine
Formulation Label claim (mg) Concentration found (%)
Oliza-5 5 5 99.8 98.7
5 101.2
*Average of three determinations
Table 7: System Suitability Parameters
S. No. Parameters Obtained Values
1 Theoretical plates (N) 2689
2 Tailing factor (T) 0.895
Table 8: Ruggedness of method
Retention time Peak Area
Analyst - 1 2.32 min 2949.615
Analyst - 2 2.38 min 3008.487
The proposed HPLC method was validated for intra and inter-day variation. When the solution containing 40, 50 and 60μg/ml of Olanzapine were repeatedly injected on the same day, the RSD (relative standard deviation) in the peak area for five replicate injections was found to be less than 1.0 %. Also the inter day variation (3 days and five injections) was found to be less than 1.0% (Table 3).
Known amounts of the drug solution (40, 50 and 60μg/ml) were subjected to the estimation of the drug for the recovery studies. There was a high recovery of Olanzapine (100.9%, 100.5%, and 100.4%) indicating that the proposed procedure for the determination of Olanzapine is highly accurate (Table 4).
The method was found to be robust as little change in the flow rate did not found to affect the result (Table 5). Assay of marketed sample also shows that there was a high recovery of Olanzapine (98.7% to 101.2%) and the result is within the specification limit (Table 6).
Number of the theoretical plates was found to be more than 2000 and the tailing factor was found to be less than 2.0 (Table 7). Hence the developed method meets the criteria of system suitability.
The developed method was found to be rugged as when the method was performed by two different analysts, there was no significant difference in the result.
In the present investigation, we have developed a simple, sensitive, precise and accurate HPLC method for the quantitative estimation of Olanzapine. The results showed that the proposed method is highly reproducible. The RP-HPLC method developed in the present study can also be used to quantify Olanzapine in tablet formulations.
REFERENCES
1. Pradhan KK, Kumari S, Samanta R. Development and validation of a stability indicating UV spectroscopic method for olanzapine in bulk and pharmaceutical dosage forms. Int. J. Pharm Pharm Sci. 2014; 6(4): 67-72.
2. Prameela RA, Bala SC. Development of HPLC Method for the Determination of Olanzapine in Bulk and Dosage Forms. Int. J. Pharm Tech Res. 2009; 1(3): 654-657.
3. Anna K, Barbara S, Helena P-T, Joanna Ï. Spectrophotometric Determination of Olanzapine by Its Oxidation with N-Bromosuccinimide and Cerium (IV) sulfate. Anal. Sc. 2006; 22(6): 829-833.
4. Firdous S, Aman T, Nisa AU. Determination of Olanzapine by UV Spectrophotometry and Non-aqueous Titration. Chem. Soc. Pak. 2005; 27(2): 163-67.
Int. J. Pharm. Sci. Drug Res. March-April, 2015, Vol 7, Issue 2 (188-192)
of Olanzapine in Pharmaceutical Preparations, Asian J. Chem. 2003; 15: 1127-1130.
6. Gowri Sankar D, Rajendra Kumar JM, Latha, PVM. Spectrophotometric Estimation of Sisomicin and Olanzapine. Asian J. Chem. 2005; 17: 1331-1133.
7. Rubesh kumar S, Gayathri P , Duganath N , Kiran CH, Sridhar C, Jayaveera KN. Simultaneous Estimation of Fluoxetine HCl and Olanzapine in Bulk Drug and Pharmaceutical Formulation by Using UV-Visible Spectroscopy Method. Int. J. Pharm. Sci. Drug Res. 2011; 3(1): 52-55.
8. Zhou Z, Li X, Lin K, Xie Z, Cheng Z, Peng W, Wang F, Zhu R, Li H. Simultaneous Determination of Clozapine, Olanzapine, Risperidone and Ruetiapine in plasma by high performance liquid chromatography–electrospray ionization mass spectrometry. J. Chrom. B. 2004; 802(2): 257-62.
9. Bogusz MJ, Kruger KD, Maier RD, Erkwoh R, Tuchtenhagen F. Monitoring of Olanzapine In Serum By Liquid Chromatography–Atmospheric Pressure Chemical Ionization Mass Spectrometry. J. Chrom. B. 1999; 732(2); 257-69. 10. Raggi MA, Casamenti G, Mandrioli R, Izzo G, Kenndler E.
Quantitation of Olanzapine In Tablets By HPLC, CZE, Derivative Spectrometry And Linear Voltammetry. J. Pharm. Biomed. Anal. 2000; 23(6): 973-981.
11. Elian AA. Fatal Overdose of Olanzapine. Forensic Sci. Inter. 1998; 91(3): 231-235.
12. Murali Krishna NV, Analytical Method Development and Validation of Olanzapine in Pure and Pharmaceutical Dosage Form by Using RP-HPLC Method. M. Pharm. Thesis, KLE University, Belgaum, Karnataka, 2012.