ISSN (Online) 2249-6084 (Print) 2250-1029
International Journal of Pharmaceutical and
Phytopharmacological Research (eIJPPR)
[Impact Factor – 0.852]
Journal Homepage: www.eijppr.com
Research Article
UV Spectrophotometric and HPLC Method Development of Quercetin and
Curcumin in Polyherbal Churna and It’s Validation
Vijay R Salunkhe
*, Snehal J Patil
Rajarambapu College of Pharmacy, Kasegaon. Tal.Walwa, Dist Sangli-415404, M.S. India.
Article info
Article History:
Received 25 February 2014 Accepted 6 August 2014
Keywords:
Madhujeevan churna,
Curcumin, Quercetin, RP-HPLC
Abstract
A simple, rapid, sensitive, precise, economic and reproducible RP-HPLC method for the quantitative determination of curcumin and quercetin in Madhujeevan churna(MJC) was developed and validated. The hydroalcoholic extract of churna was obtained by continuous heat extraction method. The extract was considered as sample. Standard curcumin was analyzed using Agilent LC-P-1120 with a HiQ Sil C-18 column by isocratic elution using methanol: acetonitrile: phosphate buffer (pH 5) in the ratio of 42.5 : 42.5: 15 % v/v/v as the mobile phase. The flow rate was 1.2 ml/ min and detection was set at 265 nm as isobestic point.. The method was validated using parameters as linearity, precision, limit of detection, limit of quantification, and recovery as per ICH guidelines. It obeys Beers- Lamberts law in concentration ranges employed for evaluation. The recovery of the method was in the range of 98.50-99.40 % and all the compounds showed good linearity (r = 0.98332) in a relatively wide concentration range. The concentration of quercetin and curcumin present in raw material of madhujeevan churna was found to be 0.1347%w/w and 0.208%w/w respectively in Madhujeevan
churna(MJC). The result of analysis has been validated statistically and recovery studies confirmed the
accuracy of the proposed method. Hence, the proposed method can be used for the reliable quantification of active marker compound in crude drug and its herbal formulations.
1. INTRODUCTION
The world health organization (WHO) has emphasized the need to ensure the quality of medicinal plant products by using modern controlled technique and applying suitable standards1
. The collection, identification of crude drug, preparation and evaluation of herbal medicine is challenging era. Drugs made by them were more efficacious, authentic and genuine. In the present age the suppliers make the collection. There are so many drugs, which lost their effectiveness with the passage of time. This causes the lowering the genuine character of the drug and make less efficacious. Until and unless, a method is not being developed to check the adulteration, it is too difficult to achieve the prestigious stage of herbal medicine. The checking of herbal drugs used in the preparation can be checked scientifically through certain well- established norms and standards through the research works.2
For standardization of natural products, crude drugs, single chemical entities, “marker compounds”, may be used as potency standards in U.V and HPLC analysis.3
Madhujeevan churnam(MJC) consist of seven ingredients as Curcuma longa, Aegle marmelos, Azardichata indica, Emblica officinalis Salacia reticulate, Syzygium jambulanum and Stevia rebaudiana. Curcumin is chemically, (1E, 6E)-1, 7-bis (4-hydroxy-3- methoxy phenyl) -1, 6-heptadiene-3,5-dione. It is the principal curcuminoid of the popular Indian spice turmeric, which is a member of the ginger family (Zingiberaceae).. Curcumin have been reported for many activities. Quercetin is chemically, 2-(3,4- dihydroxy phenyl)-3,5,7-trihydroxy-4H-chromen-4-on quercetin , a flavonol, is a plant-derived flavonoid found in fruits, vegetables, leaves and grains. Quercetin has been used to treat many diseases.
Literature survey reveals that several methods as U.V.4, -6, HPLC7, 8,
*Corresponding Author:
Vijay R Salunkhe
Rajarambapu College of Pharmacy, Kasegaon. Tal.Walwa, Dist Sangli-415404, M.S. India.
Email: [email protected]
TLC9, 10
, and electrochemical determination of quercetin11 ; have been reported for estimation of curcumin and quercetin separately. Spectrofl1urometric estimation like U.V13-19 ,
HPLC14-16,20,21 and HPTLC17-19, 22-29
have been reported for estimation of curcumin. No simple and accurate RP-HPLC method has been reported for simultaneous estimation and qualitative examination of curcumin and quercetin. Not a single U.V., HPLC or HPTLC method is reported so far for simultaneous analysis of curcumin and quercetin in herbal dosage form.
2. MATERIALS AND METHODS
2.1 Reagents and Materials
Ayurvedic Proprietary –MJC was procured as Gift sample from Dr. Wachasundar, Aniket Clinic, Magalwarpeth, karad. Dist- satara (Maharashtra).
All the chemicals and solvents were used of A. R. grade; standard. Curcumin and Quercetin was procured as gift sample from SDFCL, S.D. fine-chemicals limited, Mumbai.
Instrument used was an UV/Visible double beam spectrophotometer, SHIMADZU model 1800 (Japan) with spectral width of 2 nm, wavelength accuracy of 0.5 nm and a pair of 10 mm matched quartz cell was used to measure absorbance of all the solutions. An electronic analytical balance was used for weighing the sample.
2.2 Preparations of extract of madhujeevan churna (MJC)
The 300g of Madhujeevan churna (MJC) was extracted with a mixture of 95% ethanol and water (75:25) at 50-600C in a Soxhlet apparatus separately20, 30-37
2.3 Preparation of standard stock solution of curcumin and quercetin
Further series of dilution were made with ethanol. The stock solution (100μg/ml) of Quercetin and curcumin were prepared by dissolving accurately about 10mg of each drug in sufficient quantity of mobile phase and then volume was adjusted to 100ml with mobile phase, further series of dilution are made with mobile phase.
2.4 Sample preparation
The hydroalcoholic extract was dissolved in 50 % methanol in a volumetric flask.
2.5 Buffer and mobile phase preparation
2.5.1 Buffer preparation
10 mM phosphate buffer was prepared by adding 1.360 gm potassium dihydrogen phosphate in 1000 ml double distilled water. The solution was filtered through 0.45µm filter and sonicated for 15 min.
2.5.2 Preparation of mobile phase
Mobile phase was prepared by mixing methanol: Acetonitrile : phosphate buffer in the ratio of 42.5 : 42.5: 15 % v/v/v. pH of mobile phase was adjusted to 5 with othophosphoric acid.
2.5.3 Degassing of the mobile phase
The prepared mobile phase was degassed by ultrasonication for 20 min, so as to avoid the disturbances caused by dissolved gases.
2.5.4 Filtration of mobile phase
The degassed mobile phase was filtered through 0.45µ filter to avoid the column clogging due to smaller particles
2.6 Calibration curves
Marker compounds, curcumin and quercetin were accurately weighed and dissolved in 50 % methanol to give serial concentrations within the range of 0.5-50 μg mL-1. The calibration curves were obtained from peak areas of the standard solutions over the concentrations. The content of the markers were determined using a calibration curve established with six dilutions of each standard, at concentrations ranging from 10 to 100 µg/ml. Each concentration was measured in triplicate. The corresponding peak areas were plotted against the concentration of the markers injected. Peak identification was achieved by comparison of both the retention time (Rt) and UV absorption spectrum for standards.
2.7 Chromatographic conditions
Analyses were carried out using an Agilent LC-P-1120 equipped with pump, degasser, photo diode array (PDA) detector and auto- sampler. The generated analytical signals were monitored and integrated using E Z chrome Elite.The chromatographic separation was performed using C18 Intersil, 4.6 (i.d.) x 250 mm at a column oven temperatures of 35°C. The method development for simultaneous estimation of curcumin and quercetin was performed using (a) various solvent [i.e. acetonitrile and methanol]; (b) various buffer-solvent ratio [i.e. solvent A (0.1%v/v ortho phosphoric acid aqueous solution) and solvent B (acetonitrile) at the ratio of 40:60, 50:50, 60:40 and 70:30]. 0.1%v/v ortho phosphoric acid aqueous solution was prepared by adding 1mL of ortho phosphoric acid in 1000 mL beaker and about 900 mL of Milli-Q water was added, which was sonicated for 5 minutes and volume was made up to 1000 mL to get 0.1%v/v ortho phosphoric acid and the pH was adjusted to 3.0 by triethylamine; The final mobile phase optimized was methanol: acetonitrile: phosphate buffer (pH 5) in the ratio of 42.5 : 42.5: 15 % v/v/v(c) at various flow rate [i.e. 0.8, 1.0 and 1.2 mLmin-1]; and (e) various elution mode [i.e. isocratic and gradient]. The developed method was validated for system suitability, accuracy, precision, limit of detection (LOD), limit of quntification (LOQ), linearity, range and robustness in accordance with ICH guideline.
Linearity was evaluated at five concentration levels in the range between 10-150 μgmL-1 for curcumin and quercetin The concentration was then plotted against its corresponding peak area and the linearity was determined using least square regression analysis. System suitability parameters were studied to verify the system performance. Six replicate quality control (QC) samples containing curcumin (100μgmL-1) and quercetin (100μgmL-1) were
analysed using the developed method. The accuracy of the developed method was established using recovery studies. Three replicate QC samples containing known amount of curcumin and quercetin at 50, 100 and 150μgmL-1 were spiked into pre-analysed samples (100μgmL-1 of curcumin and 100μgmL-1 of quercetin), which were analyzed using the developed method and the percentage recovery was taken in to consideration for testing accuracy. Precision of the developed method was studied using six replicate QC samples containing curcumin (100μgmL-1) and quercetin (100μgmL-1), which were analyzed using the developed method within a short period of time on the same day and repeatability was taken in to consideration for testing precision. LOD and LOQ of curcumin and quercetin in the developed method were studied using the signal-to-noise ratio; calibtration curve was taken into account. The LOD and LOQ were separately determined which is based on calibration curve. The S.D. of y intercept of regression line may be used as S.D.
Where, σ = Standard deviation of y intercept of regression lines, S = Slope of calibration curve.
Robustness was performed with known concentration of curcumin
(100μgmL-1) and quercetin (100μgmL-1) using the developed
method with negligible but deliberate change in the buffer-solvent ratio, flow rate, column temperature and significant change in the retention time, peak area, and tailing factor were taken in to consideration for testing robustness .
The quantity of Quercetin and Curcumin were determined by following formula,
CSTD / CSAMPLE = AUCSTD / AUCSAMPLE
3. RESULTS AND DISCUSSION
3.1 Optimization of separation conditions
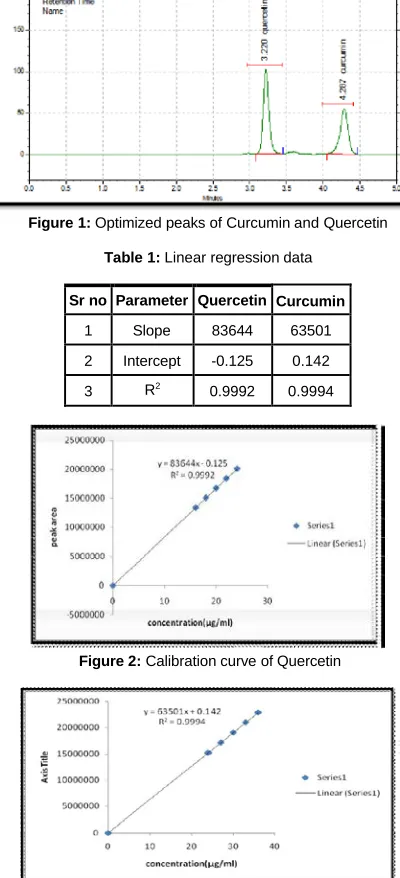
Absorption maxima of curcumin and quercetin was observed to be in the range of 200-400 nm on the UV spectra with dimensional chromatograms and a monitoring wavelength for quantitative determination at 265 nm and 256 respectively.It was altered to obtain the baseline separation of marker compound. Isocratic elution was carried out to successfully separate the compounds in hydroalcoholic extract of Madhujeevan Churna using methanol: acetonitrile: phosphate buffer (pH 5) in the ratio of 42.5 : 42.5: 15 % v/v/v as the mobile phase. The flow rate was 1.2 mL min-1 and detection was set at 265 nm. There were no interfered peaks within the time frame in which curcumin and quercetin in the extract were detected. It is shown in Figure 1.
3.2 Linearity and range of the developed method
The analytical range was established by the highest and lowest concentrations of analyte where acceptable linearity was obtained. The correlation coefficient (R2) of curcumin and quercetin were around 0.999, which confirms its linearity in range of 10-150 μgmL- 1. The results of linearity are summarized in table 1.
3.3 Regression equation
Linear regression analysis for curcumin was performed by the external standard method. The calculated results were given in table-1, where a, b and r were the coefficients of the regression equation Y = ax + b, x referred to the concentration of the marker compound (μg mL-1), Y the peak area and r the correlation coefficient of the equation. The marker substance showed good linearity (r = 0.98332) in a relatively wide concentration range. The limits of detection (LOD) for curcumin and quercetin were 18.35 ng mL-1, detected at 265 nm.
3.4 System suitability of the developed method
quercetin were less than 2, which ensures the suitability of the developed method. The results of system suitability study are summarized in table 2 and 3.
3.5 Accuracy of the developed method
The percentage recovery of the spiked curcumin and quercetin were well within 100±2% and %RSD of assay was less than 2%, which ensures the accuracy of the developed method. The results of recovery studies are summarized in table 4.
3.6 Precision of the developed method
The developed method has shown <1.3 %RSD of peak area, tailing factor, retention time and assay, which ensures precision of the developed method. The results of precision study are summarized in table 5.
3.7 Limit of detection and limit of quntification of the developed method
LOD and LOQ of curcumin and quercetin in the developed method were studied using the signal-to-noise ratio of 3 for estimating LOD and 10 for estimating LOQ. The LOD were 0.3 ppm for curcumin and 0.9 ppm for quercetin at a signal-to-noise ratio of 3. LOQ were 0.4 ppm for curcumin and 1.1 ppm for quercetin at a signal-to-noise ratio of 10.
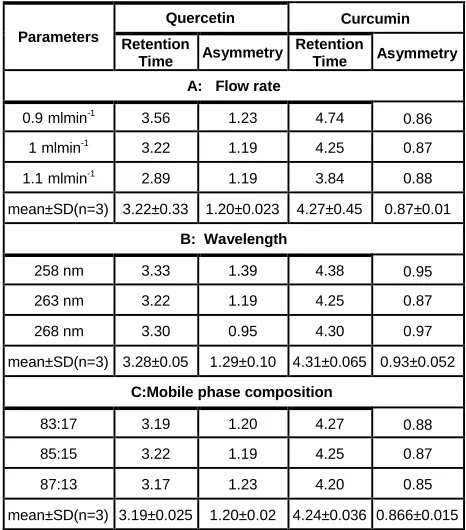
3.8 Robustness of the developed method
The robustness of a method is a measure of its ability to remain unaffected by negligible but deliberate change to the chromatographic condition.. The results of precision study are summarized in table 6.
4. DISCUSSION
The optimum chromatographic condition with adequate resolution for curcumin and quercetin was achieved when the separation was carried using C18 column (Reversed Phase, 150 mm x 4.6 mm with 5 micron particle size, Phenomenex Luna) at a column oven temperature of 35°C with an isocratic elution mode of mobile phase composed of a degassed mixture of isocratic elution using methanol: acetonitrile: phosphate buffer (pH 5) in the ratio of 42.5 : 42.5: 15 % v/v/v as the mobile phase. at 1.0 mLmin-1 flow rate with a total run time of 15 minutes.
The developed HPLC method for quercetin, curcumin and simultaneous estimation of quercetin and curcumin is simple, accurate, precise and robust. This method includes use of C18 Intersil, 4.6 (i.d.) x 250 mm columns, mobile phase consist of mixture of methanol, acetonitrile: phosphate buffer (pH 5) in the ratio of 85: 15 % v/v at flow rate 1ml min-1
. PH of mobile phase was adjusted with OPA. Retention time was found to be 3.220, 4.287 for quercetin and curcumin respectively. Theoretical plates were found to be 8210, 7955 for quercetin and curcumin respectively. It is must to observe pattern of UV absorbance with prior to HPLC method development for markers. After obtaining the overlaid spectra for markers, 263nm wavelength was selected for further HPLC analysis.
Mobile phase selection21
is very important for separating two drugs appropriately. While selecting the mobile phase it was observed that mixture of water-methanol gives sharp peak of quercetin with acceptable system suitability parameter but affect the elution of curcumin. By increasing concentration of water in above mixture affect the elution of curcumin and it takes more time for elution. Hence acetonitrile in mixture of water and methanol is suitable for their separation. Keeping this in mind several mobile phases were tried and methanol, acetonitrile: phosphate buffer in the ratio of 85: 15 % v/v was finalized; PH
of mobile phase was adjusted to 5 with o-phosphoric acid. This mobile phase gives resolved peaks with symmetry within limits and significant retention time. System suitability parameters were studied in order to determine the suitability of chromatographic system for analysis to be done. The calibration plot quercetin and curcumin follow Beer-Lambert’s law. The correlation coefficient, intercept and slope were 0.9992, - 0.125, 83644 and 0.994, 0.142, 63501 for quercetin and curcumin respectively. The good correlation coefficient indicates22
the method is linear over the concentration range. The low values of % R.S.D. (< 2%) for intra and inter day’s variation, which suggested an excellent precision of method. Results from recovery studies were within acceptable limits. 98.26-99.35% and 98.32-99.27% for quercetin and curcumin respectively indicating accuracy of method
was good. The limit of detection (LOD) and quntification (LOQ) were near about 0.26 µg/mL, 0.804 µg/mL for quercetin and 0.25
µg/mL, 0.78 µg/mL for curcumin, which indicates adequate sensitivity of method. Low values of SD and % RSD obtained after introducing small deliberate changes in the developed HPLC method indicated the robustness of method. The developed method was validated as per ICH guidelines.22
Quantitative estimation of quercetin and curcumin in MJC was also determined by standard formula, quercetin was found to be 0.132%w/w of churna while curcumin was found to be 0.25 %w/w of churna by UV spectroscopy. With the help of HPLC quantity of quercetin and curcumin was found to be 0.1347 %w/w, 0.208% w/w of churna . It is invented that the quantity of quercetin and curcumin determined by UV and HPLC is nearby similar hence same analytical techniques are most useful for quantification of target compound. It is concluded that herbal marker compounds can be analyzed by analytical technique as UV, HPLC .Qualitative and quantitative estimation of natural components can be done using this technique, which is part of quality assurance of herbal product.
Table 1: Linear regression data
Sr no Parameter Quercetin Curcumin
1 Slope 83644 63501
2 Intercept -0.125 0.142
3 R2
0.9992 0.9994
Figure 2: Calibration curve of Quercetin
Figure 1: Optimized peaks of Curcumin and Quercetin
Table 2: System suitability parameters for mixture
Name R.T.
(min) Theoretical Plate Asymmetry Resolution
Quercetin 3.220 8210 1.15953 0.00000
Curcumin 4.287 7955 0.87525 6.30883
Table 3: System Suitability Test
Sr. no.
Peak area R.T.(min) Therotical plate Asymmetry
Resolution
QUER CUR QUER CUR QUER CUR QUER CUR
1 8364441 6350153 3.22 4.287 8210 7955 1.159 0.875 6.308
2 8364439 6350099 3.213 4.283 8201 7950 1.172 0.878 6.337
3 8364399 6350140 3.2 4.287 8205 7956 1.179 0.876 6.329
4 8364396 6350155 3.207 4.29 8212 7953 1.189 0.867 6.318
5 8364389 6350090 3.21 4.285 8209 7958 1.177 0.88 6.307
Maen 8364412 6350127 3.21 4.2864 8207.4 7954.4 1.1752 0.8752 6.319
SD 25.1037 30.7457 0.0073 0.0026 4.3931 3.0495 0.010 0.0049 0.0131
%RSD 0.0003 0.0004 0.218 0.0607 0.0532 0.0383 0.9329 0.5678 0.2073
Table 4(A): Recovery for Curcumin Table 6: Robustness evaluation of method of QUER and CUR
Spiked Level (%) Mean*
%Amount Recovery SD %RSD
50 98.63 0.291 0.224
100 98.32 0.210 0.213
150 99.27 0.221 0.292
Table 4(B): Recovery for Quercetin
Spiked Level (%) Mean*%Amount Recovery SD %RSD
50 98.26 0.31 0.31
100 99.35 0.314 0.314
150 98.45 0.298 0.298
* Indicates three replicates
Table 5(B): Intra and intraday’s precision for Quercetin
Formulation
Intra-day precision (n=3 )
Inter-day’s precision (n= 3 )
SD of response
% RSD
SD of response
% RSD
Extract 46370.2 1.78 46499.5 1.43
Table 5(A): Intra and intraday’s precision for Curcumin 5. CONCLUSION
In present study, a simple, precise, and reproducible HPLC method has been developed for simultaneous estimation of curcumin and
quercetin. The developed method was successfully implemented in the estimation of curcumin and quercetin. This is the first report of identification and quantification of curcumin and quercetin in hydroalcoholic extract of Madhujeevan Churna. A simple, rapid and accurate assay approach was presented. The experimental results indicated that hydroalcoholic extract of Madhujeevan churna contain high concentration of curcumin. Thus developed method can be used for routine analysis of curcumin and quercetin in pharmaceutical dosage forms. Since the phenolic compounds have been of interest of health benefits, the present analytical study
Parameters
Quercetin Curcumin
Retention
Time Asymmetry
Retention
Time Asymmetry
A: Flow rate
0.9 mlmin-1
3.56 1.23 4.74 0.86
1 mlmin-1
3.22 1.19 4.25 0.87
1.1 mlmin-1
2.89 1.19 3.84 0.88
mean±SD(n=3) 3.22±0.33 1.20±0.023 4.27±0.45 0.87±0.01
B: Wavelength
258 nm 3.33 1.39 4.38 0.95
263 nm 3.22 1.19 4.25 0.87
268 nm 3.30 0.95 4.30 0.97
mean±SD(n=3) 3.28±0.05 1.29±0.10 4.31±0.065 0.93±0.052
C:Mobile phase composition
83:17 3.19 1.20 4.27 0.88
85:15 3.22 1.19 4.25 0.87
87:13 3.17 1.23 4.20 0.85
mean±SD(n=3) 3.19±0.025 1.20±0.02 4.24±0.036 0.866±0.015
Formulation
Intra-day precision (n=3)
Inter-day’s precision(n=3) SD of
response %
RSD SD of response % RSD
could be a potential application to identify and quantify the phenolic compound in other herbal dosage forms.
REFERENCES
1. World Health Organization, Quality Control Methods for Medical Plants Materials, Geneva, 1998; 1-15. [updated 1998; cited 2011 Jul 9]. Available from: http://apps.who.int/medicinedocs/en/d/Js2200e/.
2. Halim Eshrat M. Ali Hussain, Standardisation and evaluation of herbal drug formulation, Indian Journal of Clinical Biochemistry, 2002; 17(2):33-43.
3. Pharmacoepical standards for Ayurvedic Formulations, Central Council for Research in Ayurvedic and Siddha, New Delhi: Ministry of Health and Family Welfare; 1987, 112-23. 4. HNA Hassan, BN Barsoum, IHI Habib. Simultaneous
spectrophotometric determination of rutin, quercetin and ascorbic acid in drugs using a Kalman Filter approach, Journal of Pharmaceutical and Biomedical Analysis, 1999;20: 315-320. 5. Irena Baranowska, Dominika Raro´g, Application of derivative spectrophotometry to determination of flavonoid mixtures, Talanta, 2001; 55:209-212.
6. N Pejic, V Kuntic, Z Vujic, S Micic. Direct spectrophotometric determination of quercetin in the presence of ascorbic acid, IL FARMACO, 2004; 59 :21-24.
7. Philip C Morrice, Sharon G Wood, Garry G Duthie. High- performance liquid chromatographic determination of quercetin and isorhamnetin in rat tissues using b- glucuronidase and acid hydrolysis, Asian Journal of Traditional Medicines, Journal of Chromatography B, 2000;738:3-417. 8. R Aguilar-Sa´nchez, FA huatl-Garcıa, MM Da´vila- Jime´nez,
MP Elizalde-Gonz´alez, MRG Guevara-Villa, Chromatographic and electrochemical determination of quercetin and aempferol in phytopharmaceuticals, Mexico Journal of Chromatography B, 2003;794:49-56.
9. Guno sindhu chakrborty and Prashant M Ghorpade, Determination of Quercetine by HPTLC in "Calendula officinalis" Extract, International journal of Pharmaceutical and Biological science, 2010; 1 Suppl 1: 1-4.
10. Sachin U Rakesh, PR Patil, VR Salunke, PN Dhabale, KB Burade, HPTLC method for quantitative determination of quercetine in hydrochloric extract of dried flower of nymphaea stellata wild., International journal of chemtech research coden (U.S.A.), 2009; 1Suppl 4: 931-936.
11. Kazuo Ishiia, Takashi Furutab, Yasuji Kasuyab, High- performance liquid chromatographic determination of quercetin in human plasma and urine utilizing solid-phase extraction and ultraviolet detection, Japan Journal of Chromatography B, 2000;738:413-417
12. Nishant Kumar Gupta, Alok Nahata, Vinod Kumar Dixit. Development of a spectrofluorimetric method for the determination of curcumin, Journal of Pharmaceutical and Biomedical Analysis, 2008; 47:31-38.
13. Rubesh Kumar S, Ram kishan J, Venkateshwar Roa KN, Duganath N, R Kumanam. Simultaneous Spectrophotometric estimation of curcuminoid and gallic acid in bulk drug and ayurvedic polyherbal dosage forms, Journal of Chromatography B, 2003; 783 :287-295.
14. Dennis D Heatha, Milagros A Pruittb, Dean E Brennerc, Cheryl L Rockd. Curcumin in plasma and urine: quantitation by high- performance liquid chromatography, Journal of Chromatography B, 2003; 783:287-
15. Yvonne Pak, Renata Patek, Michael Mayersohn. Sensitive and rapid isocratic liquid chromatography method for the quantitation of curcumin in plasma, Journal of Chromatography, 2003;796: 339- 346.
16. Ravi Shankar Prasad Singh, Umashankar Das, Jonathan R. Dimmock, Jane Alcorn , A general HPLC-U.V. method for the quantitative determination of curcumin analogues. containing the 1,5-diaryl-3-oxo-1,4-pentadienyl pharmacophore in rat biomatrices, Journal of chromatography. B, Analytical technologies in the biomedical and life sciences, 2010; 8:34.
17. Jin Hwan Lee, Myoung-Gun Choung. Determination of curcuminoid colouring principles in commercial foods by HPLC, Food Chemistry, 2010; 124:1217-1224.
18. Jayant K Verma, Anil V Joshi. Rapid HPTLC method for identification and quantification of curcumin, piperine and thymol in an ayurvedic formulation, Journal of Planar hromatography - Modern TLC, 2006; 19:111.
.
19. Niraj vyas, Kanan Gamit, Mohammad Y Khan, Siddharth Panchal,Simultaneous estimation of curcumin and piperine in their crude powder mixture and ayurvedic formulation using high performance thin layer chromatography, International journal of research in pharmaceutical and biomedical science, 2011; 2 Suppl 1 :231-236.
20. Snyder LR. Practical HPLC method development, 2nd Edn, John Wiley and Sons, Inc, P 1-97, 161-168,653-660.
21. Sethi PD, Introduction – High Performance Liquid Chromatography, 2001, 1st Edn, CBS Publishers, New Delhi, P 1-28.
22. ICH Q2A, Q2A (R1).(1995) Validation Of Analytical Procedures: Text And Methodology. International Conference On Harmonization, Geneva.
23. Khademvatan K, Alinejad V, Eghtedar S, Rahbar N, Agakhani N. Survey of the relationship between metabolic syndrome and myocardial infarction in hospitals of Urmia University of medical sciences. Global journal of health science. 2014. 6(7), pp. 58-65. 24. Sobouti B, Fallah S, Ghavami Y, Moradi M. Serum
immunoglobulin levels in pediatric burn patients. Burns. 2013 May;39(3):473-6. doi: 10.1016/j.burns.2012.08.010. Epub 2012 Sep 20.
25. Mansouri E, Abedi HA, Damshenas MH, Jahromi HK. Antioxidant effects of hydro-alcoholic extract of Pomegranate (Punica granatum L.) on some of tissues. Biosciences Biotechnology Research Asia. Volume 11, Issue 2, 1 August 2014, Pages 441-447.
26. Heidari Gorji MA, Davanloo A, Heidarigorji AM. The efficacy of relaxation training on stress, anxiety, and pain perception in hemodialysis patients. 2014. ndian Journal of Nephrology. 24(6), pp. 356-361.
27. Abbasalizadeh S, Pharabar ZN, Abbasalizadeh F, Ghojazadeh M, Goldust M. Efficacy of betamethasone on the fetal motion and biophysical profile and amniotic fluid index in preterm fetuses. Pak J Biol Sci. 2013 Nov 15;16(22):1569-73.
28. Samadian M, Vahidi S, Khormaee F, Ashraf H. Isolated, Primary Spinal Epidural Hodgkin's Disease in a Child. Pediatric Neurology.2009, 40(6), pp. 480-482
29. Rahimi-Movaghar V, Saadat S, Vaccaro AR, Ghodsi SM, Samadian M, Sheykhmozaffari A, Safdari SM, Keshmirian B. The efficacy of surgical decompression before 24 hours versus 24 to 72 hours in patients with spinal cord injury from T1 to L1 - With specific consideration on ethics: A randomized controlled trial. Trials. 2009 Aug 24;10:77. doi: 10.1186/1745-6215-10-77. 30. Afkar A, Mehrabian F, Shams M, Najafi L. Assessment of the
preparedness level of administrators and State Hospitals of Guilan against Earthquake. Life Science Journal.2013. 10(SUPPL.2), pp. 60-66
31. Payandeh M, Raeisi D, Sohrabi N, Zare ME, Kansestani AN, Keshavarz N, Gholami S, Hashemian AH. Poor platelet count response to helicobacter pylori eradication in patients with severe idiopathic thrombocytopenic purpura. International Journal of Hematology-Oncology and Stem Cell Research. 2013. 7(3), pp. 9-13
32. Pashapour N, Macooei AA, Golmobammadlou S. Alternating ibuprofen and acetaminophen in the treatment of febrile hospitalized children aged 9-24 months. Iranian Journal of Pediatrics. 2009. 19(2), pp. 164-168
33. Pourmeidani H, Habibi M. Hierarchical defect tolerance technique for NRAM repairing with range matching CAM. 2013 21st Iranian Conference on Electrical Engineering, ICEE 2013. 34. Habibi M, Pourmeidani H. A hierarchical defect repair approach
for hybrid nano/CMOS memory reliability enhancement. 2014. Microelectronics Reliability. 54(2), pp. 475-484.
35. Niafar M, Bahrami A, Aliasgharzadeh A, Aghamohammadzadeh N, Najafipour F, Mobasseri M. Vitamin D status in healthy postmenopausal Iranian women. 2009. Journal of Research in Medical Sciences. 14(3), pp. 171-177
36. Abolghasemi J, Eshraghian MR, Toosi MN, Mahmoodi M, Foroushani AR. Introducing an optimal liver allocation system for liver cirrhosis patients. Hepatitis Monthly.2013. 13(8)