Abstract— Shadow detection is critical for robust and reliable video surveillance systems. In the presence of shadow, the performance of the video surveillance system degrades. If objects are merged together due to shadow then tracking and counting cannot be performed accurately. Many shadow detection methods have been developed for indoor and outdoor environments with different illumination conditions. Mainly shadow detection methods can be partitioned in three categories. This work performs comparative study for three representative works of shadow detection methods each one selected from different category: the first one based on intensity information, the second one based on photometric invariants information, and the last one uses color and statistical information to detect shadow. In this paper, we discuss these shadow detection approaches and compare them critically.
The comparison of three methods is performed using different performance metrics. From experiments, the method based on photometric invariants information showed superior performance comparing to other two methods. It combines color and texture features with spatial and temporal consistencies proving it excellent features for shadow detection.
I. INTRODUCTION
Shadow is one of the principal factors affecting computer vision performance. Shadows are created because of the occlusion of the light source by object in the video sequences. The object part that does not receive proper light from light source suffers from self-shadow. Similarly, the projection of the moving object on the background due to light is called cast shadow or moving cast shadow. Cast shadow is divided into two parts i.e. umbra and penumbra. Umbra is the darkest part of the shadow. From within the umbra, the source of light is completely concealed by occulting body. Penumbra is the partial shadow region where portion of the occulting body is occluding the light source. Detection and tracking of moving objects are important topics in dealing with image sequences. In real world, shadow causes serious problems while segmenting and extracting foreground. Objects can merge together because of the shadows. Shadow can also distort the sh ape of the object if the shadow of one object is projected on another
object. The difficulties associated with cast shadow detection rise since shadow and foreground share some same motional
features.
Rosin et al. [4] assumed that shadow is a region with reduced contrast and shadow region is detected using region growing algorithm. But the problem is that region growing algorithm cannot perform accurately in the penumbra part of the shadow. Jacques et al. [5] presented shadow detection algorithm for gray-scale video sequences. The algorithm works for both indoor and outdoor sequences. In [5], normalized cross-correlation is used to extract the foreground region, and shadow pixels are obtained. Zhang et al. [6] used ratio edge to detect shadow region for indoor and outdoor sequences. It is assumed that ratio edge is illumination invariant. Ratio edge is calculated as the ratio between the intensities of the neighboring pixels. Wang et al. [7] detected shadow in monocular images of indoor sequences using edge information, spatial and temporal information. Xu et al. [8] detected shadow region in gray-scale sequences of normal indoor environment. A number of techniques are used including initial change detection masks, canny edge maps, multi-frame integration, edge matching, and conditional dilation. Stauder et al. [9] detected shadow regions in the monocular video sequences. It is assumed that moving cast shadow is projected on the dominant background of the scene and shadow is caused by the object that is moving between light source and the background.
Cucchiara et al. [10] considered the color independence property in the HSV color space to detect shadow. It is assumed that if a pixel is covered by shadow, the hue and saturation components of the pixel only change within a certain limit. However, the hue components of pixels with poor illumination are usually unstable. Salvador et al. [12] proposed cast shadow segmentation algorithm for both still and moving images. For shadow detection, invariant color features and geometric features are used. Cavallaro et al. [13] used invariant color features to detect two types of shadows i.e. self shadow and cast shadow. The c1c2c3 model is used to extract color invariant features.
Tian et al. [14] used Gaussian mixture model to detect shadow regions. The GMM is combined with intensity and texture information. Liu et al. [15] detected shadow using pixel-level information, region-level information, and global-level information in HSV color space. Pixel-global-level information is extracted using GMM. Local-level information is used in
Comparative Study: The Evaluation of Shadow Detection
Methods
1
Habib Ullah,
2Mohib Ullah,
3Muhammad Uzair,
4Fasih ur Rehman
1,3,4
COMSATS Institute of IT, 2Politicnico Di Torino, 1,3,4Wah Cantt, Pakistan, 2Italy
1
two ways. First, if a pixel gets a sample that is likely to be a shadow, then not only the GMM of that pixel is updated but the GMM of neighbor pixels is also updated. Second, Markov random fields are employed to represent the dependencies among neighboring pixels. For global-level information, statistical feature is exploited for whole scene over several consecutive frames. Brisson et al. [16] used Gaussian mixture shadow models (GMSM) to build statistical models describing moving cast shadows on surfaces. The proposed statistical model can deal with complex and time varying illuminations.
In the next section, first three shadow detection methods are discussed. Then in the experimental section, thes e methods are compared and evaluated based on the performance metrics and time complexity. Finally the conclusion section is given.
II. DESCRIPT ION OF T HREE MET HODS
A comparative evaluation of each of the three methods is performed to analyze the performance of each of the three methods.
A. Pixel Intensity Based Approach
Jacques et al. [1] detected shadow after extracting foreground region. For building the initial background model, statistics like standard deviation and median are calculated. A pixel is considered shadow pixel if the following condition in equation (1) is satisfied:
3 3
( , )
( , )
1
( , )
( , )
t t
x std low
F x y
F x y
std
T and T
x y
x y
(1)Std3x3 is standard deviation that is calculated for the ratio values Ft(x, y)/(x, y) in a small neighborhood window of size 3x3 centered at (x, y). Tstd and Tlow are threshold values.
Tstd is a threshold that limits the deviation within the neighborhood of size 3x3 and is selected according to particular video sequence under experiment. Tlow is a threshold that is used so that dark object is not considered as shadow pixel. This threshold is also selected according to particular video sequence under experiment.
B. Photometric Invariants Based Approach
Lo et al. [2] proposed two algorithms. The algorithm based on the static background is considered in comparative study . Lo et al. [2] assumed that the foreground region including the shadow is already extracted by some foreground extraction algorithm. For detecting the shadow region, method [2] uses two photometric invariants including color invariant and texture invariant. For the purpose of efficiency and reliability, spatial consistency and temporal consistency are added to the shadow detection process. According to Lo et al [2], shadow detection method [2] has the ability to detect penumbra and umbra parts of the shadow.
According to the between-pixel invariants, ratio of intensities in the neighbor pixels in the foreground region is
equal to the ratio of neighbor pixels in the background image in the presence of shadow. The mathematical model is given in equation (2).
( , )
( , )
(
1, )
(
1, )
F x y
x y
F x
y
x
y
(2)In equation (2), F(x, y) represents the intensity of pixel at position (x, y) in the current extracted foreground region including shadow. λ(x, y) represents the intensity of pixel at position (x, y) in the background image.
Similarly,
( , )
( , )
( ,
1)
( ,
1)
F x y
x y
F x y
x y
(3)According to within-pixel invariants, the ratio of color information for a particular pixel in the current extracted foreground region is similar to the ratio of color information for the same pixel in the background image. The mathematical model for this property is given in equation (4).
( , )
( , )
( , )
( , )
r r
b b
F x y
x y
F x y
x y
(4)In equation (4), Fr(x, y) and Fb(x, y) represent red color and blue color for a pixel in the extracted foreground region respectively. Similarly λr(x, y) and λb(x, y) represent red color and blue color for the same pixel in the background region .
Similarly,
( , )
( , )
( , )
( , )
g g
b b
F
x y
x y
F x y
x y
(5)In equation (5), Fg(x, y) and Fb(x, y) represent green color and blue color for a pixel in the extracted foreground region respectively. Similarly λg(x, y) and λb(x, y) represent green color and blue color for the same pixel in the background region.
C. Color and Statistical Information Based Approach
pixel but the color will not change too much. As mentioned before, shadow detection is applied only in the extracted foreground region. The intensity of the pixel in the current foreground image is compared with the background image. For comparison, the following equation is used.
2 2 2 2 2 2
2 2 2R G B R G B R G B
Z
Z
Z
m
m
m
m
m
m
(6)
In equation (6), the ρ shows the percentage that pixel intensity is attenuated because of the shadow. ZR, ZG, and ZB indicate red, green, and blue intensity values for a pixel respectively. Similarly m represents mean value for a pixel in Gaussian mixture model. Shadow region cannot be too dark because of the lighting from different sources. If the color of the moving object is black, it must be detected as foreground not as shadow.
III. EXPERIMENTAL RESULTS
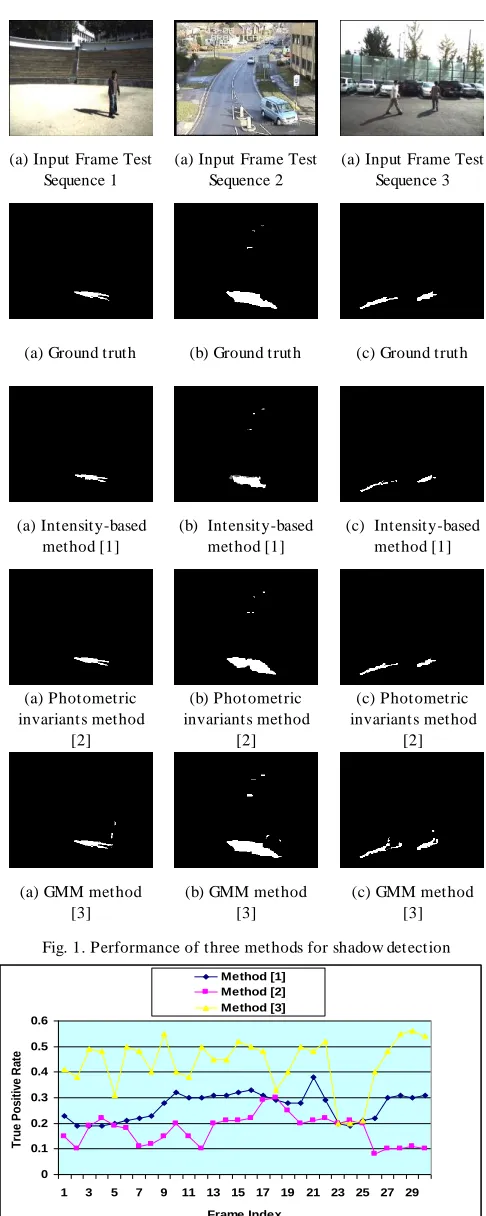
A comparative evaluation of each of the three methods is performed to analyze the performance of each of the three methods. Comparative evaluation is performed from different aspects using images from three test sequences. In the first evaluation step, results for images from three test sequences are compared with each other. For this purpose, ground truth images are generated for three frames. The performance of each of the three methods is compared against these ground truth images. Figure 1 shows result of three methods. First row shows input frames, second row shows calculated ground truth frames, third row shows result of method [1], fourth row shows result of method [2], and fifth row shows result of method [3].
As we can see in figure 1, method [1] did not consider color and texture information which can provide important clues to distinguish between shadow region and foreground region. As a result some dark parts of the moving objects are detected as shadow regions. Although method [3] detected comparatively large portion of shadows as compared to method [2], but significant parts of the moving objects are also detected as parts of the shadows. Photometric invariants based method [2] performed very well to make a clear distinction between moving cast shadow region and moving object region. This is because method [2] has used several important features for moving cast shadow detection including between-pixel invariants, within-pixel invariants, spatial consistency, and temporal consistency.
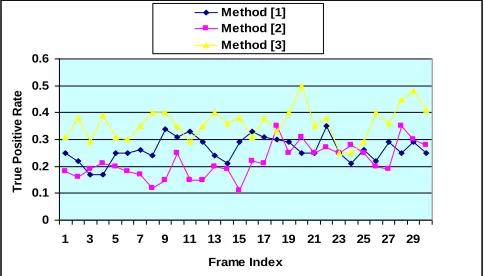
In order to further evaluate the performance of the three methods, standard set of performance metrics are considered consisting of true positive rate, false positive rate, precision, and recall. Graphs for the true positive rate for 30 frames at equal interval are calculated for three test sequences . Total numbers of frames in the test sequences are 700. The graphs for true-positive rate for three shadow detection methods are given in figure 2. Dark blue line in graph shows result for intensity-based method [1]. Light blue color line in the graph
shows result for the method [2]. Similarly, yellow color line in the graph shows result for the GMM method [3].
0 0.1 0.2 0.3 0.4 0.5 0.6
1 3 5 7 9 11 13 15 17 19 21 23 25 27 29
Frame Index
T
ru
e
Po
s
iti
v
e
R
a
te
Method [1] Method [2] Method [3]
Fig. 2. Graph-true positive rate of test sequence 1. (a) Input Frame Test
Sequence 1
(a) Input Frame Test Sequence 2
(a) Input Frame Test Sequence 3
(a) Ground truth (b) Ground truth (c) Ground truth
(a) Intensity-based method [1]
(b) Intensity-based method [1]
(c) Intensity-based method [1]
(a) Photometric invariants method
[2]
(b) Photometric invariants method
[2]
(c) Photometric invariants method
[2]
(a) GMM method [3]
(b) GMM method [3]
(c) GMM method [3]
0 0.1 0.2 0.3 0.4 0.5 0.6
1 3 5 7 9 11 13 15 17 19 21 23 25 27 29
Frame Index
T
ru
e
Po
s
iti
v
e
R
a
te
Method [1] Method [2] Method [3]
Fig. 3. Graph-true positive rate of test sequence 2.
0 0.1 0.2 0.3 0.4 0.5 0.6
1 3 5 7 9 11 13 15 17 19 21 23 25 27 29
Frame Index
T
ru
e
Po
s
iti
v
e
R
a
te
Method [1] Method [2] Method [3]
Fig. 4. Graph-true positive rate of test sequence 3.
From the graphs in figures (2, 3 and 4), we can see that GMM method [3] attained high true positive rate in most of the frames as compare to other two methods. High true positive rate means that GMM method [3] detected most o f the shadow region as compare to the other two shadow detection methods. GMM method [3] gained this high true positive rate at the cost of detecting major parts of moving objects. The graphs of the Intensity-based Method [1] is in between method [2] and method [3]. Intensity-based method [1] detected part of the shadow along with detecting very small part of the moving objects. The photometric invariants method [2] detected shadow with very small parts of the moving objects.
Graphs for the false positive rate for 30 frames for three test sequences are calculated in figures (5, 6 and 7).
0 0.05 0.1 0.15 0.2 0.25 0.3 0.35 0.4 0.45
1 3 5 7 9 11 13 15 17 19 21 23 25 27 29
Frame Index
F
a
ls
e
Po
s
iti
v
e
R
a
te
Method [1] Method [2] Method [3]
Fig. 5. Graph-false positive rate of test sequence 1.
0 0.05 0.1 0.15 0.2 0.25 0.3 0.35 0.4 0.45
1 3 5 7 9 11 13 15 17 19 21 23 25 27 29
Frame Index
F
a
ls
e
Po
s
iti
v
e
R
a
te
Method [1] Method [2] Method [3]
Fig. 6. Graph-false positive rate of test sequence 2.
0 0.05 0.1 0.15 0.2 0.25 0.3 0.35
1 3 5 7 9 11 13 15 17 19 21 23 25 27 29
Frame Index
F
a
ls
e
Po
s
iti
v
e
R
a
te
Method [1] Method [2] Method [3]
Fig. 7. Graph-false positive rate of test sequence 3.
From the graphs in figures (5, 6 and 7), we can see that GMM method [3] attained high false positive rate in all of the frames as compare to other two methods. Comparatively high false positive rate means that GMM method [3] detected some part of the moving region which is not shadow region as compare to the other two shadow detection methods. The graphs of the Intensity-based Method [1] and that of the photometric invariants based method [2] are lower than GMM method [3] which means that both methods detected little part of the moving object as compare to GMM method [3].
In order to perform further analysis, precision and recall graphs for the three shadow detection methods are given in figures (8, 9 and 10) and figures (11, 12 and 13) respectively.
0 0.1 0.2 0.3 0.4 0.5 0.6 0.7 0.8 0.9 1
1 3 5 7 9 11 13 15 17 19 21 23 25 27 29
Frame Index
Pr
e
c
is
io
n
Method [1] Method [2] Method [3]
0 0.1 0.2 0.3 0.4 0.5 0.6 0.7 0.8 0.9
1 3 5 7 9 11 13 15 17 19 21 23 25 27 29
Frame Index
Pr
e
c
is
io
n
Method [1] Method [2] Method [3]
Fig. 9. Graphs-precision of test sequence 2.
0 0.1 0.2 0.3 0.4 0.5 0.6 0.7 0.8 0.9 1
1 3 5 7 9 11 13 15 17 19 21 23 25 27 29
Frame Index
Pr
e
c
is
io
n
Method [1] Method [2] Method [3]
Fig. 10. Graphs-precision of test sequence 3.
Graphs for the recall of three methods are given in figures (11, 12 and 13).
0 0.1 0.2 0.3 0.4 0.5 0.6
1 3 5 7 9 11 13 15 17 19 21 23 25 27 29
Frame Index
R
e
c
a
ll
Method [1] Method [2] Method [3]
Fig. 11. Graphs-recall of test sequence 1.
0 0.1 0.2 0.3 0.4 0.5 0.6
1 3 5 7 9 11 13 15 17 19 21 23 25 27 29
Frame Index
R
e
c
a
ll
Method [1] Method [2] Method [3]
Fig. 12. Graphs-recall of test sequence 2.
0 0.1 0.2 0.3 0.4 0.5 0.6
1 3 5 7 9 11 13 15 17 19 21 23 25 27 29
Frame Index
R
e
c
a
ll
Method [1] Method [2] Method [3]
Fig. 13. Graphs-recall of test sequence 3.
From figures (8, 9 and 10) and figures (11, 12 and 13), we can see that method [2] shows good performance both in term of precision and recall. High value of precision means that the major part of the shadow is the actual part of the shadow. High value for recall means that very small part of the moving object is detected as part of the shadow.
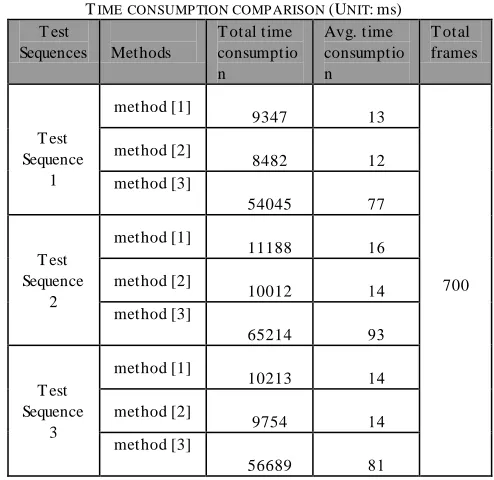
The evaluation of the three moving cast shadow detection methods is also performed in term of time consumption. Time consumption based evaluation can be used to find out whether a particular method can be used for real-time application. For evaluating the three methods based on time consumption, total time consumption and average time consumption are calculated for test sequences with 700 frames as shown in table I.
TABLEI
TIMECONSUMP TION COMP ARISON (UNIT:ms)
T est
Sequences Methods
T otal time consumptio n
Avg. time consumptio n
T otal frames
T est Sequence
1
method [1]
9347 13
700 method [2]
8482 12
method [3]
54045 77
T est Sequence
2
method [1]
11188 16
method [2]
10012 14
method [3]
65214 93
T est Sequence
3
method [1]
10213 14
method [2]
9754 14
method [3]
56689 81
IV. CONCLUSION
The paper performed comparative study for analyzing different shadow detection methods . It discussed various problems which exist in three shadow detection methods and presented extensive experimental evaluation of the three shadow detection methods in term of both performance and computational complexity. For evaluation purpose, we used world-wide extensively used evaluation metrics. The same frame numbers are used to elaborate problems existed in three shadow detection methods.
The results of the experiments performed on the three methods can be described as follows. Shadow detection method [1] based on the gray-scale pixel intensity value in the presence of illumination changes fails to detect shadow region accurately. Actually the pixel intensity value is susceptible to illumination changes. Method [3] detected large part of shadow at the cost of detecting major part of foreground. Method [2] performance is found to be better as compare to other two shadow detection methods because of the robust features it used.
There is another category where methods use statistical approaches. Statistical methods can be further divided into parametric and non-parametric methods. In future work, this category will also be investigated to make comparative study more comprehensive.
REFERENCES
[1] C.S. Jacques, C.R. Jung, and S.R. Musse, “ A background subtraction model adapted to illumination changes,” IEEE conference on image processing, page(s): 1817 -1820, October 2006.
[2] K. H. Lo, M. T . Yang, and R. Y. Lin, “Shadow removal for foreground segmentation,” Springer-Verlag Berlin Heidelberg, page(s): 342-352, 2006.
[3] Z. T ang, and Z. Miao, ”Fast background subtraction and shadow elimination using improved Gaussian mixture model,” IEEE workshop on haptic audio visual environments and their applications, page(s): 541 -544 ,October 2007.
[4] P. L. Rosin and T . Ellis, “ Image difference threshold strategies and shadow detection,” in 6th British Machine Vision Conference, Birmingham, page(s): 347 -356, 1996. [5] J.C.S. Jacques Jr., C.R. Jung, and S.R. Musse, “Background
subtraction and shadow detection in grayscale video sequences,” Proceedings of SIBGRAPI, Natal, Brazil, page(s): 189-196, IEEE press.
[6] W. Zhang, X.Z. Fang, and X. Yang, “Moving cast shadows detection based on ratio edge,” IEEE International conference on pattern recognition, page(s): 763 -766, November 2006.
[7] Y. Wang, T . T an, K.F. Loe, and J.K. Wu, “A probabilistic approach for foreground and shadow segmentation in monocular image sequences, “Pattern recognition society, page(s): 1937-1946, November 2005.
[8] D. Xu, X. Li, Liu, and Y. Yuan, “Cast shadow detection in video segmentation,” Pattern Recognition Letters, vol. 26, no. 1, pp. 5-26, 2005.
[9] J. Stauder, R. Mech, and J. Ostermann, “Detection of moving cast shadows for object segmentation,” IEEE transactions on multimedia, page(s): 65-76 Vol. 1, March 1999.
[10] R. Cucchiara, C. Grana, and M. Piccardi, “Detecting moving objects, ghosts, and shadows in video streams,” IEEE transactions on pattern analysis and machine intelligence, page(s): 1337-1342 Vol.25, October 2003.
[11] D. Grest, J. M. Frahm, and R. Koch, “A color similarity measure for robust shadow removal in real-time,” Vision, Modeling and Visualization, page(s): 253-260, 2003. [12] E. Salvador, A. Cavallaro, and T . Ebrahimi, “ Cast shadow
segmentation using invariant color features,” Computer Vision and Image Understanding, 95(2): 238-259, August 2004.
[13] A. Cavallaro, E. Salvador, and T . Ebrahimi, “Shadow identification and classification using invariant color models,” IEEE conference on acoustics, speech, and signal processing, page(s): 1545-1548, vol. 3, 2001.
[14] Y. L. T ian, M. Lu, and A. Hampapur, “Robust and efficient foreground analysis for real-time video surveillance,” IEEE Computer Vision and Pattern Recognition, 005, pp. I: 1182-1187.
[15] Z. Liu, K. Huang, and T . T an, “Cast shadow removal combining local and global features,” IEEE computer vision and pattern recognition, page(s)1-8, June 2007.