Image Optimization Algorithm Based on Salient
Region and Layout Adjustment
Zhen Hua
Shandong Institute of Business and Technology, Yantai, China [email protected]
Yewei Li and Jinjiang Li
Shandong Normal University, Jinan, China
Shandong Institute of Business and Technology, Yantai, China [email protected], [email protected]
Abstract: The purpose of image optimization is that the salient region of image is stand out, and is layout an image met the demand. The existed image optimization method is summarized, and their advantages and disadvantages respectively analyzed. The improved visual attention model is described, and is used to detect the salient region of image. The parameters of image optimization are calculated by the optimization function of image layout rules. At last, the weights of the images optimized parameters are adjusted by the image layout and adjustment function based on image optimized parameters, to achieve image layout and obtain the most optimal image, to realize image optimization. Experimental results validate that this methods not only achieve image optimization, but also accurately and automatically achieve to shorten distance and enlarge salient regions, improve the quality of the image optimization, and has good robustness.
Index Terms: visual attention model, salient region, layout adjustment, image optimization
I. INTRODUCTION
With the development of the image optimization technology, all kinds of image optimization methods have been formed. There are three kinds of methods of the most typical:
The first kind is image optimization technique based on retargeting. Images automatic retargeting has been proposed by Setlur in 2005 [1]. The advantage of this method is that it can automatically determine the image target. And this method can retarget large images to small size displays, particularly on mobile devices. This method adapts large images so that important objects in the image are still recognizable when displayed at a lower target resolution. However, the disadvantage of this method is that it must firstly segment image, and then to detect the important area. The efficiency of this method is not high.
The second kind is the image optimization technique based on cropping. Automatic cropping technology has been proposed by Suh in 2003 [2], and it has been widely used. The advantage of this method is that this method can detect key components of images so that automated cropping, prior to shrinking, can render objects more recognizable. Later, the seamless automatic cropping
technology has been proposed by Santella in 2006 [3]. The advantage of this technique is that the important area has been detected can achieve automatically image cropping. The disadvantage of this technology is that the accurate degree of image cropping depend on the accurate degree of the important area has been detected.
The third kind is the image optimization technique based on resize. The image optimization algorithm based on image cropping area has been proposed by Wang and Cohen in 2006 [4]. The advantage of this algorithm is that it makes full use of the image optimization method to optimize the image cropping area. This method is able to compose foreground elements onto a new background more efficiently and with fewer artifacts. And this method can enlarge the foreground while maintaining the wide angle view of the background, and composing a foreground element on top of similar backgrounds to help remove unwanted portions of the background or to re-scale or re-arrange the composite. However, the disadvantage of this algorithm is that it can not adjust the size of the optimization image. Later, the optimization algorithm based on image size has been proposed by Wang in 2008 [5]. The algorithm can solve the problem that the size of optimization image can not be adjusted, but the effect of image optimization is not the best.
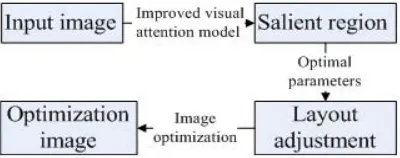
Above image optimization methods were reviewed, the target image is detected is not accurate, the optimization degree is not high, so the optimization effect is not ideal. In recent years, the visual attention model theory [6] and optimizing photo composition algorithm [7] are proposed to provide new ideas and methods for the image optimization, to achieve automatic detection of salient regions and re-layout of image. Based on the above theory, an image optimization algorithm based on salient region and optimization parameters are proposed in this paper. This paper algorithm flowchart is shown as Figure 1.
The layout and adjustment is under the image resolution ratio is not reduced to use the image layout and adjustment function to adjust the weights of image optimized parameters to achieve re-layout and optimization of input image, and obtain the most optimized image. Image optimization is advantageous to shorten far target, enlarge small target, remove irrelevant information, save salient regions and make salient regions more clearly, more close.
II. SALIENT REGION BASED ON IMPROVED VISUAL ATTENTION MODEL
Salient region is the basis of image optimized parameter is obtained, is the key of image optimization. The improved visual attention model algorithm is used to detect the salient region, to ensure the accuracy of salient region is detected, to improve the quality of the image optimization.
A. Visual Attention Model
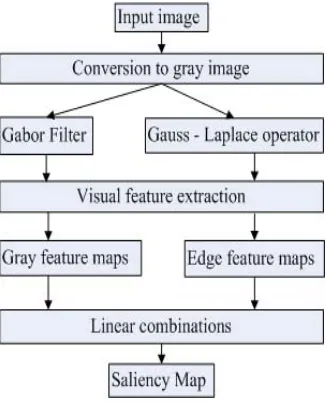
Itti has presented the visual attention model based on attention degree [8] in 1996. This model simulated the process that human eye observe image to select attention point. This paper adopts mathematical model to describe the process that the salient region map is generated. First of all, the visual attention model is used to select the attention point (visual features) from the input image. Visual features (colors, intensity and orientations) and background features are contrasted to obtain the attention value of attention point. Secondly, all the attention values are constituted a salient region map. At last, the dynamic neural network method is used to extract the salient region in the salient region map. The salient region generating process maps [9] are shown as Figure 2.
This method advantage is that extracting the salient region accurate is high. It not only comprehensive many kinds of visual features [10], but also the attention point is selected by the visual attention model and the attention point is observed by the human eye are consistent. However, it can not provide the accurate range for the salient region.
Input image will be decomposed into intensity, colors (red, blue, yellow, green) and orientations three visual features by visual attention model. In order to extract the input image visual features, this paper adopts 9 floors of gaussian pyramid [11]. The first 0 layer is input image. It is gaussian filter from the first layer to the 8th layer. It is primarily responsible for input image filtering and samp ling . Th e in tensity p yramid s
I
( )
σ
, c o lorspyramid
R
( )
σ
,B
( )
σ
,G
( )
σ
,Y
( )
σ
andorientations pyramids
O
(
σ θ
,
)
are used to extract the visual feature for each layer image. The intensity featureI
, red featureR
, blue featureB
, yellow featureY
and green featureG
can be respectively obtained by equation (1), (2), (3), (4) and (5).(
)
3
I
=
r
+ +
g
b
(1)(
)
2
R
= −
r
g
+
b
(2)(
)
2
G
= − +
g
r
b
(3)(
)
2
B
= − +
b
r
g
(4)(
)
2
Y
= + −
r
g
r
− +
g
b
(5)where:
r
,g
,b
is respectively red, green, blue three components in image.Location feature
O
(
σ θ
,
)
is Gabor pyramid that the intensity featureI
is obtained by the directionθ
of Gabor function in scaleσ
.σ
∈ ⋅⋅⋅
[
0
8
]
,{
0 , 45 , 90 ,135
}
θ
∈
D D D D.
After visual feature is extracted, each feature and its neighborhood point are subtracted by the center-surrounding method (visual feature and its neighborhood point are contrasted. the contrast value is bigger, the attention degree is stronger). In order to eliminate the influence of neighborhood, the multi-scale feature map [12] can be obtained by different scale subtracting in feature pyramid. The center of attention range corresponding to a point of feature map of scale c (
c
∈
{
2, 3, 4
}
), The point outside of attention range corresponding to a point of feature map of scales
(s
= +
c
δ
,δ
∈
{ }
3, 4
). The feature specific value of center scale c and peripheral scales
can be obtained by subtracting. Therefore,( , )
I c s
,RG c s
( , )
,BY c s
( , )
andO c s
( , , )
θ
are respectively obtained by equation (6), (7), (8) and (9).( )
,
( ) ( )
I c s
=
I c
−
I s
(6)( )
,(
( ) ( )
)
(
( ) ( )
)
RG c s = R c −G c − G s −R s (7)
( )
,(
( ) ( )
)
(
( ) ( )
)
BY c s = B c −Y c − Y s −B s (8)
(
, ,
) ( ) ( )
,
,
{
0 ,45 ,90 ,135
}
O c s
θ
=
O c
θ
−
O s
θ θ
∈
D D D D (9)where:
I c s
( , )
is the intensity feature map.RG c s
( , )
is red/green feature map.BY c s
( , )
is blue/yellow feature maps.RG c s
( , )
andBY c s
( , )
are also colors feature maps.O c s
( , , )
θ
is the orientations feature maps.In order to more intuitive describe the salient region in input image, many feature images are linear combinated the intensity, colors and orientations three kinds feature maps. At last, intensity, colors and orientations three kinds feature maps are added in fourth stage (
σ
=
4
) to obtain intensity, colors and orientations three featuremaps. Intensity feature map
I
, colors feature mapC
and orientations feature mapO
are obtained by equation (10), (11) and (12).( )
(
)
4 4
2 3
,
c
c s c
I
N I c s
+
= = +
= ⊕ ⊕
(10)( )
(
)
(
( )
)
4 4
2 3 , ,
c
c s c
C N RG c s N BY c s
+
= = + ⎡ ⎤
= ⊕ ⊕ ⎣ + ⎦
(11)
(
)
(
)
{ }
4 4
2 3
0 ,45 ,90 ,135
, , c
c s c
O N N O c s
θ
θ +
= = +
∈
⎛ ⎞
= ⎜⊕ ⊕ ⎟
⎝ ⎠
∑
D D D D
(12)
where:
⊕
express the summation operator in feature maps.Ν
is the normalized operation.After intensity, colors and orientations three feature maps are obtained; they are fused and normalized in gaussian pyramid fourth layer to obtain a salient region map. At last, the dynamic neural network method is used to extract the salient region from the salient region map [13]. The salient region can be obtained by the equation (13).
( )
( ) ( )
(
)
1
3
S
=
N I
+
N C
+
N O
(13)where:
Ν
( )
I
is the linear normalization of intensityfeature map
I
.Ν
( )
C
is the linear normalization ofcolors feature map
C
.Ν
( )
O
is the linear normalizationof orientations feature map
O
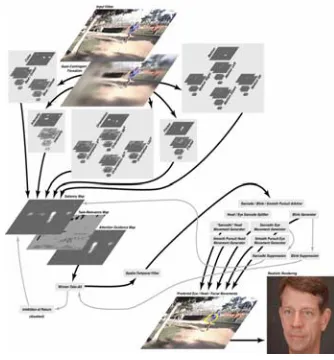
.As shown in Figure 3, it is a picture of salient region generating maps [14].
It is obtained by Itti's visual attention model. The maps can fully explain the entire process that the visual attention model has extracted the salient region. The input image is a walking man. We want to obtain the man face, so the man face is the salient region. Therefore, the man face is the attention key point. The basic idea is as follows:
(1) The visual attention model is used to select the attention point (visual features) from the input image. The visual features (colors, intensity and orientations) and background features are contrasted to obtain the attention value of attention point.
(2) The colors, intensity and orientations visual features of the input image are respectively extracted by Gabor filters and gaussian pyramid, so that generating many pictures of feature maps.
(3) Many pictures of feature maps are linear synthesis colors feature maps, intensity feature maps and orientations feature maps three pictures of feature maps.
(4) Three pictures of feature maps are once again linear synthesis a picture of salient region maps.
(5) At last, the dynamic neural network method is used to extract the salient region from the salient region maps, so that we can obtain a man face.
B. The Improved Visual Attention Model
In order to combine this paper image optimization algorithm, the visual attention model will be improved, and the improvements are as follows:
First and foremost, the visual features are improved. The traditional Itti's visual attention model uses the color, intensity and orientations [15] three kinds of visual features to stand out image salient regions. However, this paper method uses gray level and image edge two kinds of visual features to stand out image salient regions. The improvement advantage is: the gray level is an important feature that distinguishing the target region and the background region, and it can be used as the basis of image processing. Image edge can clearly reflect the salient region, and it can provide the accurate range of the salient region for the image optimization, so that the image optimization parameters will be obtained.
Secondly, the visual feature extraction tools are improved. The traditional Itti's visual attention model uses the gaussian pyramid to extract the visual feature. However, this paper method use Gauss-Laplace operator to extract the visual feature. The improvement advantage is that Gauss-Laplace operator extract edge features better than Gaussian pyramid, and image edge is extracted by
the Gauss-Laplace operator is very clear, and the extraction effect is obvious.
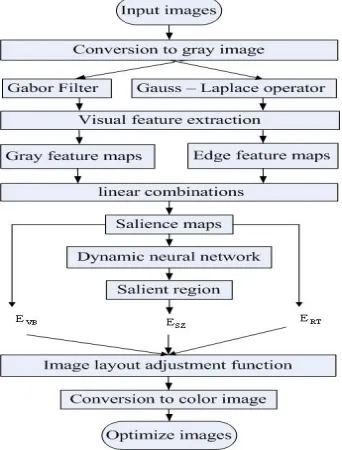
The improved advantage of visual attention model can not only quickly extract visual feature, but also beneficial to image optimization. And the improved visual attention model is beneficial to accurately extract salient regions, and improving the quality of the image optimization. The improved visual attention models are shown as Figure 4.
In this paper, visual features are extracted by converting the input image from the color image to the gray image. The conversion for our algorithm was done using Gauss-Laplace operator [16] and the Gabor filters [17]. After gray value and edge features are extracted, we obtain the gray feature maps and the edge feature maps. At last, the saliency maps is linear combined to obtain by the gray feature maps and the edge feature maps, the saliency region is detected in the saliency maps by the dynamic neural network methods.
Input image is converted in the form of gray images [18] in the improved visual attention model. The visual features of gray value and edge are obtained respectively by the Gabor filters and the Gauss-Laplace operator. “center-surround” differences between a “center” fine scale
c
and a “surround” coarser scales
yield the feature maps. These differences of the visual featuresG c s( , )andE c s( , ) are calculated by the equation(14) and equation (15).
G(c,s)= G(c)
−
G
(s)
(14)(c,s)= (c)
(s)
E
E
−
E
(15) After visual features are extracted by the Gabor filters and the Gauss-Laplace operator, the gray feature mapsGcand the edge feature mapsEc are calculated bythe equation (16) and equation (17). 4; 8 4
3 3
G(c,s) c s
c
c s c
G
+ <
= = +
=
∑ ∑
(16)4; 8 4
c
3 3
E(c,s) c s
c s c E
+ <
= = +
=
∑ ∑
(17)where: G c s( , )and ( , )E c scould be obtained by the equation (14) and equation (15).
After the gray feature maps and the edge feature maps are obtained by the equation (14) and equation (15), the salience region
S
is linear combined by these feature maps. The salient regionS
is calculated by the equation (18).c
( ) ( )
( )
2 c
G E
S= Ν Ν + Ν (18)
where: Νis the Normalizations.
III. LAYOUT ADJUSTMENT BASED ON OPTIMIZATION PARAMETERS
The weights of image optimized parameter are adjusted by the image layout and adjustment function, so as to achieve the image re-layout. The three optimized parameters of this paper are obtained respectively by the layout functions of salient region and visual balance [19] and the third rule [20].
A. The Optimization Parameters of Salient Regions (ESZ )
The salient region based on the improved visual attention model not only to provide the target area for the image optimization, but also provide the image optimization parameters for image layout and adjustment. Salient region optimization parameters are one of the three parameters of image optimization [21]. It is the basis of obtaining the most optimal image. Its main function is that adjustment the size of the salient region in image.
Let
r S
( )
i is the size of salient regionS
. The optimization parameters of salient regions are obtained by the equation (19).2( )
2
max
i
r S
SZ i
E
=
∑
e
− τ (19)where:
τ
=
0.07
.B. The Optimization Parameters of Visual Balance (EVB )
The main function of visual balance optimization parameters is that adjusting the position of the salient region in image, and ensuring the visual effect of image resizing. The optimization parameters of visual balance are obtained by the equation (20).
2
1
2
VB
d
VB
E
e
σ−
=
(20)where: ( , 1 ( ) ( ))
( )
VB M i i i
i i
d d C M S C S M S
=
∑
∑
,M S
( )
i is“Mass” of salient region
S
,d
Mis normalized ManhattanC. The Optimization Parameters of Rule of Thirds (ERT )
The main function of the rule of thirds optimization parameters is that adjusting the position relations of the salient region and the other region, and ensuring the rationality of image layout. Two parallel lines of horizontal and vertical are used by the rule of thirds to divide the input image into 9 equal parts. The points of four parallel lines intersection are referred to as “power points”, and the region within “power points” is often the salient region has been detected. The optimal parameters
of rule of thirds have two parts:
E
pandE
l. Ep andE
lare obtained respectively by the equation (21) and equation (22). 2 2 ( ) 2 1 ( ) ( ) i D Sp i i
i i
E M S e
M S
σ −
=
∑
∑
(21)where:
1,2,3,4
( )i min M( ( ),i j)
j
D S d C S G
=
= is the minimal
distance from the center value of regionC S( )i to the four
power pointsGj,
σ
2=
0.17
. 2 3 ( ) 2 1 ( ) ( ) R i D Ll i i
i i
E I L e
I L
σ −
=
∑
∑
(22)where:
1,2,3,4
( )
min
( ,
)
R i L i j
j
D L
d L R
=
=
is the minimum linedistance between parallel lines
L
iandR
j,I L
( )
i is valueof the horizon line
L
i, andσ
3=
0.17
.The optimization parameters of the rule of thirds are obtained by the equation (23).
RT p p l l
E
=
γ
E
+
γ
E
(23)where: 1
3
p
γ = and 2
3
L
γ = are weights, Ep and El are
obtained respectively by the equation (21) and equation (22).
D. Image Layout Adjustment Function Based on Image Optimization Parameters
The layout and adjustment based on image optimization parameters are achieved by image layout adjustment function. The function is obtained by the theorem 1.
Theorem 1: If RT RT VB VB a
RT VB
E E
E ω ω
ω ω
+ =
+ , the weights of
image optimization parameters (
ω
RT,ω
VBandω
SZ) are adjusted by the image layout and adjustment function(1
SZ)
a SZ SZE
= −
ω
E
+
ω
E
to achieve the imageoptimization.
Proof: according to the above formula and by
(1
SZ)
a SZ SZE
= −
ω
E
+
ω
E
2( )
2
(1
)
max
i
r S
RT RT VB VB
SZ SZ i
RT VB
E
E
e
τω
ω
ω
ω
ω
ω
−+
= −
+
+
∑
2 2 32 ( )
2
(
)
(1
)
max
VB
i
d
r S RT p p l l VB
SZ SZ i
RT VB
E
E
e
e
σ τω γ
γ
ω
ω
ω
ω
ω
− −+
+
= −
+
+
∑
2 2 2 3 1 2 ( ) ( ) 2 2 2 1 1 ( ( ) ( ) ) ( ) ( ) (1 ) VBi R i d
D S D L
RT p i i l i i VB
i i
i i
SZ
RT VB
M S e I L e e
M S I L
σ σ σ ω γ γ ω ω ω ω − − − + + = − +
∑
∑
∑
∑
2 ( ) 2max
i r SSZ i
e
τω
−+
∑
2 2 2 3 1 2 ( ) ( ) 2 2 2 1 1(1 ) ( ) ( )
( ) ( )
VB
i Ri d
D S D L
VB RT
SZ p i i l i i
RT VB i i i i RT VB
M S e I L e e M S I L
σ σ σ ω ω ω γ γ ω ω ω ω − − − ⎡ ⎛ ⎞ ⎤ ⎢ ⎜ ⎟ ⎥ = − + + ⎜ ⎟ + + ⎢ ⎝ ⎠ ⎥ ⎣
∑
∑
∑
∑
⎦2( )
2
max
i
r S
SZ i
e
τ
ω
−+
∑
Therefore, the most optimal image is obtained by the image layout and adjustment function adjust the weights (
ω
RT,ω
VBandω
SZ) of image optimization parameters.IV. LAYOUT ADJUSTMENT BASED ON OPTIMIZATION PARAMETERS
The basic ideas of this paper image optimization: the improvement visual attention model is used to detect the salient region in image. Image optimization parameters are obtained by the image layout functions. At last, the most optimal image is obtained by the image layout and adjustment function to adjust the weights of image optimization parameters. The specific steps of this paper image optimization algorithm are as follows:
(1) First of all, the input image is preprocessed. It includes denoising and gray operation.
(2) The grayscale and edge two visual features of the input image are respectively extracted by Gabor filters and Gauss-Laplace operator.
(3) The grayscale feature map and edge feature map are obtained by many feature maps linear normalized. At last, the grayscale feature map and edge feature map linear synthesis a salient region map.
(4) The salient region is obtained by the dynamic neural network method from the salient region map. The salient region is successfully extracted to distinguish the salient region and the other region. It provides the target object and the salient region optimization parameters for the image optimization.
(5) Optimization parameters of salient region are obtained by the layout function of salient region. It can provide the optimization parameters for the image layout and adjustment function. Its main function is that adjustment the size of the salient region in image.
adjusting the position of the salient region in image, and ensuring the visual effect of image optimization.
(7) Optimization parameters of rule of thirds are obtained by the layout function of rule of thirds. It can also provide the optimization parameters for the image layout and adjustment function. Its main function is that adjusting the position relations of the salient region and the other region, and ensuring the rationality of image layout.
(8) The weights of image optimization parameters are adjusted by the image layout and adjustment function to achieve image optimization, to obtain the most optimal image.
(9) At last, the most optimal image is converted to the color image. The color image is the optimization image.
V. EXPERIMENTS
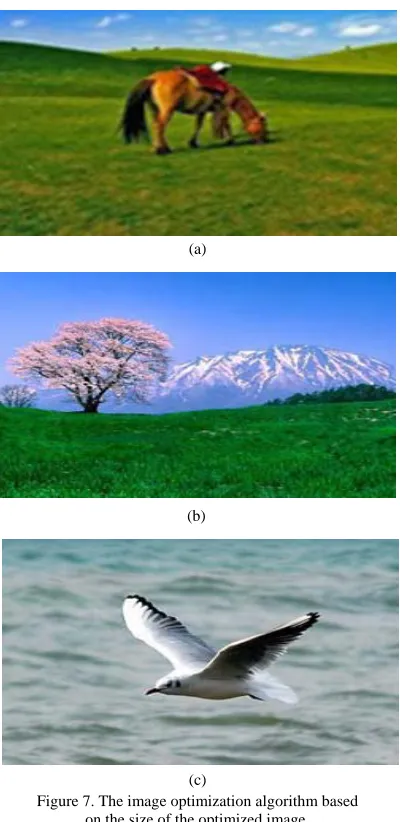
In order to verify the feasibility and effectiveness of this paper algorithm, the experimental environment adopts the machines of the Intel Pentium (R) 2.8 GHz, memory 1G and the operating system of Windows XP. This paper use three different natural scenery images and two kinds of methods (the image optimization algorithm based on the size of the optimized image and this paper algorithm). Normally, the image optimization algorithm based on the size of the optimized image can effectively achieve the image optimization, but the salient region optimization effect is not obvious. Compared with experimental results, this method is verified effective and feasible.
Figure 6 (a), (b) and (c) are the input image. And (a), (b) and (c) are conducted the optimization experiment by the image optimization algorithm based on the size of the optimized image and this paper algorithm. Figure 7 (a), (b) and (c) three images and figure 8 (a), (b) and (c) three images are the experimental results map that they are
respectively optimized by the image optimization algorithm based on the size of the optimized image and this paper algorithm. Figure 7 (a), (b) and (c) can be observed to find that the image optimization algorithm based on the size of the optimized image can achieve the image optimization, but can not obviously reflect the optimization effect of salient region. And they can be closely range observed the salient region in the optimization image. Figure 8 (a), (b) and (c) are the experimental results map that they are optimized by this paper algorithm. This paper method can not only reflect the optimization effect of salient region, but also can achieve closely range to observe the salient region in the optimization image. Compared with the input image and the former experimental results maps, this paper method can not only clearly reflect the salient region resizing effect, but also helpful to observe the salient region.
(c) (b) (a)
Figure 5. Image optimization algorithm based on salient region and layout adjustment.
Experimental results validate that this paper algorithm not only can achieve image optimization, but also can solve issues which are left by the traditional method, also can achieve automatic detection of salient region and guarantee the accuracy of the detection, and make the target area is more evident, more detailed observations the target area. This paper method improves the quality of the image optimization.
VI. CONCLUSION AND OUTLOOK
The salient region is optimized to become close distance detailed observations salient region to reality by this paper algorithm. Improved visual attention model can automatically achieve detection of salient region and provide the basis for image optimization. The image layout and adjustment use image layout and adjustment function to adjust the weights of image optimization parameters to achieve image re-layout and optimization, and obtain the most optimal image. But this paper algorithm can not suitable for various image optimizations, there's plenty of work to finish urgently.
Looking to the future, the image optimization methods will develop toward accurate, rapid, automatic and adaptive and robustness.
ACKNOWLEDGEMENT
This work is supported by the National Natural Science Foundation of China (NSFC) under Grant No. 60970105; Natural Science Foundation of Shandong Provincial under Grant No. Y2007G22, 2009ZRB01620 and ZR2010FM044; Shandong Outstanding Young Scientist Research Award Fund No. 2008BS01026; Science and technology projects of Shandong Province Education Department No. J08LJ06.
REFERENCES
[1] V. Setlur, S. Takagi, R. Raskar, M. Gleicher, and B. Gooch, Automatic image retargeting, Proceedings of the 4th international conference on Mobile and ubiquitous multimedia, New York: USA, 2005, pp. 59-68.
[2] B. Suh, H. Ling, B. Bederson, and D. Jaobs, Automatic thumbnail cropping and its effectivness, Proceedings of the 16th annual ACM symposium on User interface software and technology, New York: USA, 2003, pp. 95-104. [3] A. Santella, M. Agrawala, D. Decarlo, D. Salesin, and M.
F. Cohen, Gaze-based interaction for semi-automatic photo cropping, Proceedings of the SIGCHI conference on
(c)
Figure 7. The image optimization algorithm based on the size of the optimized image.
(a) (a)
(b)
(c)
Human Factors in computing systems, New York: USA, 2006,pp. 771-780.
[4] J. Wang, and M. F. Cohen, Simultaneous matting and compositing, IEEE Conference on Computer Vision and Pattern Recognition, Minneapolis: USA, 2007, pp. 1-8. [5] Y. S. Wang, C. L. Tai, O. Sorkine, and T. Y. Lee,
“Optimized scale-and-stretch for image resizing,” ACM Transactions on Graphics, 2008.
[6] L. Itti, E. Niebur, J. Braun, and C. Koch, A trainable model of visual attention, In: Proc. Society for Neuroscience Annual Meeting, 1996, p. 270.
[7] L. Ligang, C. Renjie, W. Lior, and D. Cohen-Or, “Optimizing Photo Composition,” Computer Graphics Forum, Vol. 29, pp. 469- 478, May 2010.
[8] E. Niebur, L. Itti, and C. Koch, A neural model for the “Where” pathway, In: Proc, Canadian Institute for Advanced Research, Artificial Intelligence and Robotics Program, Workshop on Visual Attention: Focus on Modeling, Toronto, Canada, 1996.
[9] L. Itti, C. Koch, and E. Niebur, “A model of saliency-based visual attention for rapid scene analysis,” IEEE Transactions on Pattern Analysis and Machine Intelligence, Vol. 20, pp. 1254-1259, 1998.
[10]L. Itti, and C. Koch, “Feature combination strategies for saliency-based visual attention systems,” Electron Imaging, Vol. 10, pp. 1-9, 2001.
[11]E. H. Adelson, C. H. Anderson, J. R. Bergen, P. J. Burt, and J. M. Ogden, “Pyramid methods in image processing,”
RCA Engineer, Vol. 29, pp. 33- 41, 1984.
[12]A. M. Treisman, and G. Gelade, “A feature-integration theory of attention,” Cognitive Psychology, Vol. 12, pp. 97-136, 1980.
[13]J. K. Tsotsos, S. M. Culhane, W. Y. K. Wai, Y. H. Lai, N. Davis, and F. Nuflo, “Modelling visual attention via selective tuning,” Artificial Intelligence, pp. 507-545, 1995. [14]L. Itti, N. Dhavale, and F. Pighin, Realistic avatar eye and head animation using a neurobiological model of visual attention, In: Proc. SPIE 48th Annual International Symposium on Optical Science and Technology, Vol. 5200, 2003, pp. 64-78.
[15]M. I. Posner, and Y. Cohen, “Components of visual orienting,” Attention and Performance, Vol. 10. pp. 531-556, 1984.
[16]P. J. Burt, and E. H. Adelson, “The laplacian pyramid as a compact image code,” IEEE Transactions on Communications, pp. 532-540, 1983.
[17]D. M. Weber, and D. P. Casasent, “Quadratic gabor filters for object detection,” IEEE Transactions on Image Processing, pp. 218-230, 2001.
[18]L. Itti, and C. Koch, “A saliency-based search mechanism for overt and covert shifts of visual attention,” Vision Research, Vol. 40, pp.1489-l506, 2000.
[19]S. Lok, S. Feiner, and G. Ngai, Evaluation of visual balance for automated layout, Proceedings of the 9th international conference on intelligent user interfaces, 2004, pp. 1-8.
[20]Z. Byers, M. Dixon, W. D. Smart, and C. M. Grimm, “Say cheese! Experiences with a robot photographer,” AI Magazine, Vol. 25, pp. 37-46, 2004.
[21]B. Gooch, E. Reinhard, C. Moulding, and P. Shirley,
Artistic composition for image creation, Proceedings of the 12th Eurographics workshop on Rendering Technique, 2001, pp. 83-88.
Zhen Hua is a professor of school of information & electronic engineering, Shandong Institute of Business and Technology. She is a member of China Computer Federation and IEEE. She awarded a Ph.D degree in computer science at China university of mining and technology. Her research interests include virtual reality, information visualization.
Yewei Li born in 1983. Now he is studied for his M.S. degree in computer science at Shandong Normal University. He is a CCF student member. His research interests is image processing.