International Journal of Emerging Technology and Advanced Engineering
Website: www.ijetae.com (ISSN 2250-2459, ISO 9001:2008 Certified Journal, Volume 7, Issue 8, August 2017)
273
Optimization of Process Parameters in Welding of Dissimilar
Steels Using Robot TIG Welding
G. Navaneeswar Reddy
1, M. Venkata Ramana
21Mechanical Engineering Department, VNRVJIET, Hyderabad, India
2 Professor, Automobile Engineering Department, VNRVJIET, Hyderabad, India
Abstract—Robot TIG welding is a modern technique used for joining of two work pieces with high precision. Design of Experiments is used to conduct experiments by varying weld parameters like current, wire feed and travelling speed. The welding parameters play important role in joining of dissimilar stainless steel SS 304L and SS430. In this work, influences of welding parameter on Robot TIG Welded
specimens are investigated using Response Surface
Methodology. The ultimate tensile strength (UTS) of the weldments are measured. The process parameters are optimized to maximize of the weldments
Keywords—Robot TIG welding, AISI 304l, AISI 430, Response Surface Methodology, Ultimate Tensile Strength
I. INTRODUCTION
Robot welding means welding that is performed and controlled by robotic equipment. In general equipment for automatic arc welding is designed differently from that used for manual arc welding. Automatic arc welding normally involves high duty cycles and the welding equipment must be able to operate under these conditions. In addition, the equipment components must have the necessary features and controls to interface with the main control system. 2D vision sensor system has been designed for the welding robot which can detect the localization of the material and coordinate the part position of the welding tip. By analyzing the KRL program, it is been proposed to detect the edges of seam, pool and extract the parameters of
welding [1]. As is well known, high-quality welding
requires real-time control of weld pool dynamics. Effective detection and control of weld pool dynamic features are puzzling problems for the welding robot and are also key technologies for intelligent welding robots in the future [2]. Weld penetration is a crucial welding quality parameter. Control of weld penetration is at all times a puzzling problem in automatic or robotic welding [3]. Based on the properties of AISI 304l, the process parameters are selected for the Robot TIG welding to improve the performance of
system[4]. Investigating the welding behavior of SS304L
and SS430 in terms of mechanical properties using filler wire ER-309L was performed. Robot TIG welding was done on SS304 and SS430 plate thickness of 5mm [5].
Optimization of welding parameters is consumes less time and economy, therefore it is a tendency of the application of statistical methods such as Design of Experiments (DOE) to conduct the experiments [6]. This result indicates that the developed models are to sufficiently predict the responses within the limits of input
parameters [7].Response Surface Methodology (RSM) is a
collection of statistical and mathematical techniques that are useful for the modeling and analysis of problems in which a response of interest is influenced by several variables and objective is to optimize the responses [8]. Influence on the mechanical properties of gas tungsten arc welded 304L stainless steel (SS) joints was studied. The gas tungsten arc welding process (GTAW) and weld joints made using these combinations were subjected to tensile testing so as to analyze the effect of thermal arc energy on the mechanical properties of these joints. The results of this investigation indicate that the joints made using low heat input exhibited higher ultimate tensile strength (UTS) than those welded with medium and high heat input [9].
II. EXPERIMENTAL PROCEDURE
A. Materials and welding conditions
International Journal of Emerging Technology and Advanced Engineering
Website: www.ijetae.com (ISSN 2250-2459, ISO 9001:2008 Certified Journal, Volume 7, Issue 8, August 2017)
274
Applications of SS304/304l are Chemical and
Petrochemical, Processing—pressure vessels, tanks, heat exchangers, piping systems, flanges, fittings, valves and pumps, fasteners. Food and Beverage Processing, Medical, Mining etc. The ferritic quality has high weld ability and is economical where demands for corrosion resistance are not very strong. The corrosion resistance of the ferritic quality is not as high as for the austenitic quality, but it does not have a tendency to stress corrode in a chloride environment.
Typical applications for 430 grade are Linings for dish washers, Refrigerator cabinet panels, Automotive trim, Lashing Wire, Element Supports, Stove trim rings, Fasteners etc., its chemical composition and properties are shown in table 1 and table 2 show the main feature and composition of ER 309L filler wire. The deposition was carried out in flat position, gas flow rate has taken constant in all tests no buffer layers are used.
TABLE 1
Chemical composition of SS30L and SS430
Element C Si Mn P S Cr Ni Fe
SS304L 0.030 0.75 2.00 0.045 0.030 18-20 8-12 Bal
Element C Si Mn P S Cr Ni Fe
[image:2.612.44.571.276.406.2]SS430 0.044 0.270 0.560 0.031 0.012 16.36 0.17 Bal.
TABLE 2
Chemical composition of ER309L
Element C Cr Ni Mo Mn Si p S Cu
ER309L 0.12 23-25 12-14 0.75 1.0-2.5 0.30-0.65 0.03 0.03 0.75
B. Methodology
Figure 1. Shows the experimentation methodology of the Robot TIG welding .
Figure 1. Flowchart of Experimental Methodology
C. Designing of experiment
Before conducting the experiment, the knowledge of the product /process under investigation of prime importance for identifying the factors likely to influence the outcome. In order to compile a comprehensive list of factors, the input to the experiment is generally obtained from the Various literature reviews and the people in this project. The factors that were considered for studying in this project
are Current, Wire-feed, Travelling speed. In the current
work a Box –Behenken response surface design is selected based on the fact that it requires less number of runs than the CCD design for the same number of factors.
This is done by taking into consideration the cost for welding. The selection of number of levels depends on how the performance parameter is a linear function of the independent variable, and then the number of level setting shall be 3. However, if the independent variable is not linearly related, then one could go for 3, 4 or higher levels depending on whether the relation- ship is quadratic or higher order. The levels for the current factors are shown in table 3.
TABLE 3
Independent variable and Experimental design levels
Variables Low High
Current(amps) 120 180
Wire Feed(mm/min) 0.62 0.82
Travelling Speed(mm/min) 0.070 0.080
International Journal of Emerging Technology and Advanced Engineering
Website: www.ijetae.com (ISSN 2250-2459, ISO 9001:2008 Certified Journal, Volume 7, Issue 8, August 2017)
[image:3.612.326.559.123.404.2]275
TABLE 4Design matrix , Experiments designed in the table
D. Welding Operation
Figure 2 a, b. work piece is clamped to the work piece bench using clamps to hold the two metals and joint the horizontal phase and tight the clamps with support to bolts and the work piece is aligned. Before starting the welding to set the defined parameters on the machine and write the program to the Robot. The welding process parameters are weld current, wire-feed, travelling speed. After fixing the parameters with -out switching the torch can do trial run on the work piece
Before starting the welding, can again check the program and ready to execute it.
Figure 2a. Robot TIG Welding machine
Figure 2b. Work piece welded by Robot Welding
E. Testing the welded pieces
The Universal tensile testing machineis used to test the
pieces and measure the values of ultimate tensile strength, as per ASTM E8 and the results are shown in table5 .The Figureure 3 shows the tensile tested piece.
Figure3. Tensile Test specimen
Figure 4. Tensile specimen before and after Testing
Current (amps) Wire feed
(mm/min)
Travelling Speed(mm/
min)
150 0.72 0.075
180 0.72 0.070
180 0.72 0.080
150 0.72 0.075
150 0.62 0.080
150 0.72 0.075
120 0.72 0.080
150 0.72 0.075
120 0.62 0.075
180 0.82 0.075
180 0.62 0.075
150 0.82 0.070
150 0.62 0.070
120 0.72 0.070
150 0.72 0.075
150 0.82 0.080
[image:3.612.41.284.163.450.2]International Journal of Emerging Technology and Advanced Engineering
Website: www.ijetae.com (ISSN 2250-2459, ISO 9001:2008 Certified Journal, Volume 7, Issue 8, August 2017)
[image:4.612.48.288.203.457.2]276
The weld pieces, and then subjected to Ultimate Tensile strength test on a universal testing machine to evaluate the weld joints and results are note down in table 5.TABLE 5
Ultimate Tensile Strength Test values
current Wire-feed travelling speed Uts (mpa)
150
0.72
0.075
480.69
180
0.72
0.07
432.88
180
0.72
0.08
469.61
150
0.72
0.075
487.64
150
0.62
0.08
439.16
150
0.72
0.075
475.66
120
0.72
0.08
270.84
150
0.72
0.075
442.16
120
0.62
0.075
271.99
180
0.82
0.075
410.56
180
0.62
0.075
438.56
150
0.82
0.07
434.32
150
0.62
0.07
440.49
120
0.72
0.07
375.84
150
0.72
0.075
490.66
150
0.82
0.08
417.98
120
0.82
0.075
325.66
III. RESULTS AND DISCUSSIONS
A. Optimum conditions for Ultimate Tensile Strength
Figure.5 shows that the optimum solution plot for desirability of current, wire feed and travelling speed to maximize Ultimate Tensile strength . Optimum conditions predicted for the Ultimate Tensile strength are current at 166 amps, wire feed at 0.70 mm/min and travelling speed at 0.077mm/min.
The predicted Ultimate Tensile strength is 489.774 Mpa.
under these optimum conditions with composite
desirability is 0.99.
Figure5. Optimum condition plot
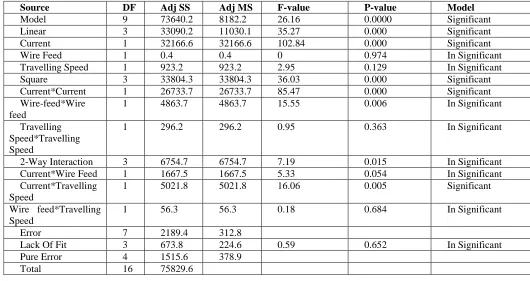
B. Analysis of Variance
The test for the significance for the regression models, the F-test and P-value for the significance on individual model coefficients and lack of fit test are performed using the same statistical. For assigning the linear model terms and full quadratic models are summarize by using polynomial values to analyze the analysis of variance of Ultimate Tensile Strength and show the significant terms at
confidence level of 0.95. The measured R2 and predicted R2
are shown in table6. The normal probability plots of the residuals for tensile strength are shown in Figureure6, which reveals the residuals are falling on the straight line. This indicates that errors are normally distributed and the
empirical relationship is correctly developed. In Figure
7,8,9 indicates 3D surface plots, two parameters are shown on X, Y axes and the response is depicted in Z axis, which finally reveals the optimum point. For example, if the maximum value for tensile strength is required, it is demonstrated by the top point. Show surface plots of tensile strength, obtained from a regression model at the current of 166 A, wire feed of 0.70 mm/min and travelling speed of 0.0779 mm/min. The top points of surface plots are optimum values. It is maximum value of 489.774MPa.
Regression Equation in Uncoded Units
uts = -3803 + 15.86 current + 6476 wire feed + 18146 travelling speed - 0.08854 current*current - 3399 wire feed*wire feed - 335490 travelling speed*travelling speed - 6.81 current*wire feed + 236.2 current*travelling speed -
International Journal of Emerging Technology and Advanced Engineering
Website: www.ijetae.com (ISSN 2250-2459, ISO 9001:2008 Certified Journal, Volume 7, Issue 8, August 2017)
[image:5.612.39.569.163.444.2]277
TABLE 6Anova for Ultimate Tensile Strength Test Model
Source DF Adj SS Adj MS F-value P-value Model
Model 9 73640.2 8182.2 26.16 0.0000 Significant
Linear 3 33090.2 11030.1 35.27 0.000 Significant
Current 1 32166.6 32166.6 102.84 0.000 Significant
Wire Feed 1 0.4 0.4 0 0.974 In Significant
Travelling Speed 1 923.2 923.2 2.95 0.129 In Significant
Square 3 33804.3 33804.3 36.03 0.000 Significant
Current*Current 1 26733.7 26733.7 85.47 0.000 Significant
Wire-feed*Wire feed
1 4863.7 4863.7 15.55 0.006 In Significant
Travelling Speed*Travelling Speed
1 296.2 296.2 0.95 0.363 In Significant
2-Way Interaction 3 6754.7 6754.7 7.19 0.015 In Significant
Current*Wire Feed 1 1667.5 1667.5 5.33 0.054 In Significant
Current*Travelling Speed
1 5021.8 5021.8 16.06 0.005 Significant
Wire feed*Travelling Speed
1 56.3 56.3 0.18 0.684 In Significant
Error 7 2189.4 312.8
Lack Of Fit 3 673.8 224.6 0.59 0.652 In Significant
Pure Error 4 1515.6 378.9
Total 16 75829.6
R-sq. 0.9711, Adj-Rsqu- 0.934, Predi-R-sq.- 0.826
Des ign-Expert® Software Fac tor Coding: Ac tual R1 (mpa)
Des ign points above predic ted value Des ign points below predic ted value
490.66
270.84
X1 = A: Current X2 = B: Wirefeed Ac tual Fac tor C: T ravelling s peed = 0.075
0.62 0.67 0.72 0.77 0.82
120 130
140 150
160 170
180 250
300 350 400 450 500
R1
(m
pa
)
A: Current (amps) B: Wiref eed (mm/min)
Figure 6. Normal probability plot of Residual for UTS
[image:5.612.55.270.496.593.2]Figure 7. 3D surface plot showing the interactive
International Journal of Emerging Technology and Advanced Engineering
Website: www.ijetae.com (ISSN 2250-2459, ISO 9001:2008 Certified Journal, Volume 7, Issue 8, August 2017)
278
Des ign-Expert® SoftwareFac tor Coding: Ac tual R1 (mpa)
Des ign points above predic ted value
Des ign points below predic ted value
490.66
270.84
X1 = B: Wirefeed X2 = C: T ravelling s peed
Ac tual Fac tor A: Current = 150
0.07 0.072 0.074 0.076 0.078 0.08 0.62 0.67 0.72 0.77 0.82 250 300 350 400 450 500 R1 (m pa )
B: Wiref eed (mm/min) C: Travelling speed (mm/min)
Figure 8. 3D surface plot showing the interactive effect of Travelling speed and wire feed on UTS.
Des i gn-Expert® Software Fac tor Codi ng: Ac tual R1 (mpa)
Des i gn poi nts above predi c ted val ue
Des i gn poi nts bel ow predi c ted val ue
490.66
270.84
X1 = A: Current X2 = C: T ravel l i ng s peed
Ac tual Fac tor B: Wi refeed = 0.72
0.07 0.072 0.074 0.076 0.078 0.08 120 130 140 150 160
170 180 250 300 350 400 450 500 R1 (m pa )
A: Current (amps) C: Travelling speed (mm/min)
Figure 9. 3D surface plot showing the interactive effect of current and travelling speed on UTS.
IV. CONCLUSIONS
1. A mathematical model is developed to predict the Tensile Strength test of Robot TIG welding of dissimilar steels SS304l and SS 430 joints with 95% of confidence level. The model is developed to predict the Ultimate Tensile strength with input parameters. 2. he optimum process parameters to maximize the
Ultimate Tensile Strength are current at 166 amps, wire feed is 0.70 mm/min and travelling speed is 0.0779 mm/min. The predicted UTS under optimum conditions are 489.774.
3. The Analysis of Variance shows that the process parameters of the linear regression model are significant and Current is highly influencing the Ultimate Tensile Strength.
Acknowledgement
I am thankful to my guides Dr. M. VENKATA RAMANA and Mr. M. VENKATESHWARA RAO for their constant encouragement, guidance and valuable support. I am also thankful to all other teaching and non-teaching faculty for their support and suggestions. I take this opportunity to express my deep sense of gratitude towards those who have helped me in various ways for preparing this paper. At the last but not least, I am thankful to my parent, who had encouraged and inspired me with their blessings and to my friends who helped me directly or indirectly in endeavor and infused their help for the success
of publishing this paper.
REFERENCES
[1] S. B. Chen, Y. Zhang, T. Qiu ,T. Lin, 2003. Robotic Welding Systems with Vision-Sensing and Self-learning Neuron Control of Arc Welding Dynamic Process, journal of Intelligent and Robotic Systems 36, 191–208.
[2] Suzuki, A., Hardt, D. E., and Valavani, L, 1993 Application of adaptive control theory to on-line GTA weld geometry regulation, ASME J. Dyn. SystemsMeasm. Control 111, 93-103.
[3] Yanling Xu, Huanwei Yu, Jiyong Zhong, Tao Lin, Shanben Chen, 2012. Real-time seam tracking control technology during welding robot GTAW process based on passive vision sensor, Journal of Materials Processing Technology 212 1654– 1662.
[4] S.A.A. Akbari Mousavi, R. Miresmaeili, 2008. Experimental and numerical analyses of residual stress distributions in TIG welding process for 304L stainless steel, Journal of materials processing technology,2 0 8, 383–394.
[5] Hussain Zuhailawati, Muhammad Afiq Jamaluddin, Anasyida Abu Seman, Suhaina Ismail, 2017 .Welding Investigation and Prediction of Tensile Strength of 304 Stainless Steel Sheet Metal Joint by Response Surface Methodology Procedia Chemistry,19 ,217 – 22. [6] Antony J. 2003. Design of experiments for engineers and scientists.
Oxford: Heinemann.
[7] Nikhil Kumar, Manidipto Mukherjee, AsishBandyopadhyay,2008. Comparative study of pulsed Nd: YAG laser welding of AISI 304 and AISI 316 stainless steels, Optics &Laser Technology 88,24–39 [8] Montgomery DC. 2009. Introduction to statistical quality control.
6rd ed. Jefferson, John Wiley & Sons.