R E S E A R C H
Open Access
Heterochronic evolution reveals modular timing
changes in budding yeast transcriptomes
Daniel F Simola
1, Chantal Francis
1, Paul D Sniegowski
1, Junhyong Kim
1,2*Abstract
Background:Gene expression is a dynamic trait, and the evolution of gene regulation can dramatically alter the timing of gene expression without greatly affecting mean expression levels. Moreover, modules of co-regulated genes may exhibit coordinated shifts in expression timing patterns during evolutionary divergence. Here, we examined transcriptome evolution in the dynamical context of the budding yeast cell-division cycle, to investigate the extent of divergence in expression timing and the regulatory architecture underlying timing evolution.
Results:Using a custom microarray platform, we obtained 378 measurements for 6,263 genes over 18 timepoints
of the cell-division cycle in nine strains ofS. cerevisiaeand one strain ofS.paradoxus. Most genes show significant divergence in expression dynamics at all scales of transcriptome organization, suggesting broad potential for timing changes. A model test comparing expression level evolution versus timing evolution revealed a better fit with timing evolution for 82% of genes. Analysis of shared patterns of timing evolution suggests the existence of seven dynamically-autonomous modules, each of which shows coherent evolutionary timing changes. Analysis of transcription factors associated with these gene modules suggests a modular pleiotropic source of divergence in expression timing.
Conclusions:We propose that transcriptome evolution may generally entail changes in timing (heterochrony)
rather than changes in levels (heterometry) of expression. Evolution of gene expression dynamics may involve modular changes in timing control mediated by module-specific transcription factors. We hypothesize that genome-wide gene regulation may utilize a general architecture comprised of multiple semi-autonomous event timelines, whose superposition could produce combinatorial complexity in timing control patterns.
Background
Recent evolutionary studies using natural and inbred
Drosophila and C. eleganslines have shown that gen-ome-wide gene expression levels are much more con-served in nature than expected compared to independent measurements of mutational input [1-3], supporting the hypothesis that transcriptome evolution is characterized by stabilizing selection. These observa-tions suggest that organisms show limited evolutionary divergence in gene expression via changes in gene regu-lation, either by qualitative changes in the connectivity of regulatory interactions or by quantitative changes in the strength of regulatory interactions. In addition, since the architecture of gene regulation involves highly
connected and hierarchical cascades of control [4-7], regulatory change may be limited due to the broad potential for negative pleiotropic consequences [8]. Given this evidence for deleterious changes in gene reg-ulation, how do organisms acquire transcriptome divergence?
Many studies have addressed this question by investi-gating the relationship between gene expression diver-gence and different kinds of genomic variation. Studies focusing on the regulatory effects of single nucleotide mutations have revealed that expression divergence gen-erally associates withcisvariation within species [9-13] and withtrans variation between species [14-18]. Other studies have focused on larger, structural mutations, such as mobile element transposition or non-homolo-gous recombination [19-21]. While these studies have discovered many important links between genomic var-iation and expression divergence, few studies have * Correspondence: [email protected]
1
Department of Biology, University of Pennsylvania, 433 S. University Ave., Philadelphia, PA 19104, USA
Full list of author information is available at the end of the article
directly observed how genomic variation affects the qua-litative structure or quantitative dynamics of an organ-ism’s genome-wide regulatory network. Notably, genome-wide binding patterns of six transcription fac-tors were recently compared between two Drosophila
species during embryonic development [22], revealing a dominant signature of quantitative, rather than qualita-tive changes in TF-DNA regulatory interactions.
One possible avenue for transcriptome divergence that remains consistent with the evidence of stabilizing selec-tion on genome-wide gene expression levels and evolu-tionary conservation of gene regulatory network topology is that divergence might occur via changes in the timing of gene expression. Gene expression is both a quantitative trait and a dynamic trait, such that the timing of gene expression is regulated by a complex, polygenic combination of factors [5,23-26]. Evolutionary modifications to gene regulation have the potential to dramatically alter gene expression timing without greatly affecting mean expression levels [27,28]. Moreover, changes in the timing of regulatory factor expression could induce temporal shifts in the expression trajec-tories of some genes relative to others (heterochrony) [29,30] without disrupting functional relationships.
In this study, we investigated the evolution of gen-ome-wide gene expression as a dynamical system, to evaluate the pattern of divergence in expression timing, the mode of time-dependent transcriptome evolution, and the genome-wide architecture of timing control. We performed a large number of analyses and experiments that follow multiple inference pathways, as diagrammed in Figure S1 in Additional file 1. To overview our results and conclusions, we propose that our data and analyses support the following hypotheses: (1) while the vast majority of genes have bounded expression levels con-sistent with stabilizing selection, most expression trajec-tories show significant heterochronic divergence among strains; (2) the pattern of transcriptome divergence involves time-dependent changes in the magnitude, direction, and degrees of freedom of among-strain cov-ariation; (3) genome-wide gene regulation utilizes a gen-eral architecture for transcriptome timing control comprised of distinct, coherent, and dynamically-auton-omous modules; (4) population-level transcriptome divergence may predominantly result from quantitative changes in the expression dynamics of module-specific trans-regulatory factors rather than qualitative changes in the structure of genome-wide gene regulation; (5) an architecture involving modular timing control could generate complex patterns of heterochronic divergence combinatorially, while alleviating global negative pleio-tropic effects associated with changes in regulatory interactions or changes in the expression of trans-regu-latory factors.
Results
We assayed genome-wide gene expression (transcrip-tome) levels throughout the mitotic cell-division cycle (CDC) of ten natural budding yeast lines, including eight woodland and one laboratory strain ofS. cerevisiae
and one outgroup of S. paradoxus, in a comparative experimental design that involves technical, but not bio-logical replicates of each timepoint (see Materials and methods). To calibrate the variation in gene expression across these lines with an expectation from mutation-drift, we also measured transcriptomes for 23 mutation accumulation (MA) lines. Normalizing and processing our data yielded expression levels for 6,263 genes at 18 sampled CDC-timepoints for the natural lines and unsynchronized expression for the MA lines. We vali-dated our array measurements by comparison with pre-viously published CDC-dependent temporal expression data (Figure S32 in Additional file 1) and with RNA sequencing data produced using the ABI SOLiD 3 plat-form (Figure S33 in Additional file 1). Our expression data show significant consistency both with previous CDC expression data and with quantification of RNA sequencing data.
Genome-wide expression levels show much less variability than expected, but CDC-temporal expression patterns display broad divergence
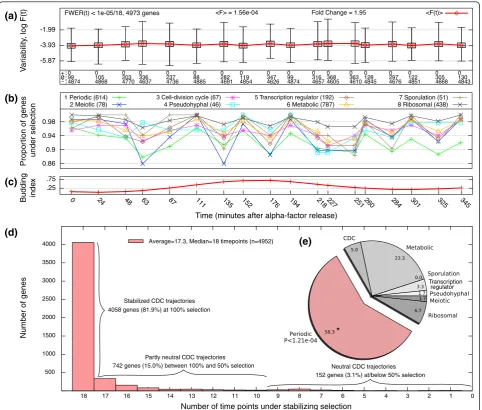
To assess the natural variability in genome-wide gene expression levels, we computedF-statistics at each time-pointtfor 4,973 genesgexhibiting significant mutational variance [2] (see Supplemental materials and methods in Additional file 1). EachF-statistic is defined as the ratio of natural (Vn) to mutational (Vm) variances withinS. cer-evisiae, scaled by the divergence times of the natural and MA lines (in generations) and degrees of freedom:
F g t V g t
V g
n
m
, ,
( ) .
( )
=( )
×× ×
600 8 34 10
22 8
6 . F-values thus
represent estimates per-generation natural variation in gene expression calibrated by neutral mutational varia-tion. The genome-wide CDC medianF-value is 1.56 × 10⁻⁴ (cf. [31]), indicating that variation among natural strains is roughly 104-fold smaller than expected under mutation-drift equilibrium. (The median scaled natural and mutational variances are 2.40 × 10⁻⁸and 1.54 × 10
-4
gene expression levels are under stabilizing selection. Moreover, the majority of genes (81.9%) exhibit expres-sion trajectories consistent with complete stabilizing selection at every timepoint, while 742 genes (15.0%) exhibit low variability in at least half of the timepoints (partly neutral genes) and only 152 genes (3.1%) exhibit neutral variability in at least half of the timepoints (neu-tral genes) (Figure 1D, Table S2 in Additional file 1). No single trajectory appears to diverge completely neutrally. Thus, when analyzed in terms of gene expression levels only without considering the effect of CDC-dynamics,
the overall pattern of our data is consistent with pre-vious hypotheses that the expression levels of most genes are under strong stabilizing selection.
One might suspect that the broad lack of expression divergence among strains may be due to a general defi-ciency of CDC-temporal variation for many of the genes. To test this, we partitioned S. cerevisiae expres-sion variation into relative contributions from strain and temporal effects using a linear mixed model analysis. 3,750 genes (59.9%) exhibit significant effects (FDR < 0.1 over all 6,251 × 2 hypotheses): 2,797 genes (46.6%) show (a)
(b)
(c)
(d)
500 1000 1500 2000 2500 3000 3500 4000
0 1 2 3 4 5 6 7 8 9 10 11 12 13 14 15 16 17 18
Number of time points under stabilizing selection
152 genes (3.1%) at/below 50% selection 4058 genes (81.9%) at 100% selection
742 genes (15.0%) between 100% and 50% selection Stabilized CDC trajectories
Neutral CDC trajectories Partly neutral CDC trajectories
(e)
Number of genes *
5 Transcription regulator (192) 3 Cell-division cycle (67)
Transcription regulator Average=17.3, Median=18 timepoints (n=4952)
Propor
tion of genes
under selection
Budding inde
x
V
ar
iability
[image:3.595.58.541.88.498.2], log F(t)
significant strain variation (that is, divergence), 2,596 genes (43.3%) show significant temporal variation, and 1,643 genes (26.2%) show both effects. Averaging over these 1,643 genes, strain effects explain 39% and tem-poral effects explain 23% of the total variance in gene expression; combining these marginal effects explains 50%-90% of each gene’s total variance. Strain and tem-poral variances show significant but mild correlation (R= 0.25,P < 10-10; Figure S2 in Additional file 1), and temporal effects contribute 104-fold more to overall expression variation compared to strain effects when scaled by divergence time (genome-wide medians
time2 =9 54 10. × −4vs.strain2 =7 43 10. × −8). Thus,
con-siderable temporal variation in CDC-expression is pre-sent in the yeast transcriptome (see also Figure S3 in Additional file 1).
To relate evolutionary forces to yeast gene function, we computed the proportion of genes under stabilizing selection for eight broad life-cycle terms and 88 GO Slim terms over time,Qj(t), wherejindexes each term. The Qjprofiles of most terms appear qualitatively simi-lar (Figure S4 in Additional file 1), and a comparison of average Qj values for life-cycle terms reveals that peri-odic, meiotic, and CDC-specific genes (in that order) are the most neutral (Figure 1B). In particular, a significant number of neutral genes are periodically expressed (Fisher’s Exact test, FDR < 0.05; Figure 1E). Of the 88 GO Slim terms, only 5 terms have averageQjvalues less than 0.94 (the 95th percentile overQj; Table S3 in Addi-tional file 1): helicase activity (0.76), extracellular region (0.86), cell wall (0.91), cellular component (0.92), and pseudohyphal growth (0.93). Of these, cell wall and extracellular region terms are enriched among the 1,643 genes with significant strain and time effects (FDR < 0.05). Thus, while it is not clear whether there is a func-tional aspect to expression divergence in temporal tra-jectories, among genes with the most strain divergence, specific functional categories are enriched within the set of temporally variable genes.
A hierarchical clustering of the entire CDC-tran-scriptome data set shows a complex inter-relationship among strains and timepoints, such that no strain’s entire CDC-temporal expression and no timepoint’s entire strain expression form a single clade (Figure S5 in Additional file 1); however, different timepoints from the same strain tend to be more similar than the same timepoints from different strains, indicating a general pattern of strain divergence. Notably, 17 of 18 timepoints for ourS. paradoxus strain (YPS3395) clus-ter as a single clade, indicating their general distinction from S. cerevisiaeexpression. Yet only 457 genes (7.5% of the genome) show significant differential expression between S. paradoxus and the 8 woodlandS. cerevisiae
lines (t-test, FWER < 0.1), and no gene shows greater than a three-fold change in expression level. Surpris-ingly, the S. cerevisiae laboratory strain exhibits the most divergent dynamic expression profile in this clus-tering, beyond the S.paradoxus outgroup, despite hav-ing only 248 genes (4%) that are differentially expressed compared to woodland strains (FWER < 0.1) with a maximum fold change of 4.2. Thus, compared to S. paradoxus, the laboratory S. cerevisiae strain shows only slightly greater expression level divergence from woodland strains but for fewer genes, yet it shows a more distinct pattern of temporal divergence. One possibility is that the laboratory strain’s CDC molecular physiology has become adapted to labora-tory growth conditions [32], which is manifest in its CDC-transcriptome dynamics. Overall, these results indicate that while levels of expression show limited among-strain and between-species divergence, the dynamic pattern of expression displays significant temporal fluctuations, with broad among-strain and between-species divergence.
Divergence in CDC-temporal coexpression patterns is found at all scales of transcriptome organization
To evaluate the quantitative divergence in CDC-tem-poral expression following the qualitative patterns revealed by clustering analysis above, we first generated a 6,082 × 6,082 gene coexpression matrix for each strain by computing pairwise correlations between all CDC-temporal gene expression profiles and then calculated matrix correlation coefficients between coexpression matrices for all pairs of strains (Figure S6A in Addi-tional file 1). Due to the extreme size of the matrices, all comparisons yield significant concordance in coexpres-sion patterns (FDR < 0.01), but the degree of concor-dance is low (avg.R= 0.11), indicating most strains lack strong similarity in CDC-coexpression (that is, similar pairwise relationships between genes). Restricting these coexpression matrices to a subset of 266 transcriptional regulatory genes does not strengthen this pattern of weak association (avg. R = 0.12; Figure S6B in Addi-tional file 1). Controls using replicated and simulated microarray data confirm this pattern (Text S1). As may be expected, S. paradoxushas the lowest coexpression correlation with other strains (avg.R= 0.047); however,
considerable divergence in the genome-wide pattern of temporal coexpression.
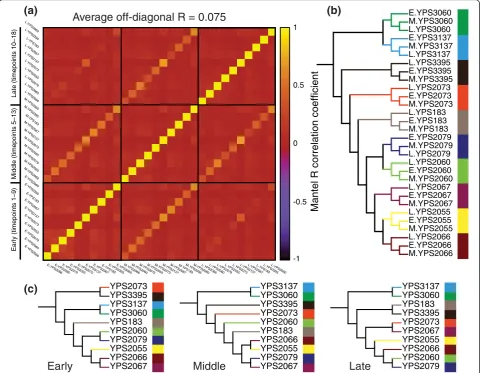
To assess coexpression divergence in a time-specific manner, we grouped each strain’s expression data into three overlapping CDC-phase groups (first, middle, and last nine timepoints). We first assessed coexpression matrix similarity between strains and between CDC-phase groups. This recapitulated the pattern of weak association between strains (R = 0.075; Figure 2A). Coexpression matrices consistently cluster by strain (Figure 2B), but cluster relationships between strains are unique to each CDC-phase group (Figure 2C). We also identified phase-directions of temporal covariation using a singular value decomposition (SVD) of each strain’s expression data for each of the three CDC-phase groups.
Within each group, the angular distance of major phase-directions between strains averages 75.8°, close to the maximum of 90° (Figure S7A in Additional file 1). Mul-tidimensional scaling (Figure S7C in Additional file 1) and hierarchical clustering (Figure S7D in Additional file 1) indicate that similarity relationships between strains are phase-specific. These results indicate that the genome-wide pattern of coexpression divergence is time-dependent. Since coexpression divergence may occur at different scales of transcriptome organization, we also assessed the pattern of modular temporal coexpression. We defined a coexpressionk-module for every gene as itsk
most correlated genes within each strain. We assessed divergence in modular coexpression by computing the overlap of each gene’sk-modules between strains and
1
0 0.5
-0.5
-1
Mantel R correlation coefficient
Late (timepoints 10–18)
Middle (timepoints 5–13)
Ear
ly (timepoints 1–9)
(a)
(b)
Early
Middle
Late
(c)
E.YPS3060 M.YPS3060 L.YPS3060 E.YPS3137 M.YPS3137 L.YPS3137 L.YPS3395 E.YPS3395 M.YPS3395 L.YPS2073 E.YPS2073 M.YPS2073 L.YPS183 E.YPS183 M.YPS183 E.YPS2079 M.YPS2079 L.YPS2079 L.YPS2060 E.YPS2060 M.YPS2060
L.YPS2055 E.YPS2055 M.YPS2055 L.YPS2066 E.YPS2066 M.YPS2066 L.YPS2067 E.YPS2067 M.YPS2067
YPS3137 YPS3060 YPS3395 YPS2073 YPS2060 YPS183 YPS2066 YPS2055 YPS2079 YPS2067 YPS2073
YPS3395 YPS3137 YPS3060 YPS183 YPS2060 YPS2079 YPS2055 YPS2066 YPS2067
YPS183 YPS3395 YPS2073 YPS2067 YPS2055 YPS2066 YPS2060 YPS2079 YPS3137 YPS3060
[image:5.595.58.541.290.663.2]Average off-diagonal R = 0.075
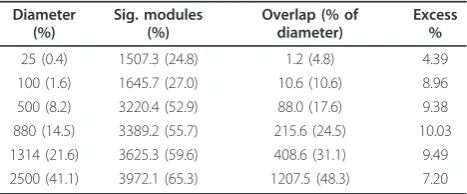
determining the degree of excess overlap compared to random expectation among significant genes. Less than two-thirds of genes exhibit significant overlap at any scale (from 25% atk= 25 to 65% atk= 2,500, averaging over all strain pairs,P < 1/250), suggesting that patterns of shared temporal coexpression cannot be identified for a large portion of the genome. While the average over-lap among significant genes is consistently greater than expected by chance (Figure S8 in Additional file 1), the excess is generally low, averaging 8.24% with a mini-mum of 4.39% atk= 25 and maximum of 10.03% at k= 880 genes (Table 1). Thus, similar to the matrix correla-tion results, the pattern of modular coexpression shows low concordance between strains regardless of scale. Moreover, there is lower overlap at smaller scales, sug-gesting that temporal coexpression diverges more rapidly for genes that are more tightly coexpressed within a genome. To determine whether relationships of modular coexpression between strains change across organizational scales, we computed hierarchical cluster-ings of the 10 × 10 matrices of average module overlap between strains (Figure S9 in Additional file 1). A few strains, notably YPS3137 and YPS2073, show changes in overlap relationships across scales, suggesting that these strains differ in temporal coexpression at all scales of transcriptome organization. Thus, divergence in CDC-temporal coexpression is found genome-wide, in a time-dependent manner, and at all scales of transcriptome organization.
CDC regulatory architecture exhibits time-dependent changes in multi-dimensional complexity
The gene-oriented analyses above indicate surprisingly large divergence in CDC-temporal expression,
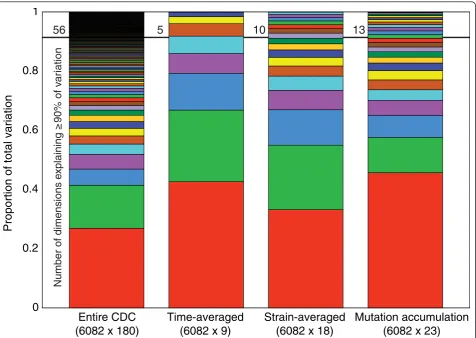
suggesting a broad potential for evolutionary divergence of expression dynamics despite stabilizing selection on expressionlevels. Changes in expression dynamics imply changes in the timing patterns of genome-wide gene regulation. To dissect the architecture of time-depen-dent gene regulation that underlies the observed pattern of transcriptome divergence, we analyzed multivariate (multi-genic) patterns of expression covariation among theS. cerevisiae lines, including time-dependent multi-variate patterns. We first performed a canonical correla-tion analysis using genome-wide expression grouped by timepoint and found that expression can be correlated nearly perfectly between all pairs of timepoints using primary canonical variables (R ≈ 1.0, FWER < 0.05). This indicates that genome-wide expression at each timepoint shares the same sub-space (that is, funda-mental directions of variation); however, particular directions of major variation may differ across time-points. We next assessed the degrees of freedom of expression variation among strains by analyzing the covariation at each timepoint independently, using latent factor mixed model analysis (LFA) and principal component analysis (PCA). Compared to patterns seen in the mutation accumulation lines, natural time-speci-fic covariation exhibits greater overall regulatory com-plexity, averaging 4.6 vs. 2 factors by LFA (Table S4 in Additional file 1), and restricted degrees of freedom of covariation, averaging 6.1 vs. 13 dimensions by PCA (Figure S13A in Additional file 1), at each timepoint. Combining all timepoints and strains, a total of 56 dimensions are required to explain 90% of the covaria-tion in the natural strain CDC data (Figure 3). Surpris-ingly, these degrees of freedom do not simply separate into time and strain components: if each strain’s expres-sion is time-averaged, only five PCA factors explain the resulting among-line covariation; if each timepoint’s expression is strain-averaged, ten factors explain the among-timepoint covariation. Thus, a much greater complexity of expression divergence is revealed when both CDC-temporal and strain covariation are taken into account.
Both LFA and PCA results strongly suggest the pre-sence of differential constraints on transcriptome diver-gence as a function of CDC progression. We examined this by asking whether yeast strain covariance structure changes between different timepoints. We applied a SVD to the expression data at each timepoint for allS. cerevisiaestrains, obtaining r= 9 multivariate directions of strain divergenceUr
(t) for each of the 18 timepoints
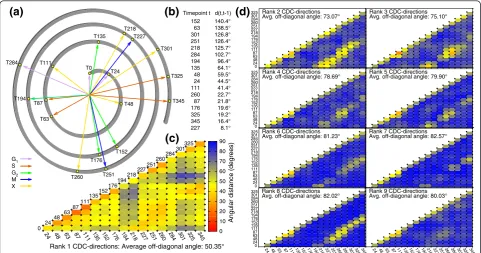
[image:6.595.57.291.540.637.2]t [33] (see Supplemental materials and methods). We call these CDC-directions, which might reflect develop-mental constraints, mutational biases, or directions of selection (or combinations thereof), for example. We first computed angular distance between the major
Table 1 Strain divergence in modular coexpression structure
Diameter (%)
Sig. modules (%)
Overlap (% of diameter)
Excess %
25 (0.4) 1507.3 (24.8) 1.2 (4.8) 4.39
100 (1.6) 1645.7 (27.0) 10.6 (10.6) 8.96
500 (8.2) 3220.4 (52.9) 88.0 (17.6) 9.38
880 (14.5) 3389.2 (55.7) 215.6 (24.5) 10.03 1314 (21.6) 3625.3 (59.6) 408.6 (31.1) 9.49 2500 (41.1) 3972.1 (65.3) 1207.5 (48.3) 7.20
CDC-directions for all timepoint pairs (∠U1 (s)U1 (t); Figure 4C). Adjacent timepoints as well as those in phase between cell-division cycles appear more similar than other timepoints, indicating that changes in covar-iance structure are both gradual and cyclic. Despite these similarities, angles average 50.4° and range from 19.4° to 88.9°. A random angles test failed to identify any significantly small angles (that is, significantly simi-lar directions), even with a lenient cutoff (FWER < 0.15). Visualization of the major CDC-direction distance matrix by multidimensional scaling reiterates this pat-tern (Figure 4A). These results suggest that most major CDC-directions are distinct. Similar testing of each of the eight minor CDC-directions (Figure 4D) identified only eight significantly small angles out of 1,072 com-parisons. Common principal component analysis of time-dependent covariation [34] revealed broadly consis-tent results (Text S2). Thus, we observe significant changes in the yeast transcriptome covariance structure across strains throughout the CDC.
To assess whether the CDC-directions correspond to biologically relevant axes of covariation, we identified the genes contributing the most to strain covariation in each major CDC-direction by correlation and deter-mined the functional terms enriched among the top 5% of genes (Tables S6, S7 in Additional file 1). Significant terms vary by timepoint and include metabolic, periodic, ribosomal, and CDC life-cycle terms (FDR < 0.05). In addition, TATA regulatory motifs have been hypothe-sized to drive expression divergence via neutral drift [31]. We found that TATA-associated genes project onto major CDC-directions 4-fold less than genes lack-ing TATA motifs, which are over-represented among the top 5% of genes (P < 0.01, Table S8 in Additional file 1). Also, few of the 152 genes with neutral CDC-expression are found among the top 5% (P< 10-5). This paucity of genes hypothesized to diverge neutrally argues against drift as a major force in strain diversifica-tion of CDC-direcdiversifica-tions. We also tested whether the major CDC-directions (of within-species covariation) are
0
0.2
0.4
0.6
0.8
1
Entire CDC
(6082 x 180)
Time-averaged
(6082 x 9)
Strain-averaged
(6082 x 18)
Mutation accumulation
(6082 x 23)
Proportion of total variation
Number of dimensions
e
xplaining ≥
90% of v
ar
iation
[image:7.595.62.539.88.426.2]56
5
10
13
predictive of directions of between-species divergence, as might be expected for neutral species divergence [35]. For each timepoint we calculated angular distance between the major S. cerevisiae CDC-direction and the displacement vector ofS. paradoxusexpression, oriented withinS. cerevisiaeCDC-space (for example, Figure S14 in Additional file 1). All angles exceed 45°, and no angle is significantly small (FWER < 0.15). Thus, within-species covariation does not predict the direction of between species divergence. However, release from
a-factor, S-phase, and the G2/M transition have the
smallest angles, suggesting that response to mating pheromone and DNA replication dynamics may be more constrained in evolutionary covariation.
We next evaluated whether the amount of variation projected onto the multivariate CDC-directions reveals a different, non-stabilizing pattern of selection compared to the pattern for individual genes. We computedF -sta-tistics by comparing natural and mutational among-line expression variances projected onto each timepoint’s CDC-directions. Although the average F -value over major CDC-directionsU1(t) is 14.6-fold larger than the genome-wide average F -value (2.28 × 10⁻³ vs. 1.56 × 10⁻⁴,P = 1.5 × 10⁻⁴), allF -values remain significantly low, including those calculated for minor
CDC-directions (FWER < 0.05). Therefore, multivariate pat-terns of transcriptome divergence are also consistent with stabilizing selection. However, the temporal profile of major multivariateF-values, unlike that for individual genes, exhibits peaks in expression variability (87, 176, 260, and 345 min.; Figure S15 in Additional file 1); the average peak is 1.4-fold greater than that at all other timepoints (P = 0.018) and 19.1-fold greater than the genome-wide average (P = 0.006). Intriguingly, these peaks in expression variability are preceded by large changes in the major axis of CDC-covariation (63, 152, 251, and 301 min.), occur just prior to CDC-phase tran-sitions (97, 218, 267, and approximately 350 min.), and coincide with drops in regulatory complexity (latent fac-tors; 176, 260, 345 min.) (Table S4 in Additional file 1; see also Figure 4B). In addition, reductions in regulatory complexity generally coincide with the CDC-phase tran-sitions G1/S, G2/M, and M/G1 (48, 218, 260, 301 min.;
except S/G2 at 111 min.), suggesting greater constraint
on gene regulation through the influence of CDC check-points. Thus, temporal fluctuations in strain variability might reflect multi-genic pleiotropic effects being chan-neled to varying dimensions and directions of gene expression through a regulatory architecture that changes dynamically across CDC-phases [7].
(a)
(c)
G1 S G2 M XRank 1 CDC-directions: Average off-diagonal angle: 50.35°
Angular distance (degrees)
0 10 20 30 40 50 60 70 80 90
24 48 63 87 111 135 152 176 194 218 227 251 260 284 301 325 345 0
24 48 63 87
111135 152176 194 218227 251 260284 301325
(b)
Timepoint t d(t,t-1) 152 140.4° 63 138.5° 301 126.8° 251 126.4° 218 125.7° 284 102.7° 194 96.4° 135 64.1° 48 59.5° 24 44.5° 111 41.4° 260 22.7° 87 21.8° 176 19.6° 325 19.2° 345 16.4° 227 8.1°Rank 8 CDC-directions
Avg. off-diagonal angle: 82.02° Rank 9 CDC-directionsAvg. off-diagonal angle: 80.03°
24 48 63 87 111 13
5152176194218227251 260284301 325345 24 48 63 87 111 135152176194218227251 260284301 325345
Rank 2 CDC-directions
Avg. off-diagonal angle: 73.07° Rank 3 CDC-directionsAvg. off-diagonal angle: 75.10°
Rank 4 CDC-directions
Avg. off-diagonal angle: 78.69° Rank 5 CDC-directionsAvg. off-diagonal angle: 79.90°
Rank 6 CDC-directions
Avg. off-diagonal angle: 81.23° Rank 7 CDC-directionsAvg. off-diagonal angle: 82.57°
[image:8.595.57.539.89.342.2]0 24 48 63 87 111 135 152 176 194 218 227 251 260 284 301 325 0 24 48 63 87 111 135 152 176 194 218 227 251 260 284 301 325 0 24 48 63 87 111 135 152 176 194 218 227 251 260 284 301 325 0 24 48 63 87 111 135 152 176 194 218 227 251 260 284 301 325
(d)
Heterochronic changes in expression timing explain strain divergence for the majority of yeast genes
Our multivariate analysis of the architecture of genome-wide gene regulation argues that the broad pattern of CDC-transcriptome divergence among yeast strains is heavily influenced by dynamical changes in control. However, if this architecture of timing control involves a global cascade of regulation, any changes in control could cause broad negative pleiotropic effects through-out the CDC [8]. Given our findings of strong stabilizing selection on both univariate and multivariate strain var-iation across the CDC, such a global, hierarchical archi-tecture seems unlikely. Alternatively, this archiarchi-tecture may be organized into discrete modules of regulation that exhibit dynamically-autonomous timing control [36]. Moreover, superposition of regulatory timing patterns from different modules could combinatorially generate the regulatory complexity required for
transcriptome-wide timing control while minimizing negative pleiotropic effects.
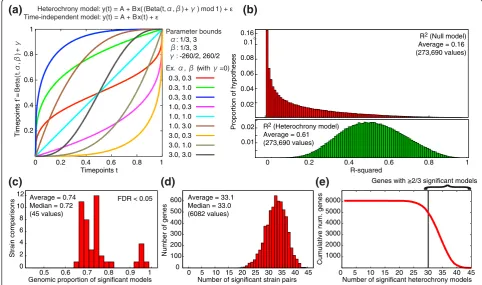
We evaluated this hypothesis of modular timing con-trol by identifying genes that share patterns of expres-sion heterochrony (evolutionary shifts in expresexpres-sion timing compared to the CDC) [27,37,38], which can be used to delineate dissociable units of structure and func-tion [29,39]. Briefly, we reasoned that if two genes are coregulated, their temporal expression trajectories might show similar evolutionary shifts in timing between strains and species, despite overt differences in the expression trajectories themselves. We tested for the presence of heterochrony in the yeast cell-division cycle by asking whether a time transformation (that is, hetero-chrony) model significantly explains a gene’s divergence in temporal expression between two strains (Figure 5A). On average, our heterochrony model explains 61% of between-strain transcriptome variation (Figure 5B).
1 0.8 0.6 0.4 0.2
0 0 0.2 0.4 0.6 0.8 1
Timepoints t R-squared
Average = 0.74 Median = 0.72 (45 values)
Average = 33.1 Median = 33.0 (6082 values)
Cumulative num. genes
Number of genes
Strain comparisons
Number of significant heterochrony models Number of significant strain pairs
Genomic proportion of significant models
0.3, 0.3 0.3, 1.0 0.3, 3.0 1.0, 0.3 1.0, 1.0 1.0, 3.0 3.0, 0.3 3.0, 1.0 3.0, 3.0
Timepoints t’
=
Beta
(t,
α
,
β
)+
γ
Ex. α, β (with γ=0) α: 1/3, 3
β: 1/3, 3
γ: -260/2, 260/2
Parameter bounds
1
0.8
0.6
0.4
0.2
(b)
Proportion of hypotheses
R2 (Null model)
Average = 0.16 (273,690 values)
0.01 0.02 0.02 0.04 0.06 0.08 0.1 0.16
//
R2 (Heterochrony model)
Average = 0.61 (273,690 values)
Heterochrony model: y(t) = A + Bx( (Beta(t,α,β) + γ) mod 1) + ε
Time-independent model: y(t) = A + Bx(t) + ε
(d)
(c)
(e)
(a)
Genes with ≥2/3 significant models
0 2 4 6 8 10 12
0.5 0.6 0.7 0.8 0.9 1 0
100 200 300 400 500 600
0 5 10 15 20 25 30 35 40 45
1000 2000 3000 4000 5000 6000
0 5 10 15 20 25 30 35 40 45
}
[image:9.595.55.538.319.604.2]FDR < 0.05
Figure 5The heterochrony model of time-dependent changes in gene expression trajectories between strains. The model was fit to single period, Z-standardized CDC-expression data for a single gene measured in two strains.(a)Formulation of the time-independent (null) and heterochrony regression models. The heterochrony model estimates a timepoint mapping between strains using the Beta cumulative
distribution function, which generates smooth and invertible transformations on [0, 1] according to parametersaand.b. This model also allows translation of expression trajectories using the phase parameterg. Transformed timepoints were modulated around 1, so that transformations are defined with respect to a single cell-division cycle. Estimates ofa,b, andgwere bounded within [1/3, 3], [1/3, 3], and [-260/2, 260/2],
We then computed a likelihood-ratio statistic for every gene by comparing the fit of the heterochrony model to the fit of a time-independent model. 64%-96% of genes show a significant time effect for any between-strain comparison (d.f.1, 3 and 14, FDR < 0.05; Figure 5C), indicating a broad pattern of heterochronic divergence. Each gene exhibits significant fit to the heterochrony
model for an average of 33.1 of the 10
2 45
⎛ ⎝
⎜ ⎞
⎠
⎟ = pairwise
comparisons (Figure 5D). We retained 4998 genes show-ing consistent support for heterochrony (≥ 2/3 signifi-cant comparisons; Figure 5E) for the analysis of shared patterns of heterochrony. As expected, these genes tend to exhibit large dynamical fluctuations in expression level across the CDC: 85.8% belong to the set of 2,596 genes with significant temporal variation (P< 10-10). At least 85% of the top 1,000 periodically expressed genes in our data set show significant heterochrony (Figure S16 in Additional file 1). In addition, functional analysis reveals significant enrichment for a variety of GO Slim terms (Text S3). These results suggest that the major mode of transcriptome divergence in the yeast CDC entails changes in timing (heterochrony) rather than changes in levels (heterometry) of expression.
Shared patterns of heterochrony reveal modular timing changes
We identified shared patterns of heterochrony among the 4,998 heterochronic genes by comparing their tim-ing change curves (defined by the heterochrony model parameter estimates; Figure S17 in Additional file 1), such that two genes are similar if their timing change curves are concordant across the entire CDC (Figure S19 in Additional file 1). In this way we computed a dis-tance matrix that characterizes the timing pattern rela-tionships between all pairs of genes (Text S4). Clustering genes by their timing pattern relationships revealed seven significant timing modules, consistent with the hypothesis of modular timing control (Text S5). To identify the genes significantly associated with each timing module, we performed a pairwise analysis by counting the number of between-strain comparisons (out of 45) in which two genes exhibit the same pattern of timing change. We identified 5,393 significant inter-actions connecting 3,715 genes (binomial,P < 10-4; see Additional file 2); 47.2% of the significant interactions connect genes within the same timing module. Genes sharing significant interactions display an average simi-larity of 0.46, compared to the genome-wide average similarity of 0.19 (Figure S24 in Additional file 1). Inter-acting genes also share functional ontology terms, on average sharing 95% of possible life-cycle terms (P < 10-7) and 23% of possible GO Slim terms (P < 10-19),
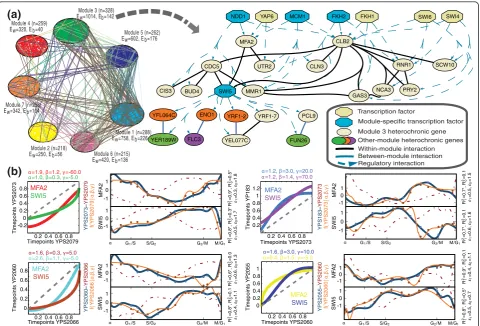
consistent with a functional interpretation for diver-gence in expression timing. We partitioned genes shar-ing significant heterochronic interactions into two groups: 1,828 genes showing a majority of interactions within an individual timing module (module-specific genes), and 1,887 genes showing a majority of interac-tions across timing modules (between-module genes). Among these 3,715 genes, within-module interactions are found 5.6-fold more often than between-module interactions (P < 10-10), indicating that module-specific genes comprise the inter-connected core of each timing module (Figure 6A). Functional enrichment of timing modules reveals five life-cycle terms and 21 GO Slim terms associated with four of the seven timing modules (Table S10 in Additional file 1), whereas analysis of between-module genes revealed no significantly enriched terms (FDR < 0.1). Thus, analysis of shared patterns of heterochrony reveals significant modular organization in the timing patterns of genome-wide gene expression and suggestive evidence that these modules are asso-ciated with cellular function.
Modular timing changes reflect coherent and dynamically-autonomous timing control
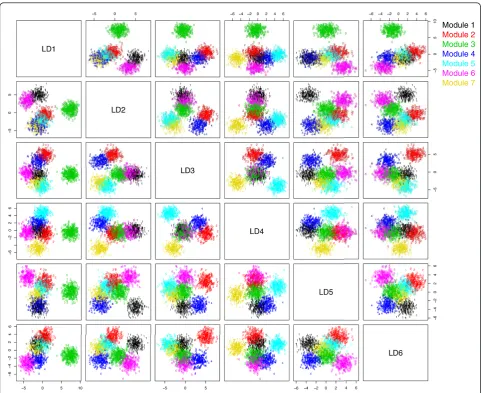
this coherence of timing patterns within modules despite differences between modules (Figure 7). These results sug-gest that divergence in timing patterns may increase more quickly between modules than within modules, consistent with the representation of modules as distinct units of timing control.
Furthermore, robustness of the yeast CDC against genetic [40], environmental [41], and dynamical pertur-bations [42] suggests the possibility that timing pattern variability both within and between modules might be limited by a form of negative selection, potentially cana-lizing selection [43-45], which could reinforce the coher-ence of modules as integrated developmental processes. Consistent with this, module-specific genes as a group show significantly low variation for timing change curves across strain comparisons (P = 0.0002), and
when separated by module, their strain variation corre-lates with each module’s estimated coherence (Spear-man’s r = -0.94, P = 0.0009). This suggests a relationship between within-module variability and among-strain variability in timing patterns (Text S7). In addition, variability among all timing patterns is also lower than expected and is time-dependent, suggesting the possibility of system-wide coordination and periodic synchronization of modular timing patterns (Text S8 and Figure S27 in Additional file 1). These results sug-gest that the CDC timing control architecture is com-prised of a core of distinct, coherent, and dynamically-autonomous modules involving nearly 30% of the gen-ome, combined with a layer of interactions between modules, which may potentially coordinate or synchro-nize expression timing globally.
Timepoints YP2055
Timepoints YPS2060 MFA2
SWI5 α=1.6,β=3.0,γ=10.0
α=0.4,β=1.5,γ=-5.0
Timepoints YP183
Timepoints YPS2073
MFA2 SWI5 α=1.2,β=3.0,γ=20.0
α=1.2,β=1.4,γ=70.0
Timepoints YPS2066
Timepoints YP2060
α=1.6,β=0.3,γ=5.0
α=1.9,β=1.2,γ=-60.0 α=1.0,β=0.3,γ=-5.0
Timepoints YPS2073
Timepoints YPS2079
R
2 1=0.9*,
R
2 0=0.1
ε1
=0.4,
ε0
=1.1
R
2 1=0.8*,
R
2 0=0.5*
ε =0.5, ε0 =0.7 1 R
2 1=0.6*,
R
2 0=0.0
ε1
=0.6,
ε0
=1.3
R
2 1=0.8*,
R
2 0=0.1
ε1
=0.4,
ε0
=1.1
R
2 1=0.7*,
R
2 0=0.1
ε1
=0.5,
ε0
=1.5
R
2 1=0.7*,
R
2 0=0.1
[image:11.595.59.540.88.414.2]ε1 =0.6, ε0 =1.6 -1 0 1 MF A2 YPS2073 – YPS2079 f( YPS2079 | α , β , γ )
α G1/S S/G2 G2/M M/G1
-1 0 1 SWI5 -1 0 1 MF A2 -1 0 1 SWI5 YPS183 – YPS2073 f( YPS2073 | α , β , γ ) -1 0 1 MF A2 -1 0 1 SWI5 YPS2060 – YPS2066 f( YPS2066 | α , β , γ )
α G1/S S/G2 G2/M M/G1
(b)
R
2 1=0.9*,
R
2 0=0.5*
ε1
=0.3,
ε0
=1.8
R
2 1=0.8*,
R
2 0=0.3*
ε1 =0.5, ε0 =1.7 -1 0 1 MF A2 -1 0 1 SWI5
α G1/S S/G2 G2/M M/G1
YPS2055 – YPS2060 f( YPS2060 | α , β , γ )
α G1/S S/G2 G2/M M/G1
MFA2 SWI5 -0.2 0 0.2 0.4 0.6 0.8
0.2 0.4 0.6 0.8
0.2 0.4 0.6 0.8 1 1.2
0.2 0.4 0.6 0.8
α=2.6,β=1.1,γ=-5.0
MFA2 SWI5 0 0.2 0.4 0.6 0.8
0.2 0.4 0.6 0.8
0 0.2 0.4 0.6 0.8 1
0.2 0.4 0.6 0.8
EModule 3 (n=328)w=1014, Eb=142 Module 4 (n=259)
Ew=320, Eb=40 Module 5 (n=262)
Ew=602, Eb=176
Module 7 (n=258) Ew=342, Eb=104
Module 2 (n=218) Ew=250, Eb=56
Module 1 (n=288) Ew=758, Eb=226
Module 6 (n=215) Ew=420, Eb=136
(a)
MFA2 SWI5 UTR2 NDD1 CDC5 BUD4 CLB2 MMR1 CIS3 YRF1-2 ENO1 YFL064C FUN26 YER189W FLC3 YRF1-7 PCL9 YEL077C MCM1 CLN3 FKH2 RNR1 GAS3 SWI4 PRY2 SCW10 SWI6 NCA3 YAP6 FKH1 Transcription factor Regulatory interaction Between-module interaction Within-module interaction Module-specific transcription factorOther-module heterochronic genes Module 3 heterochronic gene
Figure 6The modular architecture of genome-wide timing control.(a, left)Network of significant heterochronic interactions between 1828 module-specific genes, grouped by module. Interactions are defined by strongly correlated changes in expression timing (P< 10-4). (Figure S25
in Additional file 1 shows this graph with greater resolution.)(a, right)Heterochronic interaction network from module 3 (black lines); only a subset of genes within 2 degrees of geneSwi5 and that share TFs is shown (dashed blue arrows). Blue nodes indicate significant association of a TF with a module.(b)Novel interaction betweenSwi5 andMfa2, which co-cluster in 23/45 comparisons (P= 6.8 × 10⁻⁶); four are shown. Timing
maps (columns 1, 3) illustrate timing pattern changes between strains for each gene, given parameters (a,b,g) and Beta CDF:t’= (Beta(a,b) + g) mod 1. Gray dashed lines indicate no change. Trajectory plots for each gene (columns 2, 4) show the time transformation of CDC-expression from one strain (dashed red line) to another (orange line). Blue lines show a gene’s CDC-expression in the respective target strain.
Heterochronic expression of module-specific regulatory factors may explain modular timing changes
While the prevalence of heterochrony is consistent with broad changes in gene coregulation, modularity in the patterns of heterochrony suggests that regulatory archi-tecture itself could effectively constrain multi-genic strain variation into distinct channels of phenotypic expression. In this way, widespread divergence in tran-scriptome dynamics may be explained by predominantly quantitative changes in the expression patterns of mod-ule-specific regulatory factors, rather than qualitative changes in gene coregulation. Using the 1828 module-specific genes, we tested whether strongly shared hetero-chrony implies common transcription factor trans-regu-lation, as one possible mode of module-specific gene regulation. Genes sharing heterochronic interactions
share more TFs than expected (P < 10-100) and associate with TFs more strongly than pairs of genes without strongly shared heterochrony (P< 10-10). The genome-wide pattern of TF-gene trans-regulatory interactions also associates significantly with the segregation of genes into timing modules (P = 0.014). We then sought to identify TFs that associate specifically with each timing module, using 2 × 2 contingency tables to summarize the interactions between each TF and module (Text S9). We identified 37 TFs showing 42 module-specific asso-ciations, averaging six TFs per module (FDR < 0.1); this represents significant association for 59% of the 63 TFs tested (the subset of 117 TFs showing≥ 7 targets [46]). These 37 module-specific TFs themselves exhibit signifi-cant patterns of heterochrony (Table 2; Figure S28 in Additional file 1); as a class, they show more extreme
Module 1 Module 2 Module 3
Module 4
Module 5
[image:12.595.57.541.87.480.2]Module 6 Module 7
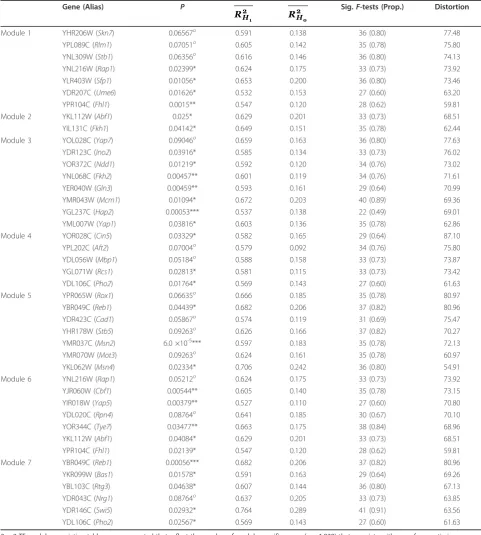
Table 2 Heterochrony in module-specific transcription factors
Gene (Alias) P
RH
1
2 R
H0
2 Sig.F-tests (Prop.) Distortion
Module 1 YHR206W (Skn7) 0.06567o 0.591 0.138 36 (0.80) 77.48
YPL089C (Rlm1) 0.07051o 0.605 0.142 35 (0.78) 75.80
YNL309W (Stb1) 0.06356o 0.616 0.146 36 (0.80) 74.13
YNL216W (Rap1) 0.02399* 0.624 0.175 33 (0.73) 73.92
YLR403W (Sfp1) 0.01056* 0.653 0.200 36 (0.80) 73.46
YDR207C (Ume6) 0.01626* 0.532 0.153 27 (0.60) 63.20
YPR104C (Fhl1) 0.0015** 0.547 0.120 28 (0.62) 59.81
Module 2 YKL112W (Abf1) 0.025* 0.629 0.201 33 (0.73) 68.51
YIL131C (Fkh1) 0.04142* 0.649 0.151 35 (0.78) 62.44
Module 3 YOL028C (Yap7) 0.09046o 0.659 0.163 36 (0.80) 77.63
YDR123C (Ino2) 0.03916* 0.585 0.134 33 (0.73) 76.02
YOR372C (Ndd1) 0.01219* 0.592 0.120 34 (0.76) 73.02
YNL068C (Fkh2) 0.00457** 0.601 0.119 34 (0.76) 71.61
YER040W (Gln3) 0.00459** 0.593 0.161 29 (0.64) 70.99
YMR043W (Mcm1) 0.01094* 0.672 0.203 40 (0.89) 69.36
YGL237C (Hap2) 0.00053*** 0.537 0.138 22 (0.49) 69.01
YML007W (Yap1) 0.03816* 0.603 0.136 35 (0.78) 62.86
Module 4 YOR028C (Cin5) 0.03329* 0.582 0.165 29 (0.64) 87.10
YPL202C (Aft2) 0.07004o 0.579 0.092 34 (0.76) 75.80
YDL056W (Mbp1) 0.05184o 0.588 0.158 33 (0.73) 73.87
YGL071W (Rcs1) 0.02813* 0.581 0.115 33 (0.73) 73.42
YDL106C (Pho2) 0.01764* 0.569 0.143 27 (0.60) 61.63
Module 5 YPR065W (Rox1) 0.06635o 0.666 0.185 35 (0.78) 80.97
YBR049C (Reb1) 0.04439* 0.682 0.206 37 (0.82) 80.96
YDR423C (Cad1) 0.05867o 0.574 0.119 31 (0.69) 75.47
YHR178W (Stb5) 0.09263o 0.626 0.166 37 (0.82) 70.27
YMR037C (Msn2) 6.0 ×10⁻⁵*** 0.597 0.183 35 (0.78) 72.13
YMR070W (Mot3) 0.09263o 0.624 0.161 35 (0.78) 60.97
YKL062W (Msn4) 0.02334* 0.706 0.242 36 (0.80) 54.91
Module 6 YNL216W (Rap1) 0.05212o 0.624 0.175 33 (0.73) 73.92
YJR060W (Cbf1) 0.00544** 0.605 0.140 35 (0.78) 73.15
YIR018W (Yap5) 0.00379** 0.527 0.110 27 (0.60) 70.80
YDL020C (Rpn4) 0.08764o 0.641 0.185 30 (0.67) 70.10
YOR344C (Tye7) 0.03477** 0.663 0.175 38 (0.84) 68.96
YKL112W (Abf1) 0.04084* 0.629 0.201 33 (0.73) 68.51
YPR104C (Fhl1) 0.02139* 0.547 0.120 28 (0.62) 59.81
Module 7 YBR049C (Reb1) 0.00056*** 0.682 0.206 37 (0.82) 80.96
YKR099W (Bas1) 0.01578* 0.591 0.163 29 (0.64) 69.26
YBL103C (Rtg3) 0.04638* 0.607 0.144 36 (0.80) 67.13
YDR043C (Nrg1) 0.08764o 0.637 0.205 33 (0.73) 63.85
YDR146C (Swi5) 0.02932* 0.764 0.289 41 (0.91) 63.56
YDL106C (Pho2) 0.02567* 0.569 0.143 27 (0.60) 61.63
2 × 2 TF-module association tables were computed that reflect the number of module-specific genes (n= 1,828) that associate with one of seven timing modules and are regulated by one of 63 transcription factors (TFs). (A subset of 63/117 TFs were used that has at least seven targeted genes.) TF regulatory binding data were obtained from [46] using a cutoff of P < 0.001 and moderate conservation (cons = 1). Fisher’s Exact tests were used to evaluate the significance of each TF-module association along with a false discovery rate correction ***indicates FDR < 0.001; **indicates FDR < 0.01; *indicates FDR < 0.05; o
indicates FDR < 0.1. In total 37 TFs show significant modular association (FDR < 0.1). Five TFs associate with two modules (Abf1,Fhl1,Pho2,Rap1,Reb1). R
H1 2
and RH
0
2 indicate explained CDC-expression variation averaged over 45 strain comparisons, computed by the dependent heterochrony or
heterochronic shifts (distortion) compared to expecta-tion from all heterochronic genes (76th percentile) and from all TFs (76th percentile). At least one TF from every module shows significantly large distortion com-pared to all heterochronic genes or all regulatory factors (P < 0.05); however, only one of these TFs (Cin5) is among the top 50 of all heterochronic genes genome-wide (rank-46 by distortion; Table S9 in Additional file 1). There do not appear to be differences in the distortion of these TFs among modules (ANOVA,P= 0.2). Thus, quan-titative, heterochronic changes in the expression patterns of module-specific regulatory factors may drive divergence in CDC-transcriptome dynamics. While transcription fac-tors were the only class of regulatory facfac-tors considered here, our results do not exclude the likelihood that addi-tional factors, such as post-transcripaddi-tional RNA-binding proteins [47] or post-translational factors (kinases, methyl-transferases, chromatin modifying enzymes, and so on) [48,49], also contribute to the timing control of modular gene expression.
Genes with complex heterochrony associate with multiple timing patterns
While we found 1,828 genes that strongly associate within individual timing modules (module-specific genes), another 1,887 genes (31%) instead show strong associations across timing modules (between-module genes); these between-module genes may exhibit a com-plex pattern of heterochrony. Our hypothesis of modu-lar timing control suggests that negative pleiotropic effects due to changes in control may be minimized for genes with complex heterochrony by combinatorial reg-ulation, using TFs with different timing patterns rather than the same timing pattern. First, we found no TF that significantly associates with the 1,887 genes with complex heterochrony compared to module-specific genes (FDR < 0.1). We also evaluated whether the num-ber of module-specific TFs regulating a gene with com-plex heterochrony correlates with the number of timing modules represented by these TFs and obtained a rank correlation of 0.71 (P < 10-10). While some correlation is expected by chance, we found only three genes (Erg11, Sis1, and YMR196W) that are strictly regulated by multiple TFs from the same timing module (three TFs for each), suggesting that this type of regulation may be rare. Thus, genes that associate with multiple timing modules tend to be regulated by multiple differ-ent timing patterns. This suggests that complex patterns of heterochronic divergence could be generated combi-natorially while minimizing negative pleiotropic effects.
Discussion
Transcriptome divergence in the yeast cell-division cycle is highly time-dependent. While within-species divergence in
genome-wide gene expression levels is consistent with strong stabilizing selection at each timepoint of the cell-division cycle, a large fraction of genes show significant divergence in their dynamical patterns of expression. In addition, the magnitude, direction, and degrees of freedom of transcriptome covariation change across the cell-divi-sion cycle, concordant with time-specific changes in regu-latory complexity. While we could not test explicitly for the evolutionary mode of expression dynamics, we found that the major directions of within-species covariation associate with specific functional categories at different timepoints but not with neutrally-evolving genes; these directions do not predict the direction of between-species divergence for our outgroupS. paradoxus; and theS. cere-visiaelaboratory strain shows extensive divergence in expression dynamics, comparable toS. paradoxus. These results suggest considerable potential for non-neutral evo-lution of expression dynamics, despite strong stabilizing selection on mean expression levels.
Since widespread divergence in transcriptome dynamics might be explained by extensive qualitative changes in gene coregulation, we assessed the similarity of gene coexpression structure across strains. Consistent with this possibility, we found significant divergence in genome-wide and modular coexpression structure, across the entire cell-division cycle and in a time-depen-dent manner. However, divergence in temporal coex-pression does not assure divergence in coregulation; two genes may be coregulated yet exhibit distinct temporal expression trajectories (or vice-versa, for example, Figure 6B). Therefore we evaluated the possibility of heterochronic divergence, relating genes by shared changes in expression timing, rather than by similarity of expression levels (that is, coexpression). The majority of genes show timing changes consistent with hetero-chronic divergence, suggesting that evolution of the yeast CDC-transcriptome may be characterized as pre-dominantly heterochronic rather than heterometric.
dynamics may be explained by heterochronic divergence in the temporal expression patterns of module-specific regulatory factors that in turn affect the timing of down-stream gene expression events. Our results suggest that the short-term evolution of yeast regulatory architecture may entail preferentially quantitative changes in regula-tion, consistent with the established relationship betweentransregulatory variation and expression diver-gence within species [9-13] and conservation of tran-scription factor binding patterns between species [22]. Although our evidence supports the role of transcription factors specifically in driving heterochronic divergence, additional factors that regulate either the production or degradation of mRNA transcripts are likely to play a sig-nificant role. Future studies incorporating additional yeast strains or higher resolution time series data may facilitate identification of additional module-specific reg-ulatory factors and help to reveal the fine-scale structure of timing control in the yeast cell-division cycle.
Conclusions
Our data suggest a new view of molecular cell pro-cesses as a collection of dynamically-autonomous event timelines whose modularity allows divergence in gene regulation, while alleviating system-wide negative effects of regulatory change. Control of gene expression may utilize a general architecture comprised of multi-ple discrete event timelines that serve as a basis set of timing patterns. Interactions among module-specific regulatory factors may determine individual event time-lines, and superposition different timelines may gener-ate combinatorial complexity in regulatory patterns. This modular dynamical architecture may facilitate the generation of complex regulatory variation via changes in the scheduling and coordination of discrete event timelines, while buffering variation in individual gene expression. In this way, the architecture of genome-wide timing control may bias a population’s evolution-ary dynamics.
Materials and methods
Yeast strains
The ten natural S. cerevisiae and S. paradoxus strains are heterothallic haploid MATa derivatives of homothal-lic diploids. Woodland isolates were previously collected from state parks in Pennsylvania and New Jersey, USA [50] (Table S1 in Additional file 1). Laboratory strain YPS183 (HOΔ:kanMX, leu2Δ) derives from BY4741. Mating-type switching was prevented by homologous recombination of a Kanamycin resistance cassette at the HO endonuclease locus (YDL227C). The 23 mutation accumulation lines (provided by C. Zeyl [51]) are diploid and were propagated asexually for 600 generations from a Y55 ancestor (leu2Δ).
Synchronization and sampling of yeast cultures
Strains were inoculated from frozen stock and cultured overnight in synthetic dextrose (SD) minimal medium at 30°C (225 rpm). The next day cultures were diluted into fresh SD and upon reaching a culture density of OD ≈
0.25, a-factor mating pheromone was added to a final concentration of 4 μM. Cultures were then incubated approximately 75 min. until arrested and synchronized in late G1. The state of synchronization was determined
by the appearance of < 10% shmoos and < 10% budding cells, visualized by light microscopy (100 ×, oil). Cul-tures were released from arrest by removing a-factor: 2 × wash with 4°C S medium (SD without dextrose) and resuspension of cell pellets with fresh 18°C SD medium. Approximately 25 ml aliquots of each culture were dis-tributed into 18 flasks and incubated at 18°C (225 rpm). Incubation of cultures at 18°C in SD medium more than doubles the CDC-period, allowing a more accurate com-parison of measurements across strains by reducing temporal sampling variation.
The sampling time course consisted of 18 samples, taken at average intervals of 19 min. (real time), starting at 0 min. (time of release from arrest) and ending at 345 min. The first sample (0 min.) was taken after all flasks were returned to the incubator. Upon sampling, each culture was placed on dry ice, mixed with 20 ml of -20° C 100% EtOH in a 50 ml Falcon tube, inverted, and placed immediately into a -80°C freezer.
Microarray processing and analysis
Total RNA was extracted from each frozen cell culture sample using Qiagen’s RNeasy Kit, following manufac-turer’s instructions. cDNA was prepared from 15 μg of each RNA sample using SuperScript III reverse tran-scriptase (Invitrogen) and compared directly to unsyn-chronized S. cerevisiaecDNA (YPS183 cultured at 30°C in YPD until reachingOD6001.1) on 2-channel
spotted-oligo glass microarrays in a common reference design. Invitrogen AlexaFluor 555 and 647 fluorophores were used to label each cDNA sample. Hybridized slides were incubated for 24-65 hours at 42°C. Slides were prepared for scanning by serial incubation in wash buffers and dried using both a vacuum and high-purity, filtered N2 gas.
respectively. Data were quantified, filtered, and normal-ized, yielding expression measurements for 5879.9 genes per strain on average (92.4%). Measurements show a grand mean standard error (SE) of 0.175. Using two microarrays of the same strain independently cultured, synchronized, and sampled at 63 min., biological repli-cate measurement error was estimated as 0.554 (SE). Microarray data are available from the NCBI GEO data-base under accession number [GEO:GSE24237] and from the authors’web site [52].
A set of 91 transposable (Ty) element genes were excluded from the final data collection. The remaining 6,263 gene expression trajectories were imputed for missing data and calibrated to a common CDC-period of 267 min. using budding index measurements. A com-mon set of 6,082 genes have CDC expression for all ten natural strains. Custom software written in Python, R, SAS, and Mathematica was used to carry out computa-tional analyses as described in the Supplemental Materi-als and methods.
Additional material
Additional file 1: Supplemental materials and methods; text, figures, and tables. This file contains 10 texts, 33 figures, and 12 tables.
Additional file 2: Yeast heterochronic network. This spreadsheet details the 5,393 significant gene-gene heterochronic interactions, 1,828 module-specific genes, and 1,887 genes with complex heterochrony.
Abbreviations
CDC: cell-division cycle; FDR: false discovery rate; FWER: family-wise error rate; LDA: linear discriminant analysis; LFA: latent factor analysis; MA: mutation accumulation; PCA: principal component analysis; RMSE: root mean squared error; SD: synthetic dextrose; SE: standard error; SVD: singular value decomposition; TF: transcription factor.
Acknowledgements
We wish to acknowledge H. Murphy, C. Winter, F. Ge, E. Daugharthy, A. Goodman, and I. Gawlas for assistance, as well as M. Lee, P. Shah, and two anonymous reviewers for constructive criticism on the manuscript. This work is supported in part by a HRFF grant to the University of Pennsylvania from the Common Wealth of Pennsylvania and a NRSA Training Grant in Computational Genomics from the University of Pennsylvania (DFS). The funding bodies had no role in study design; in collection, analysis, or interpretation of data; in the writing of the manuscript; or in the decision to submit the manuscript for publication.
Author details
1Department of Biology, University of Pennsylvania, 433 S. University Ave.,
Philadelphia, PA 19104, USA.2Penn Genome Frontiers Institute, 433 S. University Ave., Philadelphia, PA 19104, USA.
Authors’contributions
JK and DFS designed experiments in consultation with PDS. CF performed genetic transformations of woodland yeast strains, which were isolated by PDS. DFS collected RNA and generated expression data. DFS and JK developed computational analyses, and DFS carried them out. DFS and JK wrote the paper. All authors read and approved the final manuscript.
Received: 27 May 2010 Revised: 30 August 2010 Accepted: 22 October 2010 Published: 22 October 2010
References
1. Rifkin SA, Kim J, White KP:Evolution of gene expression in theDrosophila melanogastersubgroup.Nat Genet2003,33:138-144.
2. Rifkin SA, Houle D, Kim J, White KP:A mutation accumulation assay reveals a broad capacity for rapid evolution of gene expression.Nature 2005,438:220-223.
3. Denver DR, Morris K, Streelman JT, Kim SK, Lynch M, Thomas WK:The transcriptional consequences of mutation and natural selection in Caenorhabditis elegans.Nat Genet2005,37:544-548.
4. Simon I, Barnett J, Hannett N, Harbison CT, Rinaldi NJ, Volkert TL, Wyrick JJ, Zeitlinger J, Gifford DK, Jaakkola TS, Young RA:Serial regulation of transcriptional regulators in the yeast cell cycle.Cell2001,106:697-708. 5. Lee TI, Rinaldi NJ, Robert F, Odom DT, Bar-Joseph Z, Gerber GK,
Hannett NM, Harbison CT, Thompson CM, Simon I, Zeitlinger J,
Jennings EG, Murray HL, Gordon DB, Ren B, Wyrick JJ, Tagne JB, Volkert TL, Fraenkel E, Gifford DK, Young RA:Transcriptional regulatory networks in Saccharomyces cerevisiae.Science2002,298:799-804.
6. Harbison CT, Gordon DB, Lee TI, Rinaldi NJ, Macisaac KD, Danford TW, Hannett NM, Tagne JB, Reynolds DB, Yoo J, Jennings EG, Zeitlinger J, Pokholok DK, Kellis M, Rolfe PA, Takusagawa KT, Lander ES, Gifford DK, Fraenkel E, Young RA:Transcriptional regulatory code of a eukaryotic genome.Nature2004,431:99-104.
7. Luscombe NM, Babu MM, Yu H, Snyder M, Teichmann SA, Gerstein M: Genomic analysis of regulatory network dynamics reveals large topological changes.Nature2004,431:308-312.
8. Stearns SC, Magwene P:The naturalist in a world of genomics.Am Nat 2003,161:171-180.
9. Wittkopp PJ, Haerum BK, Clark AG:Evolutionary changes in cis and trans gene regulation.Nature2004,430:85-88.
10. Borneman AR, Gianoulis TA, Zhang ZD, Yu H, Rozowsky J, Seringhaus MR, Wang LY, Gerstein M, Snyder M:Divergence of transcription factor binding sites across related yeast species.Science2007,317:815-819. 11. Wittkopp PJ, Haerum BK, Clark AG:Regulatory changes underlying
expression differences within and betweenDrosophilaspecies.Nat Genet 2008,40:346-350.
12. Tirosh I, Reikhav S, Levy AA, Barkai N:A yeast hybrid provides insight into the evolution of gene expression regulation.Science2009,324:659-662. 13. McManus CJ, Coolon JD, Du MO, Eipper-Mains J, Graveley BR, Wittkopp PJ:
Regulatory divergence inDrosophilarevealed by mRNA-seq.Genome Res 2010,20:816-825.
14. Yvert G, Brem RB, Whittle J, Akey JM, Foss E, Smith EN, Mackelprang R, Kruglyak L:Trans-acting regulatory variation inSaccharomyces cerevisiae and the role of transcription factors.Nat Genet2003,35:57-64. 15. Wang D, Sung HM, Wang TY, Huang CJ, Yang P, Chang T, Wang YC,
Tseng DL, Wu JP, Lee TC, Shih MC, Li WH:Expression evolution in yeast genes of single-input modules is mainly due to changes in trans-acting factors.Genome Res2007,17:1161-1169.
16. Chang YW, Robert Liu FG, Yu N, Sung HM, Yang P, Wang D, Huang CJ, Shih MC, Li WH:Roles of cis-and trans-changes in the regulatory evolution of genes in the gluconeogenic pathway in yeast.Mol Biol Evol 2008,25:1863-1875.
17. Sung HM, Wang TY, Wang D, Huang YS, Wu JP, Tsai HK, Tzeng J, Huang CJ, Lee YC, Yang P, Hsu J, Chang T, Cho CY, Weng LC, Lee TC, Chang TH, Li WH, Shih MC:Roles of trans and cis variation in yeast intraspecies evolution of gene expression.Mol Biol Evol2009,26:2533-2538. 18. Emerson JJ, Hsieh LC, Sung HM, Wang TY, Huang CJ, Lu HHS, Lu MYJ,
Wu SH, Li WH:Natural selection on cis and trans regulation in yeasts.
Genome Res2010,20:826-836.
19. Han JS, Szak ST, Boeke JD:Transcriptional disruption by the L1 retrotransposon and implications for mammalian transcriptomes.Nature 2004,429:268-274.
20. Stranger BE, Forrest MS, Dunning M, Ingle CE, Beazley C, Thorne N, Redon R, Bird CP, de Grassi A, Lee C, Tyler-Smith C, Carter N, Scherer SW, Tavaré S, Deloukas P, Hurles ME, Dermitzakis ET:Relative impact of nucleotide and copy number variation on gene expression phenotypes.
Science2007,315:848-853.
21. De S, Teichmann SA, Babu MM:The impact of genomic neighborhood on the evolution of human and chimpanzee transcriptome.Genome Res 2009,19:785-794.
quantitative changes in transcription factor binding between closely relatedDrosophilaspecies.PLoS Biol2010,8:e1000343.
23. Beer MA, Tavazoie S:Predicting gene expression from sequence.Cell 2004,117:185-198.
24. Yuan Y, Guo L, Shen L, Liu JS:Predicting gene expression from sequence: a reexamination.PLoS Comput Biol2007,3:e243.
25. Prill RJ, Iglesias PA, Levchenko A:Dynamic properties of network motifs contribute to biological network organization.PLoS Biol2005,3:e343. 26. Alexander RP, Kim PM, Emonet T, Gerstein MB:Understanding modularity
in molecular networks requires dynamics.Sci Signal2009,2:pe44. 27. Kim J, Kerr JQ, Min GS:Molecular heterochrony in the early development
ofDrosophila.Proc Natl Acad Sci USA2000,97:212-216.
28. Somel M, Franz H, Yan Z, Lorenc A, Guo S, Giger T, Kelso J, Nickel B, Dannemann M, Bahn S, Webster MJ, Weickert CS, Lachmann M, Paabo S, Khaitovich P:Transcriptional neoteny in the human brain.Proc Natl Acad
Sci USA2009,106:5743-5748.
29. Olson ME, Rosell JA:Using heterochrony to detect modularity in the evolution of stem diversity in the plant familyMoringaceae.Evolution 2006,60:724-734.
30. Moss EG:Heterochronic genes and the nature of developmental time.
Curr Biol2007,17:R425-34.
31. Landry CR, Lemos B, Rifkin SA, Dickinson WJ, Hartl DL:Genetic properties influencing the evolvability of gene expression.Science2007, 317:118-121.
32. Gu Z, David L, Petrov D, Jones T, Davis RW, Steinmetz LM:Elevated evolutionary rates in the laboratory strain ofSaccharomyces cerevisiae.
Proc Natl Acad Sci USA2005,102:1092-1097.
33. Rifkin SA, Atteson K, Kim J:Constraint structure analysis of gene expression.Funct Integr Genomics2000,1:174-185.
34. Phillips PC, Arnold SJ:Hierarchical comparison of genetic variance-covariance matrices. I. Using the Flury hierarchy.Evolution1999, 53:1506-1515.
35. Schluter D:Adaptive radiation along genetic lines of least resistance.
Evolution1996,50:1766-1774.
36. Csete ME, Doyle JC:Reverse engineering of biological complexity.Science 2002,295:1664-1669.
37. Gould SJ:Ontogeny and PhylogenyCambridge, MA: Harvard University Press; 1977.
38. Alberch P, Gould SJ, Oster GF, Wake DB:Size and shape in ontogeny and phylogeny.Paleobiology1979,5:296-317.
39. Bonner JT:Size and Cycle: An Essay on the Structure of BiologyPrinceton, NJ: Princeton University Press; 1965.
40. Winzeler EA, Shoemaker DD, Astromoff A, Liang H, Anderson K, Andre B, Bangham R, Benito R, Boeke JD, Bussey H, Chu AM, Connelly C, Davis K, Dietrich F, Dow SW, El Bakkoury M, Foury F, Friend SH, Gentalen E, Giaever G, Hegemann JH, Jones T, Laub M, Liao H, Liebundguth N, Lockhart DJ, Lucau-Danila A, Lussier M, M’Rabet N, Menard P, Mittmann M, Pai C, Rebischung C, Revuelta JL, Riles L, Roberts CJ, Ross-MacDonald P, Scherens B, Snyder M, Sookhai-Mahadeo S, Storms RK, Véronneau S, Voet M, Volckaert G, Ward TR, Wysocki R, Yen GS, Yu K, Zimmermann K, Philippsen P, Johnston M, Davis RW:Functional characterization of theS. cerevisiaegenome by gene deletion and parallel analysis.Science1999, 285:901-906.
41. Hughes TR, Marton MJ, Jones AR, Roberts CJ, Stoughton R, Armour CD, Bennett HA, Coffey E, Dai H, He YD, Kidd MJ, King AM, Meyer MR, Slade D, Lum PY, Stepaniants SB, Shoemaker DD, Gachotte D, Chakraburtty K, Simon J, Bard M, Friend SH:Functional discovery via a compendium of expression profiles.Cell2000,102:109-126.
42. Li F, Long T, Lu Y, Ouyang Q, Tang C:The yeast cell-cycle network is robustly designed.Proc Natl Acad Sci USA2004,101:4781-4786. 43. Wagner GP, Altenberg L:Perspective: complex adaptations and the
evolution of evolvability.Evolution1996,50:967-976.
44. Willmore KE, Young NM, Richtsmeier JT:Phenotypic variability: its components, measurement and underlying developmental processes.
Evol Biol2007,34:99-120.
45. Landry CR:Systems biology spins off a new model for the study of canalization.Trends Ecol Evol2009,24:63-66.
46. MacIsaac KD, Wang T, Gordon DB, Gifford DK, Stormo GD, Fraenkel E:An improved map of conserved regulatory sites forSaccharomyces cerevisiae.BMC Bioinformatics2006,7:113.
47. Amorim MJ, Cotobal C, Duncan C, Mata J:Global coordination of transcriptional control and mRNA decay during cellular differentiation.
Mol Syst Biol2010,6:380.
48. Jensen LJ, Jensen TS, de Lichtenberg U, Brunak S, Bork P:Co-evolution of transcriptional and post-translational cell-cycle regulation.Nature2006, 443:594-597.
49. Choi JK, Kim YJ:Epigenetic regulation and the variability of gene expression.Nat Genet2008,40:141-7.
50. Sniegowski PD, Dombrowski PG, Fingerman E:Saccharomyces cerevisiae andSaccharomyces paradoxuscoexist in a natural woodland site in North America and display different levels of reproductive isolation from European conspecifics.FEMS Yeast Res2002,1:299-306.
51. Zeyl C, DeVisser JA:Estimates of the rate and distribution of fitness effects of spontaneous mutation inSaccharomyces cerevisiae.Genetics 2001,157:53-61.
52. Comparative Yeast Time-Series Gene Expression.[http://kim.bio.upenn. edu/software/yeast-cdc.shtml].
doi:10.1186/gb-2010-11-10-r105
Cite this article as:Simolaet al.:Heterochronic evolution reveals
modular timing changes in budding yeast transcriptomes.Genome Biology201011:R105.
Submit your next manuscript to BioMed Central and take full advantage of:
• Convenient online submission
• Thorough peer review
• No space constraints or color figure charges
• Immediate publication on acceptance
• Inclusion in PubMed, CAS, Scopus and Google Scholar
• Research which is freely available for redistribution