Equation of state and high-pressure/high-temperature phase diagram of magnesium
G. W. Stinton,1S. G. MacLeod,2,3,4H. Cynn,5D. Errandonea,6W. J. Evans,5J. E. Proctor,1Y. Meng,7and M. I. McMahon1,4
1SUPA, School of Physics and Astronomy, and Centre for Science at Extreme Conditions,
The University of Edinburgh, Edinburgh, EH9 3JZ, United Kingdom
2Atomic Weapons Establishment, Aldermaston, Reading, RG7 4PR, United Kingdom
3Institute of Shock Physics, Imperial College London, SW7 2AZ, United Kingdom
4Research Complex at Harwell, Didcot, Oxon, OX11 0FA, United Kingdom
5Lawrence Livermore National Laboratory, Condensed Matter and Material Division,
Physics and Life Sciences Directorate, Livermore, California 94551 USA
6Departamento de Fisica Aplicada - ICMUV, Universitat de Valencia, C/Dr. Moliner 50, Burjassot, E-46100, Valencia, Spain
7High Pressure Collaborative Access Team, Geophysical Laboratory, Carnegie Institution of Washington, Argonne, Illinois 60439, USA
(Received 27 January 2014; revised manuscript received 28 August 2014; published 20 October 2014)
The phase diagram of magnesium has been investigated to 211 GPa at 300 K, and to 105 GPa at 4500 K, by using a combination of x-ray diffraction and resistive and laser heating. The ambient pressure hcp structure is found to start transforming to the bcc structure at∼45 GPa, with a large region of phase-coexistence that becomes smaller at higher temperatures. The bcc phase is stable to the highest pressures reached. The hcp-bcc phase boundary has been studied on both compression and decompression, and its slope is found to be negative and steeper than calculations have previously predicted. The laser-heating studies extend the melting curve of magnesium to 105 GPa and suggest that, at the highest pressures, the melting temperature increases more rapidly with pressure than previously reported. Finally, we observe some evidence of a new phase in the region of 10 GPa and 1200 K, where previous studies have reported a double-hexagonal-close-packed (dhcp) phase. However, the additional diffraction peaks we observe cannot be accounted for by the dhcp phase alone.
DOI:10.1103/PhysRevB.90.134105 PACS number(s): 61.50.Ks,62.50.−p,64.30.Ef
I. INTRODUCTION
Magnesium (Mg) has been described as a nearly-free-electron metal up to pressures of around 100 GPa [1]. This, combined with interest in the pressure-driven transfer of electrons from thespband to the 3d band as the energy gap between the two decreases, has led to a number of theoretical studies [2–9] up to 30 TPa. Experimental studies have been conducted at room temperature (RT) to only the relatively modest pressure of 158 GPa [10].
On compression, Mg transforms from the ambient-pressure hexagonal-close-packed (hcp) phase to the body-centered cubic (bcc) phase between 44 and 58 GPa, with a large region of phase coexistence [11]. The bcc phase is known to be stable to 158 GPa [10]. At higher pressures, there have been several computational predictions of transformations to a number of different phases, including face-centered cubic [5,8,12,13], simple cubic [3], simple hexagonal [8,13], simple cubic [8], and orthorhombic [8]. None of these post-bcc phases have been observed experimentally.
Kennedy and Newton [14] and Errandonea [15] determined the melting curve of hcp-Mg by resistivity measurements up to 12 GPa. Laser-heating experiments conducted by Errandonea et al. [16] agree with these measurements and reported that the melting temperature (Tm) of Mg increases at around 45 K/GPa until 40 GPa [17] at which pointdTm/dPdecreases such that, by 70 GPa, the melting temperature is almost pressure independent. There have been a number ofab initio calculations performed to determine the nature of the hcp-bcc phase boundary [2,4,6,13], and these all show a negative slope, with the liquid-bcc-hcp triple point calculated to lie between 4 GPa and 1200 K [2] and 20 GPa and 1750 K [13]. Shock-compression studies along the Hugoniot [18] suggested the existence of a phase transition at 26.2 (13) GPa and
900 K, which correlates well with the hcp-bcc phase boundary calculated by Moriarty and Althoff [4].
In their high-temperature diffraction study to 18.6 GPa and 1527 K, Errandoneaet al.[19] reported peak splittings and the appearance of new diffraction peaks which they interpreted as arising from a double-hexagonal-close-packed (dhcp) phase that was recoverable back to RT at 8.05 GPa. However, a similar study by Cynnet al.to 25 GPa and 1900 K [20] saw no evidence of this dhcp phase. Metadynamics calculations [9] have addressed the relative stabilities of the hcp, dhcp, and bcc phases, and while they found no stability range for the dhcp phase at RT, structural transformations back and forth between the hcp, dhcp, and bcc structures were found, but at 15 GPa and 500 K. These structural fluctuations were reported to be driven by kinetics, and the authors suggest that the experimental observation of the dhcp structure at ∼15 GPa is because it is much more energetically favorable than the bcc structure at this pressure [9].
Despite much previous study there still remain a number of inconsistencies between the observed and calculated behavior of Mg. To address and resolve these, and to more fully explore the phase diagram of Mg, including the existence of the dhcp phase, we have made a series of x-ray diffraction studies using diamond anvil cells and different heating techniques up to 211 GPa at RT and to∼4500 K at 105 GPa.
II. EXPERIMENTAL DETAILS
was loaded with Mg powder of 99.999% purity purchased from Aldrich Chemicals. No pressure-transmitting medium (PTM) was used. Powder angle-dispersive x-ray diffraction (ADXRD) data were collected on compression using the 16IDB HPCAT (High Pressure Collaborative Access Team) beamline at the Advanced Photon Source (APS), Argonne National Laboratory, Chicago, USA, using a wavelength of 0.398 ˚A and an x-ray beam size of 5μm in diameter. Cell 1 was loaded with micron-sized pieces of both copper (Cu) and tantalum (Ta) as pressure markers and data were collected to 211 GPa. Unfortunately, at this pressure, the anvils failed, terminating the experiment.
For the resistive-heating studies we used six gas-membrane driven diamond anvil cells [22] equipped with diamonds with either 250 and 300 μm culets and loaded with the same Mg powder as described above. Cu powder was used as the pressure marker, and no pressure-transmitting medium was used so as to prevent chemical reactions at high temperatures. The cells were contained within a custom-designed vacuum vessel and were heated with external resistance heaters. The temperature was measured by using a K-type thermocouple attached to one of the diamond anvils, close to the gasket. The diffraction data were collected on the I15 beamline at the Diamond Light Source using an incident x-ray wavelength of 0.414 ˚A.
For the laser-heating measurements, pieces of 8-μm-thick Mg foil (99.999% purity, Aldrich Chemicals) were loaded between insulating layers of approximately the same thickness of MgO, into 12 Boehler–Almax cells equipped with diamonds with culet diameters ranging between 150 and 300μm. Cu powder was included with the sample as a pressure marker, but sample pressures were determined from the equation of state of MgO as it was present in every diffraction image. Simultaneous laser-heating and x-ray diffraction was carried out at 16IDB, HPCAT using an x-ray wavelength of 0.620 ˚A and a beam diameter of 5 μm full width at half maximum (FWHM). Double-sided heating of the sample was achieved by using two 100 W YLF fiber lasers and temperatures were measured separately from both sides with an imaging spectrograph [23]. The laser-heating spot size was approximately 20 μm (flat top area), significantly larger than the x-ray beam size. With the mirror pinhole setup [24], the alignment of heating, temperature measurement, and ADXRD spots can be directly monitored to ensure meaningful measurement results.
In all three sets of experiments, the two-dimensional diffraction patterns were collected on either a MAR CCD (for laser heating at HPCAT) or a MAR345 image plate (resistive heating at HPCAT, and all studies at I15) and integrated azimuthally by using Fit2d [25]. The resulting one-dimensional diffraction profiles were analyzed by LeBail fitting [26] of the whole profiles using the TOPASacademic package [27], or by analysis and least-squares fitting of thed
spacings of individual diffraction peaks.
The pressure of cell 1 and that of the DACs used in the resistive-heating experiments were determined from the Cu pressure marker in the sample chamber by using the high-temperature Cu equation of state (EoS) of Cynn [28]. Because no pressure medium was utilized in these cells, the samples may therefore have experienced nonhydrostatic-pressure con-ditions, leading to an overestimate of the measured volume
of both the Mg sample and the Cu pressure marker [29], and therefore an underestimate of the sample pressure. Because Mg is a soft metal, we expected any such effects to be small, but to quantify them we repeated the analysis of Singh and Kenichi [29,30]. In the Cu pressure marker, there was no systematic effect below ∼75 GPa. At 100 GPa there was a small systematic overestimate of the Cu volume, leading to a pressure underestimate of 1 GPa, and this increased to 4 GPa at pressures above 200 GPa. All sample pressures were corrected for the effects of nonhydrostatic-pressure conditions. The Mg thus acted as a good hydrostatic medium for the Cu pressure marker and, as a result, there was no evidence for any nonhydrostatic-pressure conditions within the hcp phase of Mg below 50 GPa. For the high-pressure bcc phase above 50 GPa, the Mg sample volume was found to be slightly overestimated at pressures above 100 GPa, and the sample volumes were corrected accordingly.
Very few of the laser-heating diffraction images contained diffraction peaks from the Cu pressure marker, due to the small beam size and the need to position the laser and x-ray beam in places where good laser coupling could be achieved. Therefore, the MgO thermal insulation in the pressure chamber was used as the pressure calibrant. The pressures were determined by using the thermal EoS of Spezialeet al.[31]. The temperature of the MgO was assumed to be equal to the temperature inferred by using pyrometry; that is, the temperature of the Mg-MgO interface. Axial temperature gradients were clearly present in the MgO, with the MgO in contact with the diamond anvil being significantly cooler than that in contact with the sample. A temperature difference of 1000 K corresponds to a pressure difference of approximately 7 GPa [32]. Upon heating, the integrated diffraction peaks from the MgO were noticeably broader than those from the sample. The additional width of the MgO peaks suggests a temperature gradient of around 500 K at a sample temperature of 1000 K, rising to around 700 K at a sample temperature of 2500 K. The stated pressures may thus be systematically 3 to 6 GPa too high, with the higher discrepancies at the higher-temperature and higher-pressure region of the phase diagram.
III. EXPERIMENTAL RESULTS
A. Room-temperature compression and equation of state In addition to the DAC specifically prepared to measure the RT compression beyond 200 GPa (cell 1), one of the gas-membrane DACs used for resistive heating (henceforth labeled cell 2) was first pressurized at RT to 78.1 GPa, before being decompressed to 32.7 GPa, in order to study the bcc-to-hcp transition on both compression and decompression. As mentioned previously, neither cells 1 or 2 contained any pressure-transmitting medium, and both contained a Cu pressure marker.
0 50 100 150 200 8
12 16 20 24
Pressure (GPa)
Atomic
Vo
lu
m
e
(
Å
3)
bcc
hcp
Atomic
V
o
lume (Å
3 )
Pressure (GPa)
30 40 50 60 70
12 13 14 15 16
[image:3.608.53.296.70.247.2]hcp [10] bcc [10] hcp cell 1 bcc cell 1 hcp cell 2 bcc cell 2
FIG. 1. The atomic volume of Mg as a function of pressure to 211 GPa at 300 K, as obtained from cells 1 and 2 (see main text for descriptions of each). Data points from the hcp phase are shown using solid symbols, while data from the bcc phase are shown using open symbols. Data from cells 1 and 2 are plotted using diamonds and squares, respectively. The data of Nishimuraet al.[10], plotted with filled and open circles, are shown for comparison. The solid and dashed lines show the Vinet equations of state for the hcp and bcc phases, as determined from the current data, using the parameters given in TableI. All error bars are smaller than the symbols used to plot the data. The inset shows an enlarged view of the atomic volume at pressures between 30 and 70 GPa, and highlights the volume change at the hcp-to-bcc transition.
smaller coexistence region, with the bcc phase emerging at 50 (2) GPa, and single-phase patterns were observed above 58 (2) GPa. On decompression of cell 2 from 78 GPa, the reverse bcc-to-hcp transition was found to start at 44.9 (13) GPa and single-phase profiles of the hcp phase were observed only below 36 (1) GPa.
After obtaining single-phase profiles of the bcc phase, the sample pressure in cell 1 was increased to a maximum pressure of 211 GPa. No further phase transitions were observed, and the bcc phase was found to be stable at RT to this maximum
pressure. The RT compressibility of the hcp and bcc phases on both pressure increase and decrease, as obtained from the samples in cells 1 and 2, is shown in Fig. 1. From mixed-phase profiles obtained between 47 and 57 GPa, the volume changeV/V0 at the hcp-to-bcc transition is determined to be 0.45 (18)% (see inset to Fig. 1), in excellent agreement with the volume difference of 0.4 (4)% reported by Nishimura et al.[10].
The compressibilities of the hcp and bcc phases were fitted with two separate Vinet [33] equations of state (EoS) by using the EOSFIT package [34]. For comparison with previous studies [7,10,19], the same data were also fitted with a Birch–Murnaghan (B-M) EoS.V0of the hcp phase was fixed at its experimentally determined value of 23.1495 (8) ˚A3per atom. Determining the value ofV0 for the high-pressure bcc phase presented a greater problem because this phase is not stable at ambient pressure and refining a value forV0 within
EOSFITshowed that this parameter was correlated with both
K0 and K at more than 98%. Liuet al. [7] calculated the relative volumes of the hcp and bcc phases at ambient pressure (at 0 K) and determined that the atomic volume of the bcc phase was 0.043% smaller than that of the hcp phase. This implies a value of V0 for the bcc phase of 23.1398 (8) ˚A3 per atom, andK0 andK for the bcc phase were therefore refined withV0 fixed at this value. The results of all of the EoS fits are shown in TableI. The bulk modulus determined here for the hcp phase using a Vinet EoS is smaller than those determined previously [7,10,19], although use of the B-M EoS gives slightly better agreement.
The EoS values determined for the bcc phase with a fixed V0are reasonably similar to those of Liuet al.[7] but disagree with the values of Nishimuraet al.[10]. However, the value Nishimura et al.determine for V0 of the bcc phase is very small compared with that of the hcp phase. AllowingV0 to refine and using a B-M EoS gave values for K0 and K of 45 (8) GPa and 3.8 (1), respectively, much closer to those of Nishimuraet al.—see TableI. However, the large correlation between all parameters in this fit, together with the small value of V0 [21.7 (9) ˚A3 per atom] and the large uncertainties in the values, means we do not place much faith in the results
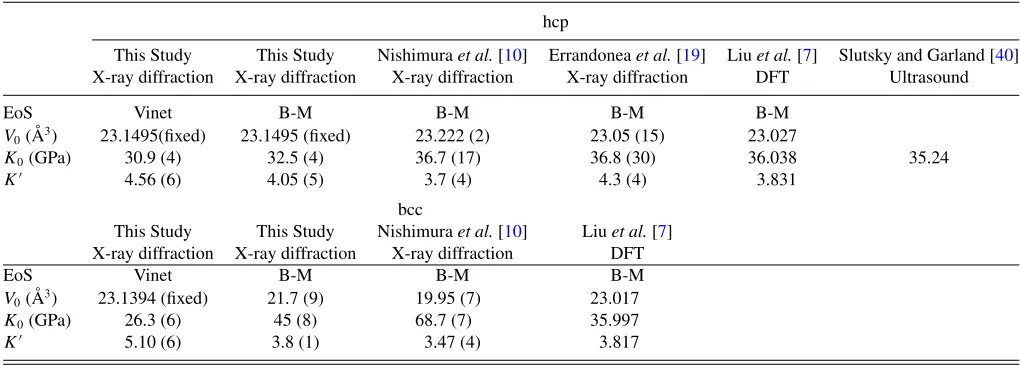
TABLE I. Results of fitting the experimental volumes of the hcp and bcc phases with Vinet and Birch–Murnaghan (B-M) equations of state, with the most recently published experimental and theoretical values for comparison. The bulk modulus of Slutsky and Garland [40] is the adiabatic value calculated from the measured elastic constants.
hcp
This Study This Study Nishimuraet al.[10] Errandoneaet al.[19] Liuet al.[7] Slutsky and Garland [40] X-ray diffraction X-ray diffraction X-ray diffraction X-ray diffraction DFT Ultrasound
EoS Vinet B-M B-M B-M B-M
V0( ˚A3) 23.1495(fixed) 23.1495 (fixed) 23.222 (2) 23.05 (15) 23.027
K0(GPa) 30.9 (4) 32.5 (4) 36.7 (17) 36.8 (30) 36.038 35.24
K 4.56 (6) 4.05 (5) 3.7 (4) 4.3 (4) 3.831
bcc
This Study This Study Nishimuraet al.[10] Liuet al.[7] X-ray diffraction X-ray diffraction X-ray diffraction DFT
EoS Vinet B-M B-M B-M
V0( ˚A3) 23.1394 (fixed) 21.7 (9) 19.95 (7) 23.017
K0(GPa) 26.3 (6) 45 (8) 68.7 (7) 35.997
[image:3.608.49.559.575.758.2]10 15 20 25
bcc (1
10)
31.3 GPa
47.2 GPa
56.2 GPa
52.3 GPa
hcp (101)
48.7 GPa
bcc (31
1
)
bcc (220)
bcc (21
1
)
bcc (200)
bcc (1
10)
46.8 GPa
bcc (1
10)
(203)
(104)
(202)
(004)
(1
12)
(200)
(103)
(1
10)
(102)
(101)
(002)
(100) Cu Cu Cu
Cu
MgO
(201)/MgO
MgO/Cu
MgO
MgO
Intensity (arb. units)
Mg MgO Cu
MgO
41.1 GPa 43.9 GPa
bcc (31
1
)
bcc (220)
bcc (21
1)
bcc (200)
bcc (1
10)
T = 700 (2) K
[image:4.608.327.542.66.324.2]2θ(deg.)
FIG. 2. Diffraction profiles collected on pressure increase from 41.1 to 56.2 GPa, and then back down to 31.3 GPa, at 700 K. The diffraction peaks from the Mg sample, MgO PTM, and Cu pressure marker are identified with tick marks beneath the bottom profile. Indices are given for the most intense diffraction peaks from each of the three materials. All diffraction patterns have had a smoothly varying background removed for clarity.
obtained from these nonconstrained fits for the bcc phase, nor those of Nishimuraet al.
IV. RESISTIVE-HEATING STUDIES
The DACs used for the resistive-heating studies were all initially pressurized to approximately 20 GPa, and then heated to 780, 700, 630, 480, and 400 K, with the sixth cell being compressed at RT for comparison. The diffraction data obtained on compression and decompression at 700 K are shown in Fig.2, and the results obtained at the six different temperatures are summarized in Fig.3.
A number of conclusions can be drawn from these measure-ments. First, the pressure at which the bcc phase first appears on compression increases slightly with increasing temperature, from 46.1 (8) GPa at 400 K to 46.8 (6) GPa at 700 K. However, the pressure at which the phase transition to the bcc was completed demonstrates a more dramatic change, dropping from∼61 GPa between 300 and 480 K to 55 (2) GPa at 700 K. Unfortunately, due to a sudden jump in pressure, it was not
0 20 40 60 80
300 400 500 600 700 800
T
e
mperature (K
)
Pressure (GPa)
hcp bcc
P Inc. P Dec.
FIG. 3. The temperature dependence of the hcp-to-bcc phase transition pressure in Mg on compression. TheP-T conditions at which single-phase hcp, mixed-phase hcp-bcc, and single-phase bcc profiles are observed are shown using filled, half-filled, and unfilled symbols, respectively. Data collected on pressure increase are plotted with squares, while data collected on pressure decrease are plotted using diamonds. The data collected on pressure decrease have been offset vertically by+10 K (at 300 K and 700 K) and +15 K (at 780 K) for clarity. The dot-dashed and dashed lines highlight the phase boundaries calculated by Moriarty and Althoff [4] and Mehta
et al.[6], respectively. The two hatched areas shows the mixed-phase
regions determined in the current study on pressure increase and decrease.
possible to obtain accurate transition pressures on compression from the sample at 780 K. However, a single-phase bcc pattern was obtained at 52.0 (3) GPa at 780 K, demonstrating a further drop in the transition-completion pressure with temperature increase above 700 K. This decrease in the size of the mixed-phase region with temperature is to be expected because it becomes easier to overcome the kinetic barriers to reach whichever phase is more thermodynamically stable.
[image:4.608.53.297.67.419.2]V. LASER-HEATING STUDIES
The 12 Boehler–Almax Plate DACs prepared for laser heating, as described above, were precompressed to a range of pressures between 5.7 and 90 GPa prior to heating. For each pressure cell, diffraction patterns were initially collected continuously as the powers of the two lasers were ramped manually from 0.3 to 62 W, with the powers of the two lasers illuminating each side of the sample adjusted to minimize tem-perature differences. However, it was noticed that sometimes the intensity of the thermal radiation decreased with time at constant laser power. In these cases, we switched to short-pulse (a few seconds) heating, and x-ray diffraction patterns were collected only during this short period. The exposure times for the diffraction patterns for each cell were therefore different and varied from less than 1 to 10 s. For all samples, the laser power was increased until either the sample melted, as described below, or the onset of large fluctuations in the thermal radiation emitted from the sample precluded further temperature measurements via spectroradiometry. The onset of these rapid fluctuations was accompanied by recrystallization of the sample, as judged by the changes in the positions of Bragg peaks on the detector from exposure to exposure. This phenomenon appears to be similar to that observed by Lazicki et al.in their recent laser-heating studies of Be [35].
Detecting the existence of molten Mg and determining the temperature at which melting occurs is challenging. It is generally accepted that the complete disappearance of crys-talline Bragg scattering is an indicator of melting. Although this is necessary, it is not sufficient, and the observation of a diffuse halo of scattering from the liquid is also required for definitive proof of melting. But, for weakly scattering samples such as Li [36] and Be [35], diffuse scattering from the liquid has not been observed, even in relatively large, resistively heated samples. In the current study, we were able to observe the disappearance of all Bragg scattering from the crystalline phases at clearly discernible temperatures, which we have interpreted as the melting temperature. However, above the melting temperature we were not able to obtain any measurable scattering from the liquid phase. In addition to the disappearance of all Bragg scattering, in many samples we were also able to observe the onset of rapid recrystallization of the samples at clearly defined temperatures below that of the melting temperature. Similar behavior has recently been reported in laser-heating diffraction studies of Be [35], Mo [37], and Fe [38]. This recrystallization behavior was clearly distinguishable from the disappearance of the Bragg scattering at higher temperatures that we associated with melting. In some of the samples, the rapid-recrystallization of the sample also produced rapid and very large fluctuations in the measured temperature, which precluded further studies at higher temperatures, and thus the determination of true melting in these samples.
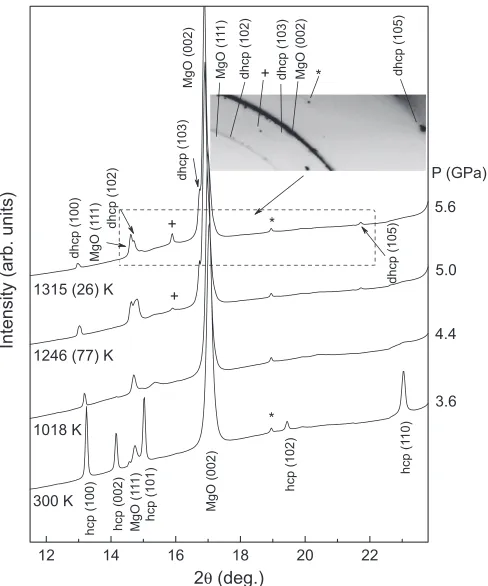
The ADXRD patterns collected from the laser-heated samples revealed the clear existence of only the hcp and bcc phases below the melting curve, with some evidence of a third phase in the vicinity of 5 GPa and 1200 K, which is shown in Fig. 4. This is the same region of the phase diagram in which Errandoneaet al.[19] reported the existence of the dhcp phase. While the diffraction patterns obtained near 6 GPa and
12 14 16 18 20 22
* +
MgO (1
1
1
)
dhcp (102) dhcp (103) MgO (002) dhcp (105)
3.6 4.4
MgO (002)
dhcp (103)
dhcp (102)
MgO (1
11
)
dhcp (100)
dhcp (105)
hcp (1
10)
hcp (102)
MgO (002)
MgO (1
11
)
hcp (101)
hcp (002)
1315 (26) K
1246 (77) K
1018 K
Intensity (arb. units)
2θ(deg.)
300 K
hcp (100)
*
P (GPa)
5.6
5.0 *
+
[image:5.608.315.559.68.361.2]+
FIG. 4. Integrated diffraction patterns obtained on laser heating Mg from 300 to 1315 K at 3.6 to 5.6 GPa. Two diffraction peaks, which can be indexed as the (103) and (105) peaks from a dhcp structure, appear at 1246 (77) K and are indexed in the highest-temperature profile. Two additional reflections, not fit by the dhcp structure, appear at 15.9◦(2.24 ˚A) and 25.6◦(1.40 ˚A), and the lowest-angle of the two peaks is highlighted with a+symbol. The inset shows part of the two-dimensional diffraction image collected at 1315 K, illustrating the spotty texture of the sample peaks.
1200 K contain some of the features expected from the dhcp structure, there are also two additional diffraction peaks atd
spacings of 2.24 and 1.40 ˚A, which are explained by neither the hcp or dhcp phase. These two peaks were not observed by Errandonea et al.[19]. All of the additional peaks were still observed after the sample was cooled to RT, as observed previously by Errandonea et al. [19], and analysis of their positions and relative intensities showed that they do not arise from the formation of the Cu-Mg alloys Cu2Mg or Mg2Cu, assuming that the crystal structures of these alloys at 5 to 6 GPa is the same as that at ambient pressure. Attempts to index all of the observed diffraction peaks as coming from a single phase were also unsuccessful, and we cannot therefore make any definitive statement on the existence, or otherwise, of the dhcp phase. Only the lowest-pressure of our twelve samples showed any evidence of this phase, and further detailed investigations of this region of the phase diagram are required.
0 20 40 60 80 100 500
1000 1500 2000 2500 3000 3500 4000 4500 5000
hcp-bcc boundary [4] hcp-bcc boundary [6] dhcp boundary [19] dhcp, laser [19] melt curve [16] melt curve [14] shock melt [42] melt, laser [16] hcp, resistive
hcp-bcc, resistive bcc, resistive hcp, laser hcp-bcc, laser bcc, laser melt, laser unknown, laser melt curve hcp-bcc boundary
dhcp
T
e
mperature (K)
Pressure (GPa) bcc
[image:6.608.51.296.68.385.2]hcp liquid
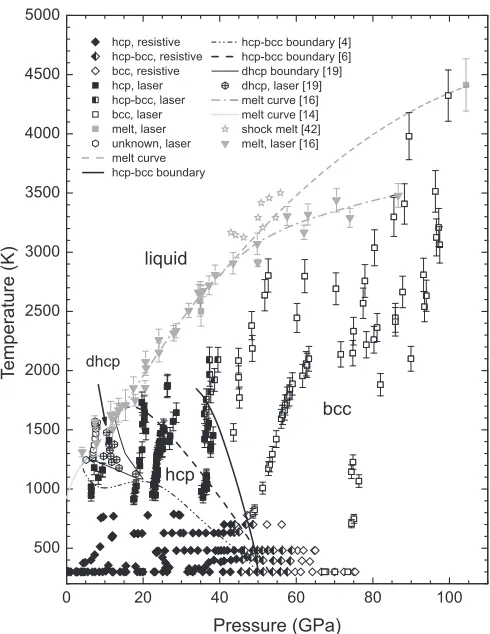
FIG. 5. TheP-T phase diagram of Mg to 105 GPa and 4500 K. hcp-phase points are shown in black, bcc-phase points are shown using unfilled symbols and mixed-phase points are shown using half-filled symbols. Points where melting is observed are plotted with gray-filled symbols. Data plotted with square symbols are from the laser-heating portion of this study, and diamond symbols plot the resistive-heating data. The circular symbols with crosses around 15 GPa and 1300 K are those labeled dhcp in Errandoneaet al.[19]; points where extra diffraction peaks were observed in this study are shown as open circles. The data plotted with stars near 50 GPa and 3500 K show the melt points from Urtiew and Grover [39]. Gray, downward-pointing triangles show the melting points from Errandoneaet al.[16], with the gray dot-dash line showing the fit to these data from the same work. The gray dashed line at higher temperature is an extension to the Errandonea et al. melt line above 50 GPa, extrapolated to give the best agreement with the present data. The black lines at lower pressures show the hcp-bcc phase boundaries of Moriarty and Althoff [4] (dotted) and Mehtaet al.[6] (dashed), with the solid black line showing the phase boundary determined in the current study.
line is thus more vertical at higher temperatures than those calculated by Moriaty and Althoff [4] and Mehtaet al.[6], and we can estimate that the hcp-bcc-liquid triple point is around 25 GPa and 2100 K. All of the present results are combined with previous studies of transitions and melting of Mg into the comprehensive phase diagram of Mg to 105 GPa shown in Fig.5.
The bcc phase was clearly observed at both 89 GPa and 3980 K and at 97 GPa and 4320 K, above the melting line of Errandoneaet al.[16]. A modification of the melting curve to account for these points is given in Fig. 5. There are two
possible reasons for the discrepancy in the two data sets. First, Errandoneaet al.detected melting by using the speckle method, where the onset of melting is detected by observing movement at the Mg surface. Detecting this movement becomes more difficult as pressure increases (among other things because the viscosity of the liquid increases). Also, recrystallization may occur at temperatures significantly below the melting temperature, leading to movement that is similar to the motion from melting. As a consequence of this, the melting temperature may have been underestimated beyond 60 GPa. Second, in laser heating there are axial temperature gradients in the sample, even when using double-sided heating. The center of the sample will therefore be cooler than the surface, and the temperature is measured from the surface. It is thus possible that, even after the onset of melting at the surface, the center of the sample is still a solid and still diffracting. It should be noted that the disagreement with the data of Errandoneaet al.is pri-marily due to a single point in their work at 87 GPa and 3480 K. The upper part of the error bars of the rest of the data give reasonable agreement with the lowest part of the current data.
VI. CONCLUSIONS
The phase diagram of magnesium has been extended to 211 GPa at room temperature, and to 105 GPa at 4500 K. At 300 K, the onset of the hcp to bcc phase transition is observed at 46 to 50 GPa, probably dependent on how hydrostatic the sample in each cell is. The bcc phase was found to be stable to 211 GPa. The extended pressure range of our measurements and the correction of our data for the effects of nonhydrostatic pressures has enabled us to determine a more accurate EoS for the bcc phase. From our resistive-heating studies, the slope of the hcp-bcc phase boundary has been determined experimentally for the first time and is of the order of−130 K/GPa. While the negative slope is in agreement with the theoretical predictions of Moriarty and Althoff, and Mehta et al. [4,6], the experimental phase boundary is noticeably more vertical than the results of the calculations above 800 K. Our new melting-temperature data to 100 GPa do not repro-duce the previously reported sharp change in the slope of the melting curve around 50 GPa. Rather, we observe only a slight change in the slope with pressure, such that, at 100 GPa, the melting temperature is 4300 K, some 800 K higher than previ-ously reported. This difference in temperature probably results from the different methods used to detect the onset of melting. Finally, the additional diffraction peaks reported by Erran-doneaet al.[19] in the vicinity of 10 GPa and 1300 K are also observed in the current study and, as in that study, these peaks are found to remain on cooling back to room temperature. However, we cannot assign all of the peaks to the dhcp structure suggested by Errandoneaet al.[19]. The origin of these peaks, and whether they come from a further phase of Mg, is therefore still unknown and a further detailed study of the Mg phase diagram in the region of 10 GPa and 1300 K is still required.
ACKNOWLEDGMENTS
under Award No. DE-NA0001974 and DOE-BES under Award No. DE-FG02-99ER45775, with partial instrumen-tation funding by NSF. APS is supported by DOE-BES, under Contract No. DE-AC02-06CH11357. This work was performed under the auspices of the U.S. Department of Energy by Lawrence Livermore National Laboratory in part under Contract W-7405-Eng-48 and in part under Contract DE-AC52-07NA27344. CBritish Crown Owned Copyright
2014/AWE. Published with permission of the Controller of Her Britannic Majesty’s Stationery Office. M.I.M. is grateful to A.W.E. Aldermaston for the award of a William Penney Fellowship. D.E. thanks the financial support of the Spanish MINECO under Grant No. MAT2013-46649-C04-01 and by Generalitat Valenciana and Grant No. ACOMP/2014/243. We would like to thank Heribert Wilhelm and Annette Kleppe at I15 at the Diamond Light Source for their support.
[1] A. K. McMahan,Physica B+C (Amsterdam)139,31(1986). [2] J. D. Althoff, P. B. Allen, R. M. Wentzcovitch, and J. A. Moriarty,
Phys. Rev. B48,13253(1993).
[3] R. Ahuja, O. Eriksson, J. M. Wills, and B. Johansson,Phys. Rev. Lett.75,3473(1995).
[4] J. A. Moriarty and J. D. Althoff,Phys. Rev. B51,5609(1995). [5] G. R. Chavarria,Phys. Lett. A336,210(2005).
[6] S. Mehta, G. D. Price, and D. Alf`e,J. Chem. Phys.125,194507
(2006).
[7] Q. Liu, C. Fan, and R. Zhang, J. Appl. Phys. 105, 123505
(2009).
[8] C. J. Pickard and R. J. Needs,Nat. Mater.9,624(2010). [9] Y. Yao and D. D. Klug,J. Phys.: Condens. Matter24,265401
(2012).
[10] N. Nishimura, K. Kinoshita, Y. Akahama, and H. Kawamura,
in Procedings of the 20th AIRAPT International Conference
on High Pressure Science and Technology(Mineralogical Soc.
America, Karlsruhe, 2005), pp. T10–P054.
[11] H. Olijnyk and W. B. Holzapfel,Phys. Rev. B31,4682(1985). [12] A. K. McMahan and J. A. Moriarty, Phys. Rev. B27, 3235
(1983).
[13] P. Li, G. Gao, Y. Wang, and Y. Ma,J. Phys. Chem. C114,21745
(2010).
[14] G. C. Kennedy and R. C. Newton, Solids Under Pressure
(McGraw-Hill, New York, 1963).
[15] D. Errandonea,J. Appl. Phys.108,033517(2010).
[16] D. Errandonea, R. Boehler, and M. Ross, Phys. Rev. B 65,
012108(2001).
[17] There is a typographical error in Ref. 16, where the gradient of the melting curve is stated to be 6 K/GPa. The true value of 45 K/GPa is clear from Fig. 1 of Ref 16.
[18] D. Milathianaki, D. C. Swift, J. Hawreliak, B. S. El-Dasher, J. M. McNaney, H. E. Lorenzana, and T. Ditmire,Phys. Rev. B 86,014101(2012).
[19] D. Errandonea, Y. Meng, D. H¨ausermann, and T. Uchida,
J. Phys.: Condens. Matter15,1277(2003).
[20] H. Cynn, W. Evans, C. S. Yoo, Y. Ohishi, N. Sata, and O. Shimomura,APS March Meeting, 22–26 March 2004, Sec.
W20.009(2004).
[21] R. Boehler and K. De Hantsetters,High Pressure Res.24,391
(2004).
[22] Z. Jenei, H. Cynn, K. Visbeck, and W. J. Evans, Rev. Sci. Instrum.84,095114(2013).
[23] G. Y. Shen, M. L. Rivers, Y. B. Wang, and S. R. Sutton,Rev. Sci. Instrum.72,1273(2001).
[24] R. Boehler, H. G. Musshoff, R. Ditz, G. Aquilanti, and A. Trapananti,Rev. Sci. Instrum.80,045103(2009).
[25] A. P. Hammersley, S. O. Svensson, M. Hanfland, A. N. Fitch, and D. H¨ausermann,High Pressure Res.14,235(1996). [26] A. Lebail, H. Duroy, and J. L. Fourquet,Mater. Res. Bull.23,
447(1988).
[27] A. Coelho, Topas Academic Version 4.1. Computer Software (Topas Academic, Coelho Software, Brisbane, 2007).
[28] H. Cynn (unpublished).
[29] A. K. Singh and T. Kenichi,J. Appl. Phys.90,3269(2001). [30] T. Kenichi and A. K. Singh,Phys. Rev. B73,224119(2006). [31] S. Speziale, C.-S. Zha, T. S. Duffy, R. J. Hemley, and H.-K.
Mao,Geophys. Res.106,515(2001).
[32] Y. Tange, Y. Nishihara, and T. Tsuchiya, J. Geophys. Res.114, B03208 (2009).
[33] P. Vinet, J. Ferrante, J. H. Rose, and J. R. Smith,Geophys. Res. 92,9319(1987).
[34] R. Angel, in High-Temperature and High-Pressure Crystal
Chemistry, Vol. 41 ofReviews In Mineralogy & Geochemistry
(Mineralogical Society of America, Washington D.C., 2000), pp. 35–59.
[35] A. Lazicki, A. Dewaele, P. Loubeyre, and M. Mezouar,Phys. Rev. B86,174118(2012).
[36] C. L. Guillaume, E. Gregoryanz, O. Degtyareva, M. I. McMahon, M. Hanfland, S. Evans, M. Guthrie, S. V. Sinogeikin, and H.-K. Mao,Nat. Phys.7,211(2011).
[37] D. Santamar´ıa-P´erez, M. Ross, D. Errandonea, G. D. Mukherjee, M. Mezouar, and R. Boehler, J. Chem. Phys. 130, 124509
(2009).
[38] S. Anzellini, A. Dewaele, M. Mezouar, P. Loubeyre, and G. Morard,Science340,464(2013).