International Journal of Emerging Technology and Advanced Engineering
Website: www.ijetae.com (ISSN 2250-2459, Volume 2, Issue 11, November 2012)151
Land Use Mapping Using Remote Sensing & GIS Techniques
in Naina - Gorma Basin, Part of Rewa District, M.P., India
Vimla Singh
1, Alok Dubey
2 Research Scholar(JRF) 1,Professor2,GIS and RS Division, Department of Geography, University of Allahabad, Allahabad, 211002, U.P., India Abstract - The purpose of this study is to develop the land
use of Naina - Gorma river basin that is an important natural resource and supplies water to the living beings of the area. Remote sensing technique helps to assess several water quality parameters, land use classifications & Remote sensing data helps to provide reliable and accurate basic information for land use mapping. GIS helps in acquiring, storage of data and database management. A study is carried out to delineate the land use classes in part of the Rewa district (M.P.), adjoining place of the study area is Allahabad dist.(U.P.), comprises the North-Eastern, Southern (mainly SE) portion of the Rewa district. Study area is lies between 24° 35’ 00’’ N to 24° 57’ 30’’ N of latitudes and 81° 37’ 30’’E to 82°15’ 00’’ E of longitude with about the total area coverage of 1419.71 sq. km. For this study the ERDAS Imagine 8.6 computer software used to develop a land use classification using IRS 1-C, LISS III, image. Unsupervised classification, ISODATA clustering method is use to classify the image and visual image interpretation approach used to delineate the land use classes. The present study is focus on demarcating boundaries of different land use / land cover units from an analysis, with the help of SOI toposheet, and Satellite images on 1:50,000 scale, divides the study area into forest, open scrub, dense scrub, Agricuture (agr. crop area), Rocky/Stony waste land, Sandy soil / land / patches, Settlement, River, and other water bodies (lake / pond etc.).
Keywords – Naina - Gorma river basin, Remote sensing technique, GIS, Unsupervise classification, ISODATA
clustering, ERDAS Imagin.
I. INTRODUCTION
In the present day, Land Use and Land Cover mapping is of great significance in scientific, research, planning and management. Regional land use pattern reflects the character of interaction between man and environment and influence to the mankind’s basic economic activities. Due to Advancement in satellite sensors, their analysis techniques are making remote sensing systems fruitful, realistic and attractive for use in research and management of natural resources. Land use map is a valuable tool for agricultural and natural resources studies, updation of these maps are essential due to strength of natural resources, Remotely sensed satellite images provides a synoptic overview of the terrain or earth in a very short time span.
This leads to quick and truthful representation of the real world in the best possible way. Remote sensing provides land resource data in the digital form & different bands of the electromagnetic spectrum. Availability of such type data in different bands makes it very useful & easy way for delineation of land use / land cover classes. Land cover mapping both by visual interpretation and digital analysis is possible by satellite remote sensing techniques. The classification system facilitates the planners and researchers to study the spatial difference and distinction between various lands are types, from multi temporal satellite data.
International Journal of Emerging Technology and Advanced Engineering
Website: www.ijetae.com (ISSN 2250-2459, Volume 2, Issue 11, November 2012)152
In this study unsupervised classification method were used, for land use / land cover map. This method is the identification of natural groups, or structures, within multispectral data.
II. AIM &OBJECTIVES
The aim of this study is to produce a land use/ land cover map of Naina- Gorma basin, Rewa dist., for regional planning, management and understanding the earth as system. By using remote sensing techniques to identify the land use of Naina - Gorma basin.
i. To create a land use / land cover map
ii.To determine the trend, nature, rate, location and magnitude of land use / land cover change
iii. To generate data on land consumption rate
iv.Make comparison between the distribution of land use areas to identify which is the most Predominant in the watershed (agriculture, settlement / urban area, forest, etc.)
v. To evaluate the socio – economic implications of predicted change
III. STUDY AREA
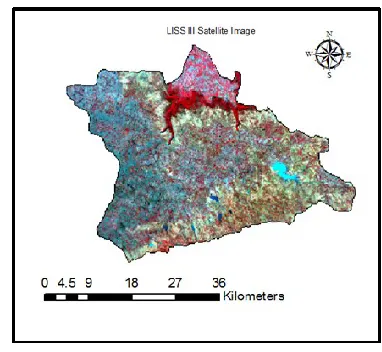
Study area, located in the part of Rewa district (M.P.), comprises with the North - Eastern To South - Eastern portion of the Rewa and lies between 24° 35’ 00’’ N to 24° 57’ 30’’ N of latitudes and 81° 37’ 30’’E to 82°15’ 00’’ E of longitude with total area coverage of 1419.71 sq. km. Study area is bounded by Belan river in the North, which makes the northern boundary of the area and river Son is situated in the south which makes southern boundary of the study area(Fig.1(a) & (b)). The landscape of the region has undulating topography, this means it is located on a highly denuded Vindhyan upland and is crested by two rivers, the river Naina and Gorma, tributaries of Belan which flows in North – South direction. Both series of Vindhyan range is present here viz. lower and upper Vindhyan. Small Northern portion has plain topography, but major portion has steep slope, covered with open mixed forest, plain portion covered with agricultural crop and settlement. Southern small part has Rewa plateau and Kaimur range, running parallel to Son river. Scattered bamboo trees are present in whole basin area with open and dense scrub. The basin is comprised of quartzitic sandstone, siltstone and shales. The large part of the area is rocky, barren and sandy i.e. unsuitable for agriculture purpose.
Fig 1. (a) Location of The Study Area
(b) Study Area on IRS-1C LISS III Satellite Image (FCC) Source: (http//www.nrsc.gov.in)
Data Used
[image:2.612.346.537.333.509.2]International Journal of Emerging Technology and Advanced Engineering
Website: www.ijetae.com (ISSN 2250-2459, Volume 2, Issue 11, November 2012)153 Methodology
The work is done by visual image interpretation approach. The following steps are involved in the classification procedure.
a. Data acquisition, loading, merging and georeferencing.
b. Ground data collection.
c. Unsupervised classification by ISODATA clustering method.
d. Identified features with the help of tone, texture, pattern and association.
e. Recode to all features and classify the image in different classes.
f. Generation of statistics from the classified outputs. The process of georeferencing has been done, using Survey of India (SOI) topographical maps by identifying the ground control points (GCP) from the maps and the corresponding points on the image and finally applying the map-image transformation model. The interpretation key was based on the relationships between ground features and image elements like texture, tone, shape, location and pattern.
The classification of the image was performed by using unsupervised classification. In this type of classification spectral classes are grouped first, based on the numerical information of the data, and are then matched. Rather it involve algorithms called clustering algorithms, that examine the unknown pixels in an image and aggregate them into a number of classes based on the natural groupings or clusters present in the image values, & specifies the desired number of classes. ISODATA clustering method uses to perform unsupervised classification, using ISODATA algorithm. The ISODATA clustering method uses the minimum spectral distance formula to form clusters. The ISODATA utility repeats the clustering of the image until either a maximum number of iterations has been performed. 60 classes, with 10 iteration and 95% convergence value were selected to perform unsupervised classification in this study, following classification we recoded to satellite image and form nine classes.
Unsupervised classification is simpler than a supervised classification because the signatures are automatically generated by the ISODATA algorithm, with the help of visual interpretation and standard interpretation characteristics keys such as tone or color, shape, size, texture, shadow, pattern site or aspect, resolution and various associated features etc., identified the features.
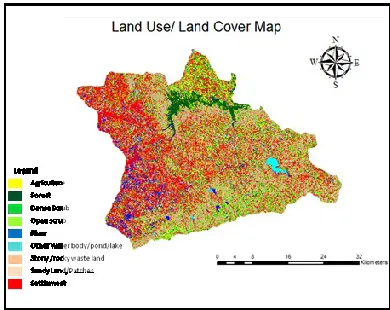
Result & Discussion Land use / Land Cover Map
The term Land use relates to the manner in which human beings employ the land and its resources or to the human activity or economic function associated with specific piece of land & Land cover is a term that relates to the type of features present on the surface of earth or implies the physical or natural state of the Earth surface. Land use and land cover information are important for several planning and management activities concerned with the surface of the earth (Lillesand and Keifer, 1994; Smits et al., 1999).
[image:3.612.345.540.465.620.2]There are a number of different units that contain several features/ inclusions. These inclusions couldn't be separated because of their small extents. So approximations of inclusions are based on the colour tone reflected on the scene and proportion of their extent. The land use/land cover types are classified as follows and details of Land use/Land cover statistics of study area is given in the table1 and overall units are shown in the figure 2 & the percentage distributions of all classes shows by fig 3.
International Journal of Emerging Technology and Advanced Engineering
Website: www.ijetae.com (ISSN 2250-2459, Volume 2, Issue 11, November 2012) [image:4.612.43.275.156.689.2]154
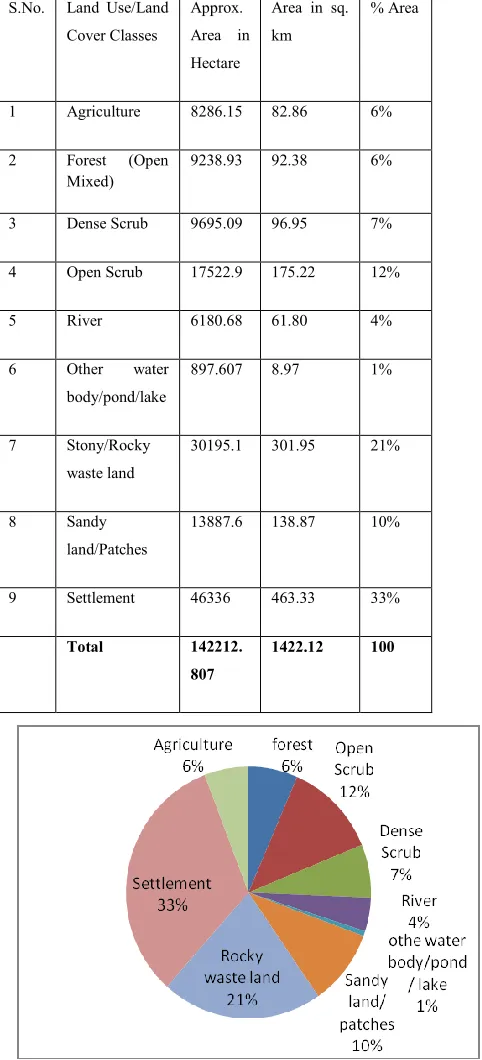
Table 1
Land use/Land Cover statistics of study area
S.No. Land Use/Land Cover Classes
Approx. Area in Hectare
Area in sq. km
% Area
1 Agriculture 8286.15 82.86 6%
2 Forest (Open Mixed)
9238.93 92.38 6%
3 Dense Scrub 9695.09 96.95 7%
4 Open Scrub 17522.9 175.22 12%
5 River 6180.68 61.80 4%
6 Other water
body/pond/lake
897.607 8.97 1%
7 Stony/Rocky waste land
30195.1 301.95 21%
8 Sandy
land/Patches
13887.6 138.87 10%
9 Settlement 46336 463.33 33%
Total 142212.
807
1422.12 100
Fig.3 Distribution of Land use/Land Cover Classes
IV. FOREST AREA
The area of forest cover is usually associated with high relief, specially in Vindhyan region, presenting a prominent and distinct texture. They have brighter tone of brown & red colour Forest cover is a open mixed jungle type mainly composed of bamboos, It occupies 92.38 sq. km (6%) of total study areas. There are mainly two forest reserve are present in the study region viz. Dhakra & Salaiya reserve forest.they are well recognize in the North of the study region.Forest land represent areas that have a tree crown or areal density of 10 % or > 10.
Open Scrub
They are well recognized in the all part in the study region, but maximum are in these are associated with both hills and agricultural land. They have mixed tone of light brown and red & mainly present in North, cental , East, and North west region. It occupies 175.22 sq. km. (12 %) of total study area. Open scrub have mid-dense foliage cover (30–70%). They are associated with grasses, herb and geophytes.
Dense Scrub
In the study area dense scrub is present in everywhere with the open mixed forest. It occupies 96.95 sq. km. (7%) of total study area, present in northern part of the study area.
V. AGRICULTURAL AREA/CULTIVATED AREA
The observation with the help of the image interpretation reveals that the area under study is predominantly an agricultural region. In study area maximum areas come under poor cultivation because of whole areas comes in plateau or rocky region. Agricultural area is mainly present in North, central and NW part of the study area. It occupies 82.86 sq. km (6%) of the total study area
.
The cultivated area can be sub-grouped as:
Good cultivation
This unit covers a small extent of the study area, These areas are mainly of low plains of the region. The village like Bahricha, Pathariya, & Kadhiyava, etc in the north, Dubgawn, Chaukara and Thuriha in central, & Misira, Bhadawal and Tikurdosi in NW part characterized with this type of cultivation. This unit has a bright red tone.
Moderate cultivation
[image:4.612.44.285.161.691.2]International Journal of Emerging Technology and Advanced Engineering
Website: www.ijetae.com (ISSN 2250-2459, Volume 2, Issue 11, November 2012)155 Poor cultivation
Crop growing conditions are less favourable in these areas, such areas appeal on imagery by light to very light red tone mixed with yellow and brown patches. The village like Khormani, Balbhadragarh and Bahiyari, Bamangarh etc. is completely characterized with this type of cultivation.
Stony / Rocky waste land
Waste land is described as degraded land, which can be brought under vegetation cover with reasonable effort. This unit have patches are registered more in white color and a little of yellow or brown color on the whole imagery especially in north and middle portion of the imagery. The study area comes under plateau region, so maximum portion of the waste land is categorized under barren rocky waste. It occupies 301.95 sq km (21 %) of the total study area.
Sand patches
Area under sand bar, point bar etc. are considered as land not suitable for cultivation. These land patches can easily be marked with light tone. Numerous sand patches can be observed in, Naina-Gorma basin, in odda river and water fall , bihar nala , amda nala and various other. Which are created by drying up vast channel generally in undated during rainy season. They are open surface which generally register higher reflectance. However at some places they are being cultivated by inferior crops but the production of such crops mostly depends on the availability of moisture to be received by winter season. It occupies 108.87sq km (10%) of the total study areas. This area also includes salt affected area or saline patches.
Land not available for cultivation
This category includes the area under non-agricultural uses i.e. settlements, roads, water bodies (Ponds, canals, river/streams etc.). The total area not available for cultivation is 66.4 sq km (9.46%) of the total land area.
Settlement
They are mainly located in northern, middle, South-western, North western part of the study area. In study area most suitable area for human occupanc are form the flat river valleys and basins of the Belan. The identification of settlement in satellite imagery was based on tone and colour. They have tone of grayish & light bluish colour. It occupies 463.33 sq km (33%) of the total study area.
The large settlement of study area like Gadarpurwa, Katra, Nevrhiya, Simriha, Mahauta, Pathraula, Devipur, Lalganj, Badgawn etc. have been marked on the land use/land cover map with the help of imagery. This unit includes roads & other infrastructure related to human beings.
VI. ROADS
Roads are recognized due to their linear shape and dark tone but difficulties arise in recognition of these features to separate them with other linear features like canals. However the distinction between road and canals have been made with the facts that the canals have their linkage to tributaries and some pumping station .At some places these features have been mapped with the help of ground checks and information received from Survey of India toposheet, on the denuded hilly ranges where settlements are scattered, unmettled roads are the only mean of human traffic, which is early recognized on the imagery. These tracks are covered under bushes grasses during every season.
VII. WATER BODIES
The streams/rivers, canals, ponds etc. is considered under this category. The prominent streams/river, ponds /lakes/Nala are easily detected on satellite imagery by their black and dark blue tones. Ponds are mainly found in south and south east portion of the study area. Belan river, along with their tributaries Naina, Gorma & Odda etc. drain the area. Canals are easily recognized in the South - western & Eastern part of the imagery.
Water bodies related to study area are-
River/Streams and Canal
Rivers are the excellent source of fresh water, plays important role in drinking water for living beings. This unit has occupied 61.80 sq km (4.00%) of total study area.
Other water bodies
Water is the most important factor of life play vital role in crop irrigation and other daily uses of living beings, this unit explains lake, pond etc. it occupies 8.97 sq. km (1%) of the total study area.
VIII. CONCLUSION
International Journal of Emerging Technology and Advanced Engineering
Website: www.ijetae.com (ISSN 2250-2459, Volume 2, Issue 11, November 2012)156
Today, Land Use and Land Cover mapping has a great significance in scientific research, in planning and in management. Regional land use pattern represent the character of interaction between man and environment and influence the resources based on mankind’s basic economic activities. Remotely sensed satellite images provide synoptic coverage &overview of the whole region. It provides coordinate relationship among transportation, residential, industrial and recreational land uses, besides providing broad-scale inventories of natural resources and monitoring environmental issues, including land reclamation, and restoration, disaster management, water quality and planning, economic development. Land Use Land Cover maps helps in planning in effective and best possible way, and in utilization of its resources besides providing a comprehensive view of the total area Land use/Land cover has been mapped through satellite imagery and for uses of land has been shown as forest land, land under cultivation (agriculture land), land not suitable for cultivation (barren or rock land) and land not available for cultivation (settlement/urban built up etc). Three types of cultivated land has been mapped, under the agricultural land according to tone and texture and has been categorized as good moderate and poor, which cover about 6% of the total study area. Barren land with bare exposed rocks, Barren rock outcrop with scrub and grass, sand patches and salt affected areas as the land not suitable for agriculture while settlement, road, water bodies etc, comes under the area which is not available for cultivation. There have been marked changes in the land use/land cover under uncultivated areas and built up areas. New developments have been found due to improvement of saline patches and barren land through new agricultural techniques. Deforestation of the areas and rapid rate of urbanization have resulted marked changes in the settlements, roads etc. unsupervised classifications were conducted to define land cover and land use types for the area.
The resulting products of the exploratory analyses and classification were used to assess spatial patterns of land cover and land use mapping of the area.
Acknowledgements
The first authors express gratitude to Dr. Alok Choudhary, Sr. scientist, MPCST, Bhopal for their guidance and help in this work and say thanks to my senior’s, Department of Geography, University of Allahabad, and my husband Dr. Shravan Kumar Singh, Scientist, INMAS DRDO, Delhi, for their constant encouragement and motivation.
REFERENCES
[1 ] Singh Prafull and Singh Shelendra (2011), Landuse Pattern Analysis Using Remote Sensing: A Case Study of Mau District, India, Journal of Applied Science & Research 3 (5), pp.10-16.
[2 ] Rai Praveen Kumar, Rai Vinay Kumar, Land Use Mapping using Remote Sensing & GIS Techniques in a Part of Son Basin, Sonbhadra District, U.P. Department of Geography, Banaras Hindu University, Varanasi-221005.
[3 ] Lillisand, T.M. and Kiefer, R.W. (2000): Remote Sensing and Image Interpretation 4th ed. John willey and sons, New York.
[4 ] Singh Sudhir Kumar, Singh Chander K, Mukherjee Saumitra(2010), Impact of land-use and land-cover change on groundwater quality in the Lower Shiwalik hills: a remote sensing and GIS based approach, Cent. Eur. J. Geosci. 2(2), pp.124-131.
[5 ] Indira Gandhi Conservation Monitoring Centre report on “Landuse/ Landcover Mapping using Remote Sensing & GIS Techniques in Balpakram Baghmara Community Conservation Landscape - Meghalaya” Samrakshan Trust , September 2005.
[6 ] E. Boakye, S. N. Odai, K. A. Adjei, F. O. Annor, Landsat Images for Assessment of the Impact of Land Use and Land Cover Changes on the Barekese Catchment in Ghana, European Journal of Scientific Research ,Vol.22 No.2 (2008), pp.269-278.