Journal of Chemical and Pharmaceutical Research, 2015, 7(8):885-896
Research Article
ISSN : 0975-7384
CODEN(USA) : JCPRC5
Excess parameters of binary liquid mixtures of ethyl benzoate with o-xylene,
p-xylene and o-chlorotoulene at different temperatures
G. Lakshmana Rao, P. B. Sandhya Sri, G. R. Satyanarayana, K. A. K. Raj Kumar
and C. Rambabu
*Department of Chemistry, Acharya Nagarjuna University, Guntur, Andhra Pradesh, India
_____________________________________________________________________________________________
ABSTRACT
Densities, ultrasonic velocities and viscosities of binary liquid mixtures of ethyl benzoate with o-xylene(OX), p-xylene(PX) and o-chlorotoulene(OCT) have been measured at 303.15K, 308.15K, 313.15K and 318.15K temperatures over the entire composition range of mole fractions. These components are selected to study the effect of substituent and effect of certain positions on different thermodynamic parameters of the mixtures. Using these
experimental values, excess molar volume (VE), deviation in adiabatic compressibility (Δβad), excess free length(Lf
E
)
and deviation in viscosities(Δη) are calculated. These excess parameters are fitted to Redlich-Kister type polynomial
equation. The values of parameters obtained are calculated along with the standard deviation (σ).
Key words: Densities, ultrasonic velocities, viscosities, excess molar volume, deviation in adiabatic compressibility,
excess free length and deviation in viscosity and molecular interaction.
_____________________________________________________________________________________________
INTRODUCTION
The knowledge of physical and chemical properties of non-aqueous binary liquid mixtures has relevance in theoretical and applied areas of research. The binary mixtures of aromatic hydrocarbons are very useful because they find many applications in the studies of preferential interaction of polymers and polymer phase diagrams and in mixed solvents [1, 2]. Esters are one of the special kinds of chemicals with sweet odor and less toxic nature. They have many industrial applications in perfumes, cosmetics etc. Aromatic hydrocarbons like xylenes are frequently used as octane enhancers in vehicle fuels. Hence it is very interesting to study the effect of xylenes on the physical and chemical properties of ethyl benzoate by mixing them in different proportions at different temperatures.
The excess properties of binary liquid mixtures have proved to be very useful indicator of the existence of significant effects resulting from intermolecular interactions [3, 4]. The advantage of in-depth and wide study of this inter-relationship is twofold: first, it provides experimental background to develop, test and improve thermo dynamical models for calculating and predicting fluid phase equilibria; second, it offers a wide range of possibilities for continuous adjustment of physical properties of a given solvent [5].
_____________________________________________________________________________________
into consideration and its related parameters, We selected this sytem for our study. As mentioned earlier, ethyl benzoate has several industrial applications and xylenes are also aromatic compounds. o-chlorotoulene is similar compound but with a difference in one substitute. Because of these aspects, We chose two xylenes and o-chlorotoulene for comparative study of molecular interactions with ethyl benzoate.
Experimental techniques and materials used
Ethyl benzoate, o-cresol, p-cresol and o-chlorotoulene obtained from Merck were purified as described in the literature [6, 7]. The purity of the samples was checked by comparing the measured densities with those reported in the literature [8-11] and these are given in Table 1.
The density was measured with a pycnometer having a bulb volume of about 25 cm3 and an internal capillary diameter of about 1 mm. The density was then determined from the mass of the sample and the volume of pycnometer is used to determine the density. Uncertainties in density measurements were estimated to be within ± 0.0001 g cm-3. The viscosity was measured using a commercial Ubbelohde capillary viscometer of 0.55 mm diameter calibrated with double distilled water at temperatures of 303.15, 308.15, 313.15 and 318.15K.
Table-1: Comparison of experimental densities (ρ), viscosities (η) and velocities (U) with literature values at 303.15K, 308.15K, 313.15K and 318.15K
Liquid Density10-3(kgm-3) Viscosity (mPa s) Velocity (m s-1)
Exp. Lit. Exp. Lit. Exp. Lit. Ethyl benzoate (EB) 303.15 K 1.0392 1.042a 1.7512 1.7495a 1346.2 1345.4a o-xylene (OXL) 303.15 K 0.8705 0.8707b 0.728 0.705c 1336.2 1138.75b
p-xylene (PXL) 303.15 K 0.8528 0.8528b 0.579 0.5782c 1286.3 1288.43b o-chlorotoluene (OCT) 303.15 K 1.0728 1.0725d 0.870 0.885d 1283.8 1283.8d
aRef [8], bRef [9], c Ref [10], d Ref [11]
Theoretical Considerations:
Assuming that ultrasonic absorption is negligible, adiabatic compressibilities can be obtained from the densities and ultrasonic sound velocities using the relation
βad = (ρu 2
) -1 ……….. (2)
The molar volumes of the binary mixtures were calculated using the equation
V = (X1M1+X2M2 ) / ρ ……….. (3)
Intermolecular free length (Lf) has been evaluated by Jacobson’s formula
Lf = K/ uρ1/2 ………… (4)
where K is the temperature dependent Jacobson constant and T is the absolute temperature.
The strength of interaction between the component molecules of binary mixtures is well reflected in the deviation of the excess functions from ideality. Thermodynamic excess functions are found to be very sensitive towards mutual interactions between component molecules of liquid mixtures. The sign and extent of deviation of these functions from ideality depends on the strength of interaction between unlike molecules.
The excess properties such as ∆βad,, V
E , ∆η and L
fE have been calculated using the equation
YE = Ymix - (X1Y1+X2Y2) ………. (5)
where YE is ∆βad or V E
or ∆η or Lf E
, and X represent mole fraction of the component and subscripts 1 and 2 stand for the components1and 2. These excess functions were fitted to Redlich - Kister type polynomial equation [12].
YcalE = X1 X2Σ a j-1 (X2-X1 )j-1 ….. (6)
The values of coefficient aj-1 evaluated by the method of least squares with all points weighed equally with the standard deviations are listed in Table 3 and are calculated as
_____________________________________________________________________________________
where m is the number of experimental data points and n is the number of coefficients considered ( n = 5 in the present calculation.)
RESULTS AND DISCUSSION
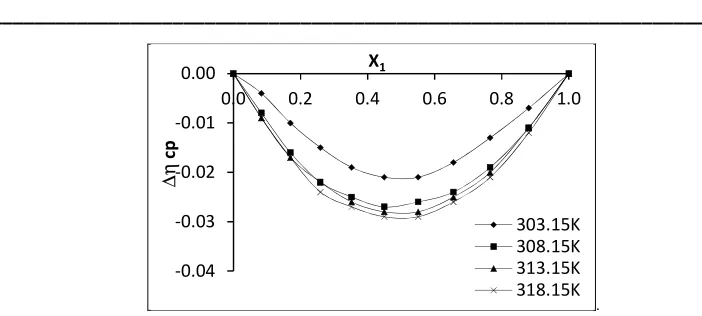
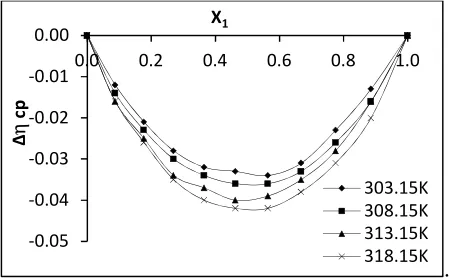
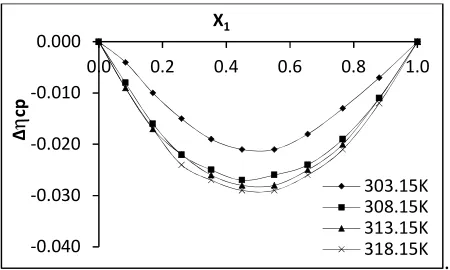
Computed values of VE, ∆βad, LfE, and ∆η along with the experimental values of U, ρ and η are presented in the Tables 2-4. Variations of excess parameters with the mole fraction of EB are represented in the figures 1(a) – 3(d). The sign of VE of a system depends upon the relative magnitude of expansion and contraction of the two liquids due to mixing [12]. The factors that are responsible for expansion of volume on mixing of the components are: (1) Steric hindrance due to branching of chains (2) Formation of weaker solute-solvent bond than solute-solute and solvent-solvent bonds and (3)Dissociation of one component or all components.
The factors that lead to contraction in volume on mixing are: (a) Strong specific interaction usually a kind of chemical interaction. (b)Strong physical interaction such as dipole-dipole or dipole-induced dipole interactions.(c) Occupation of void spaces of one component by the other may be due to when the molecular sizes of the components differ by a large magnitude.
The sign and magnitude of excess molar volume would depend on the relative magnitude of contractive and expansive effect which arises on mixing of liquid components. The negative deviations in excess molar volume (VE) are observed for these three systems. These are caused by some strong interactions between unlike molecules.
In EB molecules two polar bonds viz. >C=O, C-O-C bonds are present. But there is no scope for either of the hydrogen bonding between EB molecules. There are two +I (methyl ) groups on in xylenes and one +I (methyl ) group and one weak –I ( Cl ) in o-chlorotoulene molecules. Due to presence of +I (methyl) groups, xylene molecules are induced with partial charges (Though para xylene dipole moment is zero). This facilitates for dipole – induced dipole interactions between EB molecules and xylene molecules. But in case of o- xylene molecules, the presence of two methyl groups on adjacent positions hinders the approachment (steric hindrance) of other molecules (EB) towards them. Hence weak interaction than in case of p-xylene molecules is possible. The same trend is observed in the present study. Also the same trend was reported by Anil Kumar Nain et.al [14] and Nandibatla V. Sasty et.al [13]. The observations are again supported by the trends observed for excess acoustic impedance (ZE) and excess ultrasonic velocity (UE).
The π-electron density in derivatives of benzene ring depends upon the group that is attached to it. There may be some n…….π interactions between the pair of electrons on carbonyl oxygen of ester and π electron clouds of benzene ring in p-xylene and ortho chlorotoulene molecules. This was supported by C.Yang, W.Xu, and P.Ma [15]. In case of ortho chlorotoulene molecules, one strong +I (methyl) group and one weak –I (Cl) group are present on benzene ring at adjacent positions. Hence less polarization is observed. So weak interactions between orthochlorotoulene molecules and EB molecules are expected. The same is observed in the present study.
For this system a little deviation is observed in all parameters. This can be explained by the following aspects
• Almost similar sizes of EB and OCT molecules. According to Fort and Moore [16] molecules with equal size do not mix thoroughly.
• Due to the presence of one +I and one –I, there is a little possibility for OCT molecules to be polarised. Hence very weak associative forces may be present.
In general, the deviation [17] in adiabatic compressibility can be explained by taking into consideration of the following factors:2
(a)Loss of dipolar association and difference in size and shape of component molecules which lead to decrease in velocity and increase in compressibility.
_____________________________________________________________________________________
TABLE-2
System-I : Ethylbenzoate(X1) + o-xylene(X2)
Ultrasonic velocities, Densities, Viscosities and related excess parameters
Mole fraction X1
Velocity U m/s
Density
ρ( kg/m3) Viscosity η cP VE cm3 mol-1
Δβad×10-12
m2N-1
LfE
(Ǻ) ∆η cP
303.15K 0.0000 0.0857 0.1742 0.2656 0.3601 0.4577 0.5587 0.6632 0.7715 0.8837 1.0000 1336.2 1338.4 1340.3 1341.8 1343.0 1344.0 1344.8 1345.4 1345.8 1346.1 1346.2 870.5 889.0 907.4 925.5 943.3 960.7 977.6 994.1 1009.9 1024.9 1039.2 0.728 0.808 0.892 0.980 1.072 1.170 1.275 1.384 1.500 1.623 1.751 0.0000 -0.2272 -0.4384 -0.6069 -0.7336 -0.8055 -0.8093 -0.7589 -0.6127 -0.3558 0.0000 0.0000 -0.0973 -0.1780 -0.2410 -0.2838 -0.3023 -0.2951 -0.2649 -0.2066 -0.1166 0.0000 0.0000 -0.0019 -0.0036 -0.0049 -0.0058 -0.0062 -0.0061 -0.0055 -0.0043 -0.0024 0.0000 0.0000 -0.0080 -0.0140 -0.0200 -0.0240 -0.0260 -0.0250 -0.0220 -0.0170 -0.0090 0.0000 308.15K 0.0000 0.0857 0.1742 0.2656 0.3601 0.4577 0.5587 0.6632 0.7715 0.8837 1.0000 1312.1 1314.6 1317.2 1319.5 1321.7 1323.6 1325.4 1327.2 1328.8 1330.2 1331.9 869.4 887.9 906.1 924.0 941.5 958.6 975.4 991.5 1006.9 1021.2 1034.8 0.656 0.726 0.801 0.881 0.965 1.055 1.150 1.252 1.360 1.475 1.596 0.0000 -0.2677 -0.4929 -0.6767 -0.8063 -0.8824 -0.9190 -0.8613 -0.7086 -0.4039 0.0000 0.0000 -0.1106 -0.1907 -0.2530 -0.2904 -0.3093 -0.3066 -0.2730 -0.2146 -0.1254 0.0000 0.0000 -0.0023 -0.0040 -0.0053 -0.0062 -0.0066 -0.0066 -0.0059 -0.0047 -0.0027 0.0000 0.0000 -0.0110 -0.0190 -0.0250 -0.0290 -0.0310 -0.0310 -0.0270 -0.0210 -0.0120 0.0000 313.15K 0.0000 0.0857 0.1742 0.2656 0.3601 0.4577 0.5587 0.6632 0.7715 0.8837 1.0000 1293.2 1295.8 1298.3 1300.8 1303.2 1305.5 1307.7 1309.8 1311.8 1313.8 1316.0 867.7 886.4 904.6 922.2 939.7 956.6 973.0 988.7 1003.6 1017.4 1030.6 0.620 0.681 0.746 0.816 0.891 0.971 1.056 1.147 1.244 1.347 1.455 0.0000 -0.3276 -0.5852 -0.7606 -0.9241 -1.0073 -1.0244 -0.9475 -0.7620 -0.4238 0.0000 0.0000 -0.1190 -0.2099 -0.2693 -0.3114 -0.3268 -0.3187 -0.2841 -0.2221 -0.1261 0.0000 0.0000 -0.0026 -0.0045 -0.0058 -0.0068 -0.0072 -0.0070 -0.0063 -0.0050 -0.0028 0.0000 0.0000 -0.0110 -0.0190 -0.0260 -0.0300 -0.0310 -0.0310 -0.0270 -0.0200 -0.0110 0.0000 318.15K 0.0000 0.0857 0.1742 0.2656 0.3601 0.4577 0.5587 0.6632 0.7715 0.8837 1.0000 1273.2 1275.7 1278.4 1281.0 1283.6 1286.2 1288.8 1291.3 1293.8 1296.4 1299.0 865.8 884.5 902.5 920.1 937.3 954.0 970.0 985.4 1000.1 1013.6 1026.0 0.588 0.641 0.699 0.762 0.829 0.901 0.977 1.059 1.147 1.241 1.343 0.0000 -0.3627 -0.6279 -0.8396 -0.9987 -1.0921 -1.0923 -1.0128 -0.8387 -0.4979 0.0000 0.0000 -0.1286 -0.2177 -0.2837 -0.3248 -0.3402 -0.3273 -0.2915 -0.2291 -0.1302 0.0000 0.0000 -0.0028 -0.0048 -0.0063 -0.0073 -0.0076 -0.0074 -0.0066 -0.0052 -0.0030 0.0000 0.0000 -0.0120 -0.0210 -0.0270 -0.0310 -0.0330 -0.0330 -0.0300 -0.0230 -0.0140 0.0000
The strength of the interaction between the components increases/decreases when excess values tend to become increasingly negative/decreasingly positive. This may be qualitatively explained in terms of closer approach of unlike molecules leading to reductions in compressibility and volume. The negative LfE values indicate that sound wave has to travel a shorter distance. It is due to dominant nature of interactions between unlike molecules. The ∆βad and LfE minima occur at the same concentrations further strengthens the occurrence of molecular associations.
The interdependence of intermolecular free length and ultrasonic velocity was evolved from a model for sound propagation proposed by Eyring & Kincaid [18]. The variation of ultrasonic velocity in a solution depends upon the increase or decrease of intermolecular free length after mixing the components. The ultrasonic velocity should decrease if the intermolecular free length increases or vice versa as a result of mixing of components. This fact is observed in the present investigation for Ethyl benzoate (EB) + p-xylene > Ethyl benzoate (EB) + o-xylene >
_____________________________________________________________________________________
temperature at any concentration. The ultrasonic velocity values decrease with increase of temperature due to breaking of hetero and homo molecular clusters at high temperatures [19].
TABLE-3
System-II : Ethylbenzoate(X1) + p-xylene(X2)
Ultrasonic velocities, Densities, Viscosities and related excess parameters Mole
fraction X1
Velocity U m/s
Density
ρ ( kg/m3) Viscosity η cP V
E cm3
mol-1
Δβad×10-12
m2N-1
LfE
(Ǻ) ∆η cP
303.15K
0.0000 1286.3 852.8 0.579 0.0000 0.0000 0.0000 0.0000 0.0874 1293.4 875.9 0.669 -0.6428 -0.1311 -0.0029 -0.0120 0.1772 1299.9 898.3 0.766 -1.1717 -0.2425 -0.0054 -0.0210 0.2697 1306.2 919.9 0.867 -1.5786 -0.3251 -0.0072 -0.0280 0.3648 1312.4 940.6 0.975 -1.8552 -0.3739 -0.0083 -0.0320 0.4628 1318.6 960.3 1.088 -1.9918 -0.3874 -0.0087 -0.0330 0.5638 1324.6 978.9 1.206 -1.9779 -0.3713 -0.0084 -0.0340 0.6678 1330.4 996.2 1.331 -1.7879 -0.3238 -0.0073 -0.0310 0.7751 1335.9 1012.2 1.464 -1.4219 -0.2492 -0.0057 -0.0230 0.8858 1341.2 1026.5 1.604 -0.8230 -0.1394 -0.0032 -0.0130 1.0000 1346.2 1039.2 1.751 0.0000 0.0000 0.0000 0.0000
308.15K
0.0000 1274.2 846.7 0.551 0.0000 0.0000 0.0000 0.0000 0.0874 1280.4 870.1 0.628 -0.6778 -0.1561 -0.0035 -0.0140 0.1772 1286.4 892.7 0.713 -1.2227 -0.2780 -0.0062 -0.0230 0.2697 1292.5 914.6 0.803 -1.6558 -0.3619 -0.0081 -0.0300 0.3648 1298.5 935.5 0.898 -1.9407 -0.4104 -0.0092 -0.0340 0.4628 1304.4 955.4 0.999 -2.0822 -0.4259 -0.0096 -0.0360 0.5638 1310.1 974.2 1.104 -2.0701 -0.4115 -0.0093 -0.0360 0.6678 1315.8 991.6 1.216 -1.8650 -0.3582 -0.0082 -0.0330 0.7751 1321.3 1007.7 1.335 -1.4810 -0.2752 -0.0063 -0.0260 0.8858 1326.7 1022.1 1.461 -0.8610 -0.1544 -0.0035 -0.0160 1.0000 1331.9 1034.8 1.596 0.0000 0.0000 0.0000 0.0000
313.15K
0.0000 1251.6 842.9 0.507 0.0000 0.0000 0.0000 0.0000 0.0874 1258.1 866.4 0.574 -0.7054 -0.1603 -0.0036 -0.0160 0.1772 1264.5 889.2 0.650 -1.2901 -0.2872 -0.0065 -0.0250 0.2697 1271.0 911.1 0.729 -1.7324 -0.3739 -0.0086 -0.0340 0.3648 1277.5 932.0 0.816 -2.0248 -0.4244 -0.0098 -0.0370 0.4628 1284.0 951.9 0.906 -2.1726 -0.4411 -0.0102 -0.0400 0.5638 1290.5 970.6 1.002 -2.1514 -0.4226 -0.0098 -0.0390 0.6678 1296.9 988.0 1.105 -1.9496 -0.3720 -0.0087 -0.0350 0.7751 1303.3 1003.9 1.214 -1.5396 -0.2848 -0.0067 -0.0280 0.8858 1309.7 1018.2 1.331 -0.9055 -0.1612 -0.0038 -0.0160 1.0000 1316.0 1030.6 1.455 0.0000 0.0000 0.0000 0.0000
318.15K
0.0000 1233.5 837.3 0.482 0.0000 0.0000 0.0000 0.0000 0.0874 1239.8 861.1 0.542 -0.7498 -0.1706 -0.0039 -0.0160 0.1772 1246.2 884.0 0.609 -1.3451 -0.2980 -0.0069 -0.0260 0.2697 1252.7 906.1 0.681 -1.8089 -0.3877 -0.0090 -0.0350 0.3648 1259.1 927.2 0.758 -2.1194 -0.4443 -0.0104 -0.0400 0.4628 1265.7 947.3 0.841 -2.2820 -0.4621 -0.0108 -0.0420 0.5638 1272.3 966.1 0.928 -2.2587 -0.4436 -0.0104 -0.0420 0.6678 1278.9 983.5 1.022 -2.0380 -0.3893 -0.0092 -0.0380 0.7751 1285.6 999.4 1.122 -1.6063 -0.2969 -0.0070 -0.0310 0.8858 1292.3 1013.7 1.229 -0.9476 -0.1688 -0.0040 -0.0200 1.0000 1299.0 1026.0 1.348 0.0000 0.0000 0.0000 0.0000
The viscosity deviations depend on strength of interactions between like and unlike molecules. The dependence of ∆η on composition for the mixtures under study may be explained in terms of physical and chemical factors [20,21]. The positive values of ∆η signify strong intermolecular interactions and negative
_____________________________________________________________________________________
shape of components. The negative values of ∆η for all the three systems can be explained by the molecular sizes, as explained in the previous discussion.
TABLE-4
System-III : Ethylbenzoate(X1) + o-chlorotoulene(X2)
Ultrasonic velocities, Densities, Viscosities and related excess parameters Mole
fraction X1
Velocity U m/s
Density ρ
gm/cm3 Viscosity η cP V
E cm3
mol-1
Δβad×10-12 m2N-1
LfE
(Ǻ) ∆η cP
303.15K
0.0000 1283.8 1072.6 0.870 0.0000 0.0000 0.0000 0.0000 0.0832 1289.4 1070.3 0.939 -0.1168 -0.0048 0.0000 -0.0040 0.1695 1295.1 1067.9 1.009 -0.2271 -0.0109 0.0000 -0.0100 0.2592 1300.9 1065.2 1.083 -0.3071 -0.0157 -0.0001 -0.0150 0.3525 1306.9 1062.3 1.162 -0.3668 -0.0183 -0.0001 -0.0190 0.4495 1313.1 1059.2 1.245 -0.4047 -0.0191 -0.0001 -0.0210 0.5505 1319.4 1055.8 1.334 -0.4069 -0.0190 -0.0001 -0.0210 0.6558 1325.9 1052.2 1.430 -0.3834 -0.0174 -0.0001 -0.0180 0.7656 1332.6 1048.2 1.531 -0.3061 -0.0113 0.0000 -0.0130 0.8802 1339.4 1043.9 1.638 -0.1841 -0.0051 0.0000 -0.0070 1.0000 1346.2 1039.2 1.751 0.0000 0.0000 0.0000 0.0000
308.15K
0.0000 1265.7 1068.0 0.776 0.0000 0.0000 0.0000 0.0000 0.0832 1271.5 1065.8 0.836 -0.1268 -0.0092 -0.0001 -0.0080 0.1695 1277.4 1063.5 0.899 -0.2475 -0.0200 -0.0003 -0.0160 0.2592 1283.5 1060.9 0.967 -0.3380 -0.0274 -0.0003 -0.0220 0.3525 1289.8 1058.0 1.040 -0.3964 -0.0315 -0.0004 -0.0250 0.4495 1296.3 1055.0 1.118 -0.4451 -0.0353 -0.0004 -0.0270 0.5505 1303.0 1051.6 1.201 -0.4456 -0.0347 -0.0004 -0.0260 0.6558 1309.9 1048.0 1.290 -0.4203 -0.0328 -0.0004 -0.0240 0.7656 1317.1 1044.0 1.385 -0.3405 -0.0242 -0.0003 -0.0190 0.8802 1324.4 1039.5 1.487 -0.1884 -0.0125 -0.0001 -0.0110 1.0000 1331.9 1034.8 1.596 0.0000 0.0000 0.0000 0.0000
313.15K
0.0000 1244.5 1062.3 0.732 0.0000 0.0000 0.0000 0.0000 0.0832 1250.6 1060.4 0.783 -0.1449 -0.0154 -0.0002 -0.0090 0.1695 1256.9 1058.3 0.838 -0.2726 -0.0290 -0.0005 -0.0170 0.2592 1263.4 1055.9 0.897 -0.3701 -0.0394 -0.0006 -0.0220 0.3525 1270.2 1053.3 0.961 -0.4477 -0.0460 -0.0007 -0.0260 0.4495 1277.2 1050.5 1.029 -0.5040 -0.0513 -0.0008 -0.0280 0.5505 1284.4 1047.3 1.102 -0.5121 -0.0525 -0.0008 -0.0280 0.6558 1291.9 1043.7 1.181 -0.4686 -0.0473 -0.0007 -0.0250 0.7656 1299.7 1039.7 1.266 -0.3694 -0.0356 -0.0005 -0.0200 0.8802 1307.7 1035.3 1.357 -0.2101 -0.0201 -0.0003 -0.0110 1.0000 1316.0 1030.6 1.455 0.0000 0.0000 0.0000 0.0000
318.15K
_____________________________________________________________________________________
TABLE-5
Values of coefficints and standard deviation (σ)
Temp K A0 A1 A2 A3 A4 σ
System-I : ethylbenzoate(X1) + o-xylene(X2)
Excess Molar Volume(VE)
303.15K -3.2755 0.3654 -0.0809 -0.0538 0.3407 0.0041 308.15K -3.6035 0.6359 -0.7006 -0.5402 0.9545 0.0054 313.15K -4.1082 0.5762 0.2468 -0.9313 -0.3993 0.0108 318.15K -4.4308 0.3559 0.1408 -0.2413 -0.9561 0.0103
Deviation in Adiabatic compressibility(Δβad)
303.15K -1.2125 -0.0674 0.0416 -0.0033 0.0010 0.0010 308.15K -1.2396 -0.0708 -0.0648 -0.0625 -0.0701 0.0017 313.15K -1.3071 -0.1114 -0.0332 -0.0974 -0.0848 0.0017 318.15K -1.3569 -0.1609 -0.0162 -0.0904 -0.1865 0.0022
Deviation in Viscosity (∆η)
303.15K -0.1043 -0.0081 0.0316 -0.0014 -0.0253 0.0004 308.15K -0.1243 -0.0077 0.0076 -0.0094 -0.0203 0.0003 313.15K -0.1238 -0.0117 -0.0173 -0.0164 0.0305 0.0006 318.15K -0.1328 0.0001 -0.0192 -0.0152 0.0032 0.0004
Excess free length( LfE)
303.15K -0.0249 -0.0005 0.0011 -0.0001 0.0000 0.0000 308.15K -0.0265 -0.0007 -0.0014 -0.0013 -0.0015 0.0000 313.15K -0.0287 -0.0016 -0.0006 -0.0022 -0.0019 0.0000 318.15K -0.0305 -0.0029 -0.0002 -0.0020 -0.0043 0.0001
System-II : ethylbenzoate(X1) + p-xylene(X2)
Excess Molar Volume(VE)
303.15K -8.0167 0.0812 -0.1586 -0.0491 0.0499 0.0045 308.15K -8.3761 0.0272 -0.1974 -0.0174 -0.0070 0.0061 313.15K -8.7378 0.0160 -0.3952 0.0847 0.2131 0.0031 318.15K -9.1806 0.0199 0.0709 -0.0103 -0.6090 0.0030
Deviation in Adiabatic compressibility(Δβad)
303.15K -1.5384 -0.2632 -0.0545 0.1382 0.1524 0.0009 308.15K -1.6927 -0.2684 -0.1177 -0.0018 0.0808 0.0014 313.15K -1.7535 -0.2687 -0.1265 0.0121 0.0961 0.0007 318.15K -1.8396 -0.2538 -0.0073 -0.0506 -0.1224 0.0008
Deviation in Viscosity(∆η)
303.15K -0.1329 0.0074 -0.0599 -0.0368 0.0815 0.0009 308.15K -0.1448 0.0028 -0.0327 -0.0187 -0.0006 0.0004 313.15K -0.1599 -0.0120 -0.0231 -0.0200 -0.0085 0.0009 318.15K -0.1684 -0.0046 -0.0332 0.0096 -0.0243 0.0006
Excess free length( LfE)
303.15K -0.0345 -0.0052 -0.0009 0.0032 0.0034 0.0000 308.15K -0.0383 -0.0052 -0.0024 0.0000 0.0019 0.0000 313.15K -0.0406 -0.0054 -0.0026 0.0004 0.0023 0.0000 318.15K -0.0431 -0.0051 0.0002 -0.0011 -0.0029 0.0000
System-III : ethylbenzoate(X1) +o-chlorotoulene(X2)
Excess Molar Volume (VE)
303.15K -1.6481 0.1358 -0.1046 -0.0157 0.1761 0.0036 308.15K -1.8130 0.1528 -0.1013 -0.1623 0.3877 0.0055 313.15K -2.0579 0.1761 0.3453 -0.1880 -0.2487 0.0033 318.15K -2.2806 0.1849 0.0002 -0.3872 0.4575 0.0042
Deviation in Adiabatic compressibility(Δβad)
303.15K -0.0764 -0.0026 -0.0314 -0.0211 0.1036 0.0007 308.15K -0.1431 0.0058 -0.0213 -0.0230 0.0945 0.0008 313.15K -0.2081 0.0081 0.0014 -0.0281 0.0306 0.0007 318.15K -0.2488 0.0084 -0.0232 -0.0210 0.0688 0.0007
Deviation in Viscosity(∆η)
303.15K -0.0845 -0.0073 0.0303 0.0200 0.0113 0.0003 308.15K -0.1078 -0.0115 -0.0216 0.0140 0.0399 0.0003 313.15K -0.1128 -0.0043 0.0050 -0.0069 -0.0024 0.0004 318.15K -0.1157 -0.0114 -0.0327 0.0102 0.0497 0.0004
Excess free length( LfE)
_____________________________________________________________________________________
.
Fig1(a): Variation of excess molar volume with mole fraction of EB for the system EB + OX
.
Fig1(b) Variation of deviation in adiabatic compressibility with mole fraction of EB for the system EB+OX
.
Fig1(c): Variation of excess free length with mole fraction of EB for the system EB+OX
-0.6 -0.4 -0.2 0.0
0.0 0.2 0.4 0.6 0.8 1.0
V
Ecm 3m
o
l
-1
X1
303.15K 308.15K 313.15K
-0.08 -0.06 -0.04 -0.02 0.00
0.0 0.2 0.4 0.6 0.8 1.0
∆β
a
d
m
2N
-1
X1
303.15K 308.15K 313.15K 318.15K
-0.0012 -0.0007
-0.00020.0 0.2 0.4 0.6 0.8 1.0
Lf
E/
1
0
-1
0m
X1
_____________________________________________________________________________________
.
Fig1(d): Variation of deviation in viscosity with mole fraction of EB for the system EB+OX
.
Fig2(a): Variation of excess molar volume with mole fraction of EB for the system EB + PX
.
Fig 2(b):Variation of deviation in adiabatic compressibility with mole fraction of EB for the system EB + PX
-0.04 -0.03 -0.02 -0.01 0.00
0.0 0.2 0.4 0.6 0.8 1.0
∆η
cp
X1
303.15K 308.15K 313.15K 318.15K
-2.5 -2.0 -1.5 -1.0 -0.5 0.0
0.0 0.2 0.4 0.6 0.8 1.0
V
Ecm 3m
o
l
-1
X1
303.15K 308.15K 313.15K 318.15K
-0.5 -0.4 -0.3 -0.2 -0.1 0.0
0.0 0.2 0.4 0.6 0.8 1.0
∆β
a
d
m
2N
-1
X1
[image:9.595.111.462.84.242.2]_____________________________________________________________________________________
.
Fig 2(c): Variation of excess free length with mole fraction of EB for the system EB + PX
.
Fig 2(d):Variation of excess viscosity with mole fraction of EB for the system EB + PX
.
Fig3(a)Variation of excess molar volume with mole fraction of EB for the system EB +OCT
-0.012 -0.009 -0.006 -0.003 0.000
0.0 0.2 0.4 0.6 0.8 1.0
Lf
E/
1
0
-1
0m
X1
303.15K 308.15K 313.15K 318.15K
-0.05 -0.04 -0.03 -0.02 -0.01 0.00
0.0 0.2 0.4 0.6 0.8 1.0
Δ
η
cp
X1
303.15K 308.15K 313.15K 318.15K
-0.6 -0.5 -0.4 -0.3 -0.2 -0.1 0.0
0.0 0.2 0.4 0.6 0.8 1.0
V
Ecm 3m
o
l
-1
X1
[image:10.595.186.411.267.406.2] [image:10.595.188.410.433.566.2]_____________________________________________________________________________________
.
Fig 3(b):Variation of deviation in adiabatic compressibility with mole fraction of EB for the system EB + OCT
.
Fig 3(c):Variation of excess free length with mole fraction of EB for the system EB + OCT
.
Fig 3(d): Variation of excess viscosity with mole fraction of EB for the system EB + OCT
CONCLUSION
Excess molar volumes (VE), deviation in adiabatic compressibility (∆βad), excess intermolecular free length (LfE), deviation in viscosity (∆η), are observed in negative trends. The changes in values of all excess parameters are non linear and parabolic. There is little deviations observed for almost all parameters for Ethyl benzoate (EB) +
o-chlorotoulene system.
Acknowledgements
The author conveys his thanks to Acharya Nagarjuna University.
REFERENCES
[1] R Koningaveld, RFT Stepto, Macromolecules, 1977, 10, 1166-1169.
-0.08 -0.06 -0.04 -0.02 0.00
0.0 0.2 0.4 0.6 0.8 1.0
∆β
a
d
m
2N
-1
X1
303.15K 308.15K 313.15K 318.15K
-0.0013 -0.0010 -0.0007 -0.0004 -0.0001 0.0002
0.0 0.2 0.4 0.6 0.8 1.0
Lf
E/
1
0
-1
0m
X1
303.15K 308.15K 313.15K 318.15K
-0.040 -0.030 -0.020 -0.010 0.000
0.0 0.2 0.4 0.6 0.8 1.0
Δ
η
cp
X1
[image:11.595.187.411.270.399.2] [image:11.595.186.411.427.562.2]_____________________________________________________________________________________
[2] MI Aralaguppi; TM Aminabhavi; SB Haragoppad; RF Balundgi, J. Chem. Eng. Data, 1992, 37, 298-303. [3] L Maravkova; J Linek, J. Chem. Thermodyn., 2003, 35, 1139-1149.
[4] B Giner; S Martin; H Artigas; MC Lopez, J. Phys. Chem B, 2006, 30,17683-17690. [5] I Vibhu; M Gupta; JP Shukla, WCU Paris. 2003, 7, 1355-1365.
[6] JA Reddick; WB Bunger; TK Sankano, Organic Solvents, VolII4thEd, Wiley Interscience, New York, 1986. [7] A Weissberger.; ES Proskaner; JA Riddick; EE Toops Jr, Organic Solvents, Vol II 2nd Ed, Wiley Interscience, New York, 1955.
[8] S Sreehari Sastry; Shaik Babu; T Vishwam; K Parvateesam; Ha.Sie Tiong, Physica B 2013, 420, 40-48.
[9] Sk Fakruddin; CH Srinivasu; BR.VenkateswaraRao; K Narendra, Advances in Physical Chemistry, 2012, 1(3), 29.
[10] K Narendra; CH Srinivasu; P Narayana Murthy, J.Appl. Sci., 2012,12(2), 136
[11] D Vijayalakshmi; CN Rao; MG Sankar; K Sivakumar; P Venkateswarlu., J.Mol Liq.,2014, 197, 272. [12] Rakesh Kumar Bhardwaj ; Amalendu Pal., J Mol Liq, 2005, 18, 37.
[13] Anil kumar Nain; Rajni Sharma; Anwar Ali; Swarita Gopal, J. Mol. Liq., 2009, 144, 124-130. [14] Nandihibatla V Sastry; Rakesh R. Thakor; C. Patel, J. Mol. Liq., 2009, 144, 13-22.
[15] C Yang; W Xu P, J. Chem. Eng. Data, 2004, 4, 881-885. [16] R Forte ; WR Moore, Trans Faraday Soc.,1966, 62, 1112-1119.
[17] B Nagarjun; AV. Sarma; GV Rama Rao; C Rambabu, Journal of Thermodynamics., 2013, Article ID 9, 285796.
[18] H Eyring; JF.Kincaid, J Chem Phy,1996, 6, 620.
[19] PS.Nikam; BS Jagdale; AB Sawant; M Hasan, J Pure Appl Utrason, 2000, 22, 115.