IMPROVED THRESHOLDING AND
QUANTIZATION TECHNIQUES FOR IMAGE
COMPRESSION
NIK SHAHIDAH AFIFI BINTI MD TAUJUDDIN
IMPROVED THRESHOLDING AND QUANTIZATION TECHNIQUES FOR IMAGE COMPRESSION
NIK SHAHIDAH AFIFI BINTI MD TAUJUDDIN
A thesis submitted in
fulfillment of the requirement for the award of the Doctor of Philosophy in Information Technology
Faculty of Computer Science and Information Technology Universiti Tun Hussein Onn Malaysia
iii
For my beloved husband, Ahmad Raqib Ab Ghani and kids, Siti Sofiyah and Uthman.
My lovely father Md Taujuddin Mohamad and my late mother Tuan Afifah Adib Tuan Dir.
iv
ACKNOWLEDGEMENT
First and foremost, all praise be to the Allah SWT, Almighty, the Benevolent for his blessing and guidance for giving me inspiration to see this through the end.
I would like to express my sincere gratitude the Malaysia Ministry of Higher Education for granting me under SLAI scholarship. Special thanks to Universiti Tun Hussein Onn Malaysia (UTHM) and Research, Innovation, Commercialization and Consultancy Management (ORICC) office for facilitating this research activity under Research Supporting Grant Scheme (RSGS) Vot U109.
I extend my appreciation to my very supportive supervisor, Prof Dr Hjh Rosziati Ibrahim, I will forever grateful for all the invaluable advice, guidance and support and that you give me throughout this education journey. I would like to thank my co-supervisor, Dr Hjh Suhaila Sari for her constant advice and help throughout my study.
Special thanks also goes to my attachment sensei, Professor Iwahashi Masahiro from Department of Electrical Engineering, Nagaoka University of Technology, Niigata, Japan, for all the valuable ideas, discussion and comments on the research activities.
I owe my loving thanks to my lovely parents. Without their encouragements, understanding and constant prayers it would have been impossible for me to finish this work.
v
ABSTRACT
vi
ABSTRAK
Sejak beberapa dekad yang lalu, imej digital telah menunjukkan perkembangan yang sangat memberangsangkan. Kemunculan pelbagai aplikasi imej digital telah membebankan kapasiti storan dan keupayaan proses penghantaran. Walaupun teknologi terkini telah meningkatkan keupayaan storan dan penghantaran, namun, permintaan terhadapnya sentiasa melebihi keupayaan sebenar sistem. Disamping itu, proses memampatkan saiz imej telah mengurangkan kualiti imej. Jadi, untuk menyelesaikan masalah ini, penambahbaikan kepada teknik ambangan dan kuantuman adalah dicadangkan. Pertamanya, nilai ambangan pekali wavelet yang dihasilkan dari proses Discrete Wavelet Transform (DWT) dikira menggunakan algoritma ‘Standard Deviation-Based Wavelet Coefficients Threshold Estimation’
vii
TABLE OF CONTENTS
ACKNOWLEDGEMENT iv
ABSTRACT v
ABSTRAK vi
TABLE OF CONTENTS vii
LIST OF TABLES xi
LIST OF FIGURES xiii
LIST OF SYMBOLS AND ABBREVIATIONS xvii
LIST OF PUBLICATIONS xix
LIST OF AWARDS xxii
CHAPTER 1 INTRODUCTION 1
1.1 Research Background 1
1.2 Research Motivation 2
1.3 Problem Statement 3
1.4 Research Objectives 5
1.5 Scope and Limitation 6
1.6 Thesis Outline 7
CHAPTER 2 LITERATURE REVIEW 8
2.1 Introduction 8
2.2 Overview of Digital Image 8
2.3 Overview of Image Compression 10
viii
2.3.2 Establish Compression Algorithm 14 2.4 Image Compression Framework 16
2.4.1 Transformation Process 17
2.4.2 Quantization Process 17
2.4.3 Entropy Process 18
2.5 Wavelet Algorithm 18
2.5.1 The Principle of Wavelet 19
2.5.2 Discrete Wavelet Transformation (DWT) 20
2.5.3 Related Work in Wavelet 26
2.6 Thresholding Algorithm 30
2.6.1 Psychovisual Threshold 31
2.6.2 Fixed Threshold 32
2.6.3 Measured Threshold 33
2.6.4 Predicted Threshold 33
2.6.5 Summary 34
2.7 Quantization Algorithm 37
2.7.1 Uniform Quantization 37 2.7.2 Non-Uniform Quantization 40 2.7.3 Hybrid Quantization 41
2.7.4 Summary 42
2.8 Entropy Algorithm 44
2.8.1 Huffman Entropy Coding 44 2.8.2 Run Length Encoding (RLE) 46
2.8.3 Arithmetic Coding 47
2.8.4 Summary 47
2.9 Performance Evaluation 48
2.9.1 Peak Signal to Noise Ratio (PSNR) 48 2.9.2 Mean Structural SIMilarity (MSSIM) 49 2.9.3 Compression Ratio (CR) 49 2.9.4 Rate Distortion (RD) 50 2.10 Recent Work in Image Compression 51
ix
CHAPTER 3 METHODOLOGY 55
3.1 Introduction 55
3.2 Research Framework 55
3.2.1 Image Acquisition 58
3.2.2 Transformation using Discrete Wavelet
Transform 61
3.2.3 Improved Thresholding Algorithm by Standard Deviation-Based Wavelet Coefficients Threshold Estimation
Algorithm 61
3.2.4 Improved Quantization Algorithm by
Minimizing Median Quantization Error
Algorithm 68
3.2.5 Encoding using Huffman Entropy Coding 76 3.2.6 Benchmarking and Evaluation 78 3.3 Comparison of Proposed Compression Algorithm
with Recent Compression Algorithms 79
3.4 Chapter Summary 86
CHAPTER 4 EXPERIMENTAL RESULTS AND DISCUSSION 87
4.1 Introduction 87
4.2 Experimental Result on Standard Deviation-Based Wavelet Coefficients
Threshold Estimation Algorithm 87
4.2.1 Obtaining the Threshold Value 88 4.2.2 Thresholding the Near Zero Coefficients 90 4.3 Experimental Results on Minimizing Median
Quantization Error Algorithm 98
4.3.1 Measurement on Interval Resizing 99 4.3.2 Measurement on Error Minimization 101 4.4 Benchmarking with Prominent Wavelet-Based
Compression Algorithm 102
4.4.1 Observation on Final Reconstructed
x
4.4.2 PSNR Analysis 104
4.4.3 Compression Ratio Analysis 105 4.5 Benchmarking with Standard Compression
Algorithm 107
4.5.1 Rate Distortion Analysis 107
4.5.2 Compression Ratio Analysis at
Different Bitrate 110
4.6 Benchmarking with Recent Compression
Algorithm 113
4.6.1 PSNR Analysis 114
4.6.2 Compression Ratio Analysis 115
4.7 Discussion 116
4.8 Chapter Summary 118
CHAPTER 5 CONCLUSION AND FUTURE WORK 120
5.1 Introduction 120
5.2 Objective Achieved 121
5.3 Contribution of Research 127
5.4 Future Works 127
5.5 Concluding Remarks 129
REFERENCES 130
xi
LIST OF TABLES
2.1 Multimedia Data with It Features
(Sudhakar et al., 2005) 11
2.2 Summary of Thresholding Techniques 36 2.3 Summary of Quantization Algorithms Proposed by
Recent Researchers 43
2.4 Summary of Technique Used in Compression Algorithm Proposed by Recent Researchers 53 3.1 Comparison on Different Elements on Recent
Compression Algorithms and the Proposed
Compression Algorithm 85
4.1 Standard Deviation Value for Each Subband in Test
Images 88
4.2 The Threshold Value Obtained for Horizontal, Vertical and Diagonal Subbans of Each Test Image 89 4.3 The Amaount of Coefficients Reduced After
Thresholding using the Proposed Standard Deviation-Based Wavelet Coefficients Threshold
Estimation 98
4.4 Measurement of Interval Resizing using PSNR
Analysis Between Uniform Quantization, Non-Uniform Quantization and the Proposed
Minimizing Median Quantization Error 100 4.5 Measurement on Error Minimization using MSSIM
xii
4.6 Final Reconstructed Image by using Various Wavelet Based Compression Algorithms and The
Proposed Compression Algorithm 103
4.7 PSNR Value Comparison Between Wavelet-Based Compression Algorithms with Proposed
Compression Algorithm 104
4.8 Compression Ratio Comparison Between Wavelet- Based Compression Algorithms With Proposed
Compression Algorithm 106
4.9 PSNR Table of Comparison Between the Proposed Compression Algorithm with Recent Researches 114 4.10 Compression Ratio Table of Comparison Between
The Proposed Compression Algorithm with
xiii
LIST OF FIGURES
2.1 Lossless Coding Technique (Subramanya, 2001) 13 2.2 Lossy Coding Technique (Subramanya, 2001) 13 2.3 Typical Compression Basic Steps (Rehna, 2012) 16 2.4 Discrete Wavelet Transform Downsampling
Process (Hsia et al., 2012) 21
2.5 Different Image Characteristic
(Andries et al., 2014) 23
2.6 Standard Grey Scale Barbara Image
(Sari et al., 2012) 24
2.7 Wavelet Coefficient Representation on Diagonal
Detail of Barbara 24
2.8 Wavelet Coefficient Representation on Vertical
Detail of Barbara 25
2.9 Wavelet Coefficient Representation on
Horizontal Detail of Barbara 25
2.10 Wavelet Coefficient Representation on
Approximate Detail of Barbara 26
2.11 Scanning Order in Wavelet. Zig-Zag Style for
Approximate and Diagonal Subband, Row Scan For Horizontal Subband and Column Scan for
Vertical Subband (Tudela, 2012) 27
2.12 Uniform Quantization (Bekhtin, 2011) 38 2.13 Code-word at Middle Interval Representing
Quantized Value (Sun et al., 2013) 39 2.14 Non-Uniform Quantization
xiv
2.15 Example of Huffman Coding
(Velho et al., 2009) 45
2.16 Example of Huffman Code for Text 26 Alphabet Letters Document (Solomon, 2008) 46 2.17 Optimum rate distortion curve (Ruiz et al., 2013) 50 3.1 Proposed Framework for an Improved
Thresholding and Quantization Techniques for
Image Compression 56
3.2 The Flow of the Proposed Improved Thresholding and Quantization Techniques for Image
Compression 57
3.3 Standard Grey Scale Image obtained from
University of Southern California, Signal and Image Processing Institute (USC-SIPI) image
database (Weber, 2006) 59
3.4 Medical images obtained from DICOM (Digital Imaging and Communication in Medicine) Library
(Suapang & Dejhan, 2009) 60
3.5 The steps in Standard Deviation-Based Wavelet Coefficients Threshold Estimation Algorithm 67 3.6 Block Diagram of the Proposed Quantization
Algorithm 68
3.7 Coefficient Value Distribution 72 3.8 Mapping Zero Coefficient to an Index Q[k1,k2] 72 3.9 Construction of an Initial Classes for Significant
Coefficients 73
3.10 Example of Iteration Process to Perform New
Class Set 74
3.11 The steps in Minimizing Median Quantization
Error Algorithm 75
3.12 Block diagram of the proposed quantization
algorithm 76
3.13 Designation of Codeword for Quantization Level
xv
3.14 Compression Algorithm by Savic et al. (2015) 80 3.15 Compression Algorithm by Bartrina-rapesta
and Aulí-llinàs (2015) 81
3.16 Proposed Compression Algorithm 83 4.1 The Threshold Value for Horizontal Subband, λH
in Barbara Image 91
4.2 The Remaining Wavelet Coefficients in Horizontal Subband after Thresholding Process 91 4.3 The Threshold Value for Vertical Subband, λV
in Barbara Image 92
4.4 The Remaining Wavelet Coefficients in Vertical Subband after Thresholding Process 92 4.5 The Threshold Value for Diagonal Subband, λD
in Barbara Image 93
4.6 The Remaining Wavelet Coefficients in Diagonal Subband after Thresholding Process 93 4.7 Edgemap and Wavelet Coefficient
Representation Before and After Thresholding
on Barbara’s Horizontal Subband 95
4.8 Edgemap and Wavelet Coefficient Representation Before and After Thresholding on Barbara’s
Vertical Subband. 96
4.9 Edgemap and Wavelet Coefficient Representation Before and After Thresholding on Barbara’s
Diagonal Subband. 97
4.10 Rate Distortion Curve on Mandrill 108 4.11 Rate Distortion Curve on Cameraman 108 4.12 Rate Distortion Curve on Barbara 109 4.13 Rate Distortion Curve on Lena 109 4.14 Rate Distortion Curve on Woman 110 4.15 Rate Distortion Curve on House 110 4.16 Compression Ratio on Different Bitrate for High
xvi
4.17 Compression Ratio on Different Bitrate for Low Detail and Edges Image (Woman Image) 112 4.18 Compression Ratio on Different Bitrate for Mix
High and Low Detail and Edges Image
xvii
LIST OF SYMBOLS AND ABBREVIATIONS
CR - Compression Ratio
BPP - Bit-Per-Pixel
MSE - Mean Square Error
PSNR - Peak-Signal-to-Noise Ratio
PSQNR - Peak-Signal-to-Quantization-Noise Ratio
CB-2SDQ - Cell-Based Two-Step Scalar Deadzone Quantization
RLE - Run Length Encoding
LZW - Lempel-Ziv-Welch
CALIC - Context Based, Adaptive, Lossless Image Codec JPEG - Joint Photographic Expert Group
JPEG-LS - Joint Photographic Expert Group lossless/near lossless
JPEG2000 - Joint Photographic Expert Group 2000
DCT - Discrete Cosine Transform
DFT - Discrete Fourier Transform
DWT - Discrete Wavelet Transform
ROI - Region of Interest
ROB - Region of Background
SM - Significance Map
KLT - Karhunen-Loeve Transform
DNA - Deoxyribonucleic Acid
LL - low resolution approximate image
HL - intensity variation along column, horizontal edge LH - intensity variation along row, vertical edge HH - intensity variation along diagonal
PAE - Peak Absolute Error
xviii
LMQ - Lloyd Max Quantizer
EZW - Embedded Zerotree Wavelet
SAQ - Successive Approximate Quantization SPIHT - Set Partitioning in Hierarchical Trees
SQP - SQuare Partitioning
WDR - Wavelet Difference Reduction
ASWDR - Adaptive Scanned Wavelet Different Reduction USC-SIPI - University of Southern California, Signal and Image
Processing Institute
Sym5 - Symlet 5
MSSIM - Mean Structural SIMilarity
HDR - High Dynamic Range
RGB - Red Green Blue
3D - 3 Dimentional
xix
LIST OF PUBLICATIONS
Journals:
(i) Taujuddin, N. S. A. M. and Ibrahim, R. (2013). A Comparative Analysis on the Wavelet-Based Image Compression Techniques. Journal Of Computer Science And Engineering, Volume 21, Issue 1, ISSN 2043-9091.
(ii) Taujuddin, N. S. A. M., Ibrahim, R. and Sari, S. (2015). Threshold Estimation by Adapting Standard Deviation at Wavelet Details Subbands for Image Compression. ARPN Journal of Engineering and Applied Science. Vol.10, No.19, ISSN 1819-6608. 2015 (Indexed by SCOPUS).
(iii) Taujuddin, N. S. A. M., Ibrahim, R. and Sari, S. (2015). Wavelet
xx
Proceedings:
(i) Taujuddin, N. S. A. M. and Ibrahim, R. (2014). Medical Image
Compression by Using Threshold Predicting Wavelet-Based Algorithm. Lect. Notes Electrical Eng, Advance Computer and Communication Technology, Vol 315, ISBN07673-7 (Print ISBN) 978-3-319-07674-4 (Online ISBN), Springer International Publishing, pg 755-765 (Indexed by SCOPUS).
(ii) Taujuddin, N. S. A. M., Ibrahim, R. and Sari, S. (2014). A Comparative Analysis of PSNR value for Images using Wavelet Based Thresholding Methods. In Proceeding of Malaysian Technical Universities Conference on Engineering & Technology (MUCET 2014), Mahkota Hotel, Melaka.
(iii) Taujuddin, N. S. A. M., Ibrahim, R. and Sari, S. (2015). Progressive Pixel-to-Pixel Evaluation to Obtain the Hard and Smooth Region for Image Compression. IEEE Computer Society (6th International Conference on Intelligent Systems, Modelling and Simulation), pg 102-106, ISBN: 2166-0670/15 (Indexed by SCOPUS).
(v) Taujuddin, N. S. A. M., Ibrahim, R. and Sari, S. (2015). Image
Compression Using A New Adaptive Standard Deviation Thresholding Estimation At The Wavelet Details Subbands. IEEE Computer Society (2nd International Conference on Computing Technology and Information Management), 2015. ISBN: 978-1-4799-6210-5. Pg 109-114 (Indexed by SCOPUS).
(vi) Taujuddin, N. S. A. M., Ibrahim, R. and Sari, S. (2015). An Improved Technique to Wavelet Thresholding at Details Subbands for Image
xxi
(vii) Taujuddin, N. S. A. M., Ibrahim, R. and Sari, S. (2016). Minimizing Median Difference Quantization Error for Image Compression. IEEE Communications Society (International Conference on ICT Convergence 2016), ISBN 978-1-5090-1325-8/16, pg 1160-1164.
xxii
LIST OF AWARDS
(i) Best Paper Award; Information Technology Track (1st prize) [MUCET 2014]:
1CHAPTER 1
INTRODUCTION
1.1 Research Background
In recent decades, with rapid development in the multimedia world, digital images have become important. With many modern applications employing image graphics extensively, it tends to burden the storage as well as transmission process. For example, an image with height and width of 512 pixel and each pixel carries 24 bit data will comprise up to 6291456 bits (512x512x24). Therefore, there is a need to reduce the image size and compression is one of the promising technique (Ahmadi et al., 2015).
Compression is a process of reducing the amount of redundant data while maintaining the good quality of the reproduced image (Rekha & Samundiswary, 2016; Enesi & Zanaj, 2011). Compression is essential particularly to reduce storage space, transmission time, bandwidth utilization and to enable rapid browsing and retrieval of images from the database (Hashemi-berenjabad et al., 2011).
Recently, there is a growing interest among researchers focusing on compression of various types of images and data. There are many examples of existing research on standard grey scale images (Bekhtin, 2011; Horng, 2012; Savic
et al., 2015; Hussain et al., 2015), medical images (Ayu et al., 2016; Tiwari et al.,
2015; Thepade 2013) and ECG signals (Abo-Zahhad et al., 2013; Kumar et al.,
2
1.2 Research Motivation
Advances over the past decade in many aspects of digital technology especially devices for image acquisition, data storage, bitmapped printing and display have brought out many applications for digital imaging. E-commerce, health care, social media, education, business and remote sensing are some examples of applications that deal with massive amounts of digital images (Thepade, 2013; Rufai et al., 2014). With increasing demand on digital images, the uncompressed images requires considerable transmission bandwidth and storage capacity. Despite the technological advances in transmission and storage, the demands placed on the bandwidth of communication and storage capacities by far outstrips its’ availability (Enesi & Zanaj, 2011; Janaki, 2012; Devi & Mini, 2012).
For example, medical images normally need up to 16 kBits/sec for image transmission but conventional computer just can allow for 8 kBits/sec. Linear mapping for transmission is unacceptable for medical images since important image detail may be corrupted or lost (Papitha et al., 2013).
In addition, reputable social media such as Flickr and Facebook allows their users to manage their daily digital photographs online in a very convenient way which led to enormous amounts of digital images uploaded. Now, it already reach 3000 photo upload per minute for Flickr and 58000 photo upload per minute for Facebook (Xu et al., 2016).
Until now, image compression turn out to be an extremely a must for almost all application and play important role to reduce the image size, storage capacity and bandwidth requirement (Ruiz et al., 2013; Loganathan & Kumaraswamy, 2013; Kho
et al., 2015; Wang, 2011; Guo et al., 2016). Above and beyond, compression can also increase the speed and efficiency of transmission system (Quan, 2013).
3
1.3 Problem Statement
Despite the fact that great efforts are made to seek image compression at modest complexity and efficient performance, it still facing many challenges in achieving various degrees of scalability at different target bit rate based on user’s individual requirements (Paul & Bandyopadhyay, 2014; Andries et al., 2014; Cheng & Lerner, 2015; Hussain et al., 2015).
Besides, data reduction and elimination in compression process will harm the image quality as it will give bad effect to perception of the Human Visual System (HVS). HVS is a normal human sense that sensitive to image structure or color changes. Modification on images, as done during compression process will cause blurring and image quality degradations resulting degradation of visual appearance according human eye (Baranitharan, 2013; Wan & Panetta, 2016; Song et al., 2016). Many algorithms have been developed for image compression (Biswas & Om, 2012; Abirami et al., 2013; Quan, 2013; Bernatin & Sundari, 2014; Wu, 2014; Cheng & Lerner, 2015; Kho et al., 2015; Guo et al., 2016). In most of these methods, the researchers are exploiting the correlation across scales provided by wavelet transform. Wavelet is very practical and popular among the researcher since it can separate the image into several subbands based on energy correlation thus it is scalable and provide ample room for improvement. However, it is expensive with respect to time and resources (Kho et al., 2015).
In some other works, the focus is on reducing the inter-image redundancy based on correlation among neighboring coefficients (Quan, 2013; Bernatin & Sundari, 2014; Wu, 2014; Guo et al., 2016). Although this method can precisely predict the coefficient to be reduce, this method suffer with edge spreads over the neighboring coefficients which degrade the coding efficiency (Pan et al., 2010).
4
Threshold value selection is very crucial and is hard to obtain since it requires the knowledge of original data (Bruni & Vitulano, 2007). If the threshold value is set too small, it will adopt noise into the signal. But, if the threshold value is too high, the important coefficients value will be screened out, leading to deviation condition (Zhen & Su, 2010).
Generally, many remaining algorithms do not consider the wavelet coefficient in the importance of signal where the threshold is applied generally to the whole coefficient without considering the characteristic of the signal (Sreelekha & Sathidevi, 2010; Abirami et al., 2013) . Besides that, previous research performed the thresholding process on each coefficient, leading to a higher number of selected coefficients that turned out to more complex with a long computational time (Ernawan et al., 2013).
Moreover, quantization strategy is also needed in compression because it will led to reduction of bit used (Kobayashi et al., 2012). There are some simple quantization technique that rounding up the quantization to the nearest quantization value, but they are undergo with huge quantization error when the input has sparse characteristic (Siraktamath, 2011; Pinto & Gawande, 2012; Sun et al., 2013).
To handle this problem, the use of probability density function has raise its popularity (Yang et al., 2014; Guo et al., 2016). Although the usage of probability density function minimize the mean square error, it needs recursive computations and not appropriate for high speed processing.
Later, a more sophisticated quantization technique are being proposed such as reducing the quantization range (Iwahashi et al., 2014), quantization based on the histogram variances (Savic et al., 2015) and splitting the quantization into dual mode based on its magnitude (Bartrina-rapesta & Aulí-llinàs, 2015).
Although the above techniques show a better performance, still it basically concerns on reducing the cost of compression parameter such as the length of the codeword, quantization step as well as the quantization boundary but not considering the importance of location of significant and non-significant coefficients. Also the problem on minimizing the error is not well addressed.
5
standard deviation-based wavelet coefficients threshold estimation. In contrast with the existing algorithm, the proposed algorithm determine the threshold value by evaluating the characteristic of signal on each subband. So, more precise threshold value will be generated and better thresholding performance will be performed.
Secondly, quantization algorithm that can enhanced the ability in estimating the interval boundary for optimal quantization is proposed. The proposed quantization algorithm will utilize the existence of large amounts of zero coefficients generated from the thresholding process in order to form a better class interval size. Furthermore, the quantization error will be reduced by shifting the class interval to a better position.
The approach on the proposed quantization algorithm is different with previous researches in two main points. In the beginning, the proposed quantization algorithm take zero coefficients into consideration and optimizing the class interval size or step size. Then, the group step size is defined by calculating median error difference at each group and recursively shift the interval size until it reaches a minimum error value or no further exchange.
Thirdly, the propose thresholding algorithm and quantization algorithm are then merge in a flow consequently produce an improved compression algorithm that provides an alternative algorithm to compress an image. The performance of the proposed algorithm is evaluated based on standard evaluation parameter and benchmark it with the existing algorithms.
1.4 Research Objectives
Based on the related issues, three objectives have been formulated for this research:
(i) To propose an improved thresholding algorithm for an efficient insignificant wavelet coefficient elimination by adapting standard deviation-based wavelet coefficients threshold estimation.
(ii) To develop an enhance quantization algorithm to improve the compression ratio by minimizing the median quantization error.
6
1.5 Scope and Limitation
The algorithm was developed on MATLAB and for the analysis purposes, grey scale images are used. The grey scale images are used because it can simplifies the algorithm and reduces the computational requirements (Li, 2013; Rufai et al., 2013). Besides, it also offer an adequate bit usage for research purposes (Rammohan & Sankaranarayanan, 2013; Mulla et al., 2015).
This research uses images from two different databases. Firstly, the images with mixture of smooth, edge and detail region were obtained from the University of Southern California, Signal and Image Processing Institute (USC-SIPI) image database namely Lena, Barbara, House, Cameraman, Mandrill, Boat, Woman and Living Room (Weber, 2006). These images are widely being used for research purposes (Andries et al., 2014; Ahmadi et al., 2015; Sari et al., 2012; Kaaniche et al.,
2014).
Secondly, this research uses medical images with different Region of Interest (ROI) and Region of Background (ROB) obtained from DICOM (Digital Imaging and Communication in Medicine) Library (Suapang & Dejhan, 2009). This database provides real medical images for education and research purpose (Kaur & Kumar, 2015; Nguyen & Quang, 2016; Pinto & Gawande, 2012; Somvanshi, 2012). Medical images used in this research are Computed Tomography (CT) images (CT_Brain and CT_Chest), X-ray images (Xray_Kidney and Xray_Teeth) and Magnetic Resonance (MR) images (MR_Knee and MR_Brain).
To measure the performance of the proposed algorithm, a series of experiment was done. It fell under two categories:
a. Compression performance
Compression Ratio (CR) and Rate Distortion (RD) (Li, 2013) b. Image quality performance
Peak-Signal-to-Noise Ratio (PSNR) and Mean Structural SIMilarity (MSSIM) (Gosavi, 2016; Tiwari et al., 2015)
7
research on compression algorithms namely Cell-Based Two-Step Scalar Deadzone Quantization, CB-2SDQ (Bartrina-rapesta & Aulí-llinàs, 2015) and Linear Threshold Prediction and Dual Mode Quantization (Savic et al., 2015).
1.6 Thesis Outline
2CHAPTER 2
LITERATURE REVIEW
2.1 Introduction
In the contemporary multimedia world, digital imaging plays an important role in social network, education, business, remote sensing, military as well as in the clinical environment. This is mainly motivated by the special features of digital imaging such as it can be easily archived, stored and shared with another. Besides that, it can be used in more than one location at the same time. In addition, digital data also do not suffer from aging (Isaac & Wilscy, 2015).
Increasing demand in digital image requires a significant amount of space capacity (Janaki, 2012). Compression is one of the technique that can be used to reduce the storage size and improve the system efficiency (Hussain et al., 2015). Generally, the compression is a procedure of eliminating particular data and it can be achieved by performing some process such as thresholding, quantization and entropy coding (Om & Biswas, 2014).
2.2 Overview of Digital Image
9
white. While for 8 bit image (grey scale image), each pixel has 256 possible color value (28 =256), from darkest grey (black) to lightest grey (white) (Swarnkar et al., 2014).
The colored image for example RGB (Red, Green, Blue) image use more bits, thus provide wider range of color (Ayu et al., 2016). The RGB image uses 24 bit per pixel (224 or 16777216 possible color value) with intensity from darkest to lightest of Red, Green and Blue color (Fuad et al., 2013). Thus, the mixture of these colors produce a color image. Theoretically, more bit used mean larger image size. For example, the size of a typical 512 x 512 grey scale image is approximately 2097152 bits (512 x 512 x 8).
With advances in digital imaging application it offer a broader range of images types and sizes. The recent image type named High Dynamic Range (HDR) image is an image with extended bit. It able to capture the full visible color of real world with details in highlights and shadows. Although it consume a large storage capacity, HDR gaining its popularity in photography and 3D games (Athilakshmi et al., 2014; Iwahashi et al., 2014).
Medical area also taking the advantage of the advances in digital imaging by using the digital image to ease the process of storage, exchanging and transmission of medical image. Medical image usually segmented into two different area; Region of Interest (ROI) and Region of Background (ROB). ROI is region consist of medicinal or diagnostic information while ROB is the background of image which not considered in diagnosis purposes (Janaki, 2012). A standard medical image database named DICOM (Digital Imaging and Communication in Medicine) was formed to enable the integration of medical imaging devices (Suapang & Dejhan, 2009). DICOM use a lookup table named Grey scale Standard Display Function (GSDF) to produce an identical grey scale image that consistent with hard copy image from various mode of medical devices. At this point, image viewed in devices such as Computerized Tomography (CT) scanner, X-ray generator and Magnetic Resonance (MR) machine can be calibrated to be represent in digital image (Tiwari
et al., 2015; Papitha et al., 2013).
10
grey scale images called as Standard Grey Scale images are stored and it being used widely by the researchers (Andries et al., 2014; Ahmadi et al., 2015; Sari et al.,
2012; Kaaniche et al., 2014). Besides, the image database of medical images can be found in DICOM Library (Suapang & Dejhan, 2009). This database provides real medical images for education and research purpose (Kaur & Kumar, 2015; Nguyen & Quang, 2016; Pinto & Gawande, 2012; Somvanshi, 2012). The availability of these database ease the benchmarking process among the researchers since the images used are same.
The main reason why grey scale image is frequently used in developing algorithm is that grey scale image simplifies the algorithm and reduces computational requirements (Li, 2013; Rufai et al., 2013). Besides, the use of 8 bit per pixel in grey scale image is adequate for research purposes and it can be easily employed to any image format. For example, the colored image use 24 bit per pixel (8 bit for Red, 8 bit for Green and 8 bit for Blue). So each color can be treated separately (Rammohan & Sankaranarayanan, 2013).
2.3 Overview of Image Compression
11
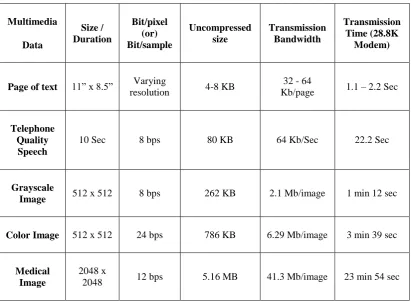
Table 2.1: Multimedia Data With It Features (Sudhakar et al., 2005)
Multimedia Data Size / Duration Bit/pixel (or) Bit/sample Uncompressed size Transmission Bandwidth Transmission Time (28.8K Modem)
Page of text 11” x 8.5” Varying
resolution 4-8 KB
32 - 64
Kb/page 1.1 – 2.2 Sec
Telephone Quality Speech
10 Sec 8 bps 80 KB 64 Kb/Sec 22.2 Sec
Grayscale
Image 512 x 512 8 bps 262 KB 2.1 Mb/image 1 min 12 sec
Color Image 512 x 512 24 bps 786 KB 6.29 Mb/image 3 min 39 sec
Medical Image
2048 x
2048 12 bps 5.16 MB 41.3 Mb/image 23 min 54 sec
Hence, compression is one of the promising technique that can reduce the storage and network traffic requirements, therefore improving the system efficiency (Hussain et al., 2015).
There are a huge number of approaches proposed in literature, mainly focusing on developing an algorithm that able to compact an image as much as possible to a smaller size. From the reading, it is identified that wavelet is the most prominent tool used in compression as proved by the amount of algorithms suggested (Thepade, 2013; Loganathan and Kumaraswamy, 2013; Karras, 2007; J. Li, 2013).
Eliminating unwanted information is a major aspect in compression. This can be achieved by performing thresholding process (Om & Biswas, 2014; Dengwen & Wengang, 2008; Xing-hai, 2011; Huimin et al., 2012; Nasri & Nezamabadi-pour, 2009) as well as quantization (Kaur et al., 2007; Abdulla, 2010; Velisavljević et al.,
2007; Hosseini and Naghsh-Nilchi, 2012; Jiang et al., 2012).
12
planes. In image processing, the original domain is referred as spatial domain, while the results depend on transform domain (Marin et al., 2016).
Image compression is a process of reducing the amount of data in an image by removing the redundant data without affecting the quality of the image by keeping the resolution and visual quality of the reconstructed image as close to the original image as possible. In image processing, Human Visual System (HVS) is the terminology used to represent the perception of normal human eye. HVS is a human biological process that can sense the difference in visual appearance. So, image with high degradation caused by compression process will distract the HVS (Jimenez-Rodriguez et al., 2014; Mohammed et al., 2014; Panetta et al., 2016). An inverse process is called decompression (decoding) where it is applied to the compressed data to get the reconstructed image.
To demonstrate the compression result, compression ratio or rate distortion are used. Compression ratio is the size ratio of an original image compared to the size of its compressed image. Rate distortion is the required bit needed to achieve a certain point of desired performance in a compressed image (J. Li, 2013). Besides that, the Peak Signal to Noise Ratio (PSNR) and Mean Structural SIMilarity (MSSIM) can be used to quantify the quality of the compressed image (Gosavi, 2016; Tiwari et al., 2015).
2.3.1 Lossless and Lossy Compression
Compression algorithms can be classified as either lossless or lossy compression. In lossless compression schemes, the reconstructed image, after compression, is numerically identical to the original image. However it can only achieve a modest amount of compression (Iwahashi et al., 2012b).
13
Some example of lossy image-coding algorithms are block truncations, transform coding and wavelet subband coding (Rufai et al., 2013).
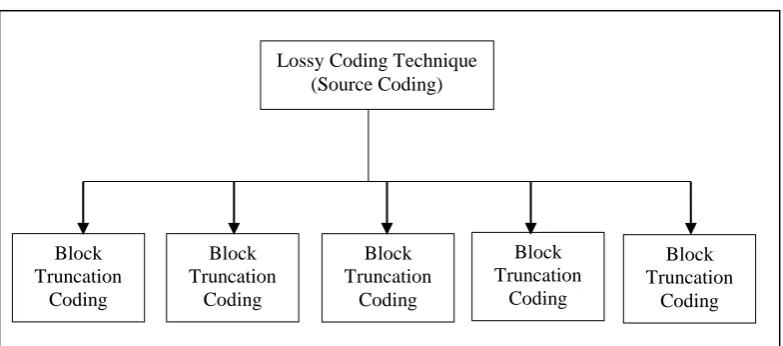
Algorithms used in lossless compression are Run Length Encoding, Huffman Encoding, Lempel-Ziv-Welch (LZW) Encoding and Area Coding (see Figure 2.1). While for lossy compression, the algorithm used are Transformation coding, Vector quantization, Fractal coding, Block Truncation coding and Subband coding (see Figure 2.2). The compression ratio can be measured by comparing the size of the image before compression process over the size of the image after compression process. For lossless coding, the compression ratio is not larger than 2:1 to 4:1 while lossy compression ranges from 4:1 to 100:1 or even higher (Cheng & Lerner, 2015).
[image:35.595.121.516.300.468.2]Lossless Coding Technique (Entropy Coding) Run Length Encoding (RLE) Statistical Encoding (Huffman, Arithmetic, LZW) Lossless Predictive Coding (DPCM) Bitplane Encoding
Figure 2.1: Lossless Coding Technique (Subramanya, 2001)
[image:35.595.121.518.327.667.2]Lossy Coding Technique (Source Coding) Block Truncation Coding Block Truncation Coding Block Truncation Coding Block Truncation Coding Block Truncation Coding
[image:35.595.125.517.499.672.2]14
2.3.2 Establish Compression Algorithm
Even though nearly all image processing applications can accept some loss of information, in numerous critical areas such as medical, satellite, and legal imaging, lossless compression algorithms are preferred (Zanma et al., 2017). The Joint Photographic Expert Group (JPEG), Context Based, Adaptive, Lossless Image Codec (CALIC), JPEG-LS, and JPEG2000 are among outstanding lossless image compression algorithms that give high compression ratio in a practical time (Celik et al., 2003). The compression ratio for a typical image is best offered by CALIC, while JPEG-LS provides a low complexity alternative and JPEG provides a unified approach to lossy-to-lossless compression (Bekhtin, 2011).
2.3.2.1JPEG
The Joint Photographic Expert Group (JPEG) is used since nearly three decades ago. This standard is used for the digital compression and coding of a continuous tone. JPEG is based on the Discrete Cosine Transform (DCT) algorithm where it first partitioned to a 8 x 8 pixels block. It is then transformed by using the DCT rules and the coefficients produced is rearranged into 64 subband. It is then quantized using block-based scalar quantization and encoded using Huffman coding (Pan et al.,
2010).
The quality of the reproduced image using JPEG is good where it can reach up to 10:1 compression ratio. When the ratio is higher than that, it begins to show an artificial block effect that degrades the quality of an image (Rehna, 2012).
Loss of information occur highly at the quantization stage because of the rounding process at the floating number, thus it is not suitable for an image exposed to multiple edits as many losses will happen. Besides that, it is also not suitable for images with rich texture and edges, since sharp contrast between adjacent pixels will cause visible artifacts (Tudela, 2012).
2.3.2.2CALIC
Context Based, Adaptive, Lossless Image Codec (CALIC) invented by Wu et al.
15
predetermined pattern of neighbor pixels. The algorithm is capable in learning from the errors made in the previous predictions and in this way it can improve its prediction adaptively when the compression proceeds.
Pixel values are calculated by a non-linear predictor, which chooses the prediction pixels and the particular prediction function amongst numerous potential prediction functions on the basis of the local context. The context is built up of the local gradient magnitudes in horizontal and vertical directions. The coefficients are chosen based on the training set drawn from the type of images to be compressed. The final set of prediction errors is coded by the entropy coder. CALIC is proved as providing the best compression ratios in a reasonable time over typical images (Owenzhao et al., 2010).
2.3.2.3JPEG-LS
JPEG-LS (Weinberger et al., 2000) is the lossless/near lossless compression standard for continuous-tone images. It is based on context modeling and predictive coding combined with Huffman coding. The values of pixels are predicted adaptively based on an edge detector’s output. The predicted value is chosen based on three neighboring pixels (Li, 2013).
2.3.2.4JPEG 2000
On the other hand, JPEG 2000 provides the international standard for image compression that give extra features where it can be operated in network and mobile environment. In JPEG 2000, the image is transformed into components and decomposed into tiles. Each tile is then applied with a wavelet transform to perform different resolution levels (Kim et al.. 2011).
A subband of coefficients (decomposition level) illustrate the frequency characteristics of a tile. Subband coeffiecient is then quantized and entropy coded so that the Region of Interest (ROI) can be coded at higher quality than Region of Background (ROB) (Skodras et al., 2001).
16
wavelet-based algorithm, which also provides a combined approach for lossy-to-lossless compression (Wu et al., 2009).
The invention of JPEG 2000 was to manage with the problem arising in JPEG besides to cope with today’s extreme digital imaging demand, especially in image quality and size. JPEG 2000 offers efficiency, scability as well as interoperability in multi environments. Some of the features provided by JPEG 2000 are Region of Interest (ROI) coding, robustness to bit error, progressive transmission, open architecture and image security (Bekhtin, 2011).
In pre-processing part, the image is tiled into a non-overlapping block to reduce the memory usage. DWT is used to transform the image into a set of coefficients. The coefficients are quantized using uniform scalar dead zone quantization algorithm. Then, arithmetic coding is used to compress the binary symbol (Kim et al., 2016).
JPEG 2000 provides a good environment and function that supports image application such as remote sensing, medical imaging, e-commerce, mobile application and many more. It offers compression efficiency with error flexibility. However, more work is still needed to enhance its capability (Bharti et al., 2009).
2.4 Image Compression Framework
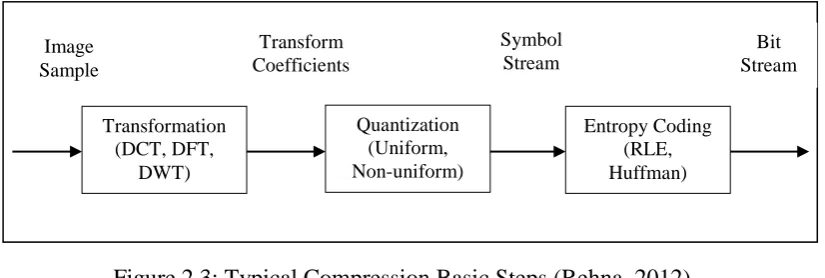
Basically, compression algorithms consist of three basic steps: transformation, quantization and entropy coding as shown in Figure 2.3.
At the first stage, the image is transformed using transformation algorithm to produce an effective code representation of an image. Then, it is quantized to reduce
Transformation (DCT, DFT,
DWT)
Quantization (Uniform, Non-uniform)
Entropy Coding (RLE, Huffman) Image
Sample
Transform Coefficients
Symbol Stream
[image:38.595.125.538.543.682.2]Bit Stream
17
the number of possible output symbols. After that, it is encoded using entropy coding that encodes the symbol produced in the previous stage (Jain & Johari, 2016).
Transformation is a process of decorrelating the input samples, while quantization will quantize the transform coefficients and most of the information lost occurred here. The compression process generates the compressed value of quantized symbols before the transform coder outputs the bit streams that represent the coded signal (Abo-Zahhad et al., 2013).
While doing the compression, there are two things which need to be considered: fewer bits must be generated besides different between the original and reconstructed image must be retained small. This is where the challenge comes (Andries et al., 2014).
2.4.1 Transformation Process
The initial step in image compression is to transform the image from spatial domain to the transform domain using transform algorithm such as Discrete Cosine Transform (DCT), Discrete Fourier Transform (DFT), Discrete Wavelet Transform (DWT) and many more. The reasons of having transformation are to compact the energy and decorrelation. Energy in an image is spread in the whole image. So, by transforming the image, a large portion of energy can be concentrated in a low frequency region of transform domain (Mulla et al., 2015).
Usually wavelet is implemented due to its great energy compaction and it is good for human visual. Transformation process also will produce a large number of wavelet coefficients having a value of zero, or near zero and magnitude (Wu, 2014).
2.4.2 Quantization Process
18
transform will approximate the images when the inverse transform is performed (Rehna, 2012).
The human visualization is good at identifying small dissimilarity in brightness for a large area, but not so good at examining the exact strength of a high frequency (rapidly varying) brightness variation. In other words, the eye is most sensitive to low frequencies (upper left corner) and less sensitive to high frequency (lower right corner). Therefore, an amount of information can be reduced by ignoring the high frequency components (Jain & Johari, 2016). This process can be done by simply dividing each component in the frequency domain by a constant for that component, and then rounding it to the nearest integer. This is the main lossy operation in the whole process (Ahmadi et al., 2015).
2.4.3 Entropy Process
After the quantization process, entropy coding is performed to further compress the quantized data to give extra compression values. It is a reversible yet lossless compression. Entropy is a measurement of unpredictability of a system. It is used to find a reversible mapping to the quantized values so that the average number of bits or symbols is minimized. Minimum entropy value will lead to optimal threshold. The example of entropy codings are Arithmetic Coding and Huffman Coding (Sugimoto
et al., 2011)
Generally, the natural image gets finer edges because of its well-ordered state, while the polluted or reconstructed image has a bad order state that give a blurred, discontinuous and short edge effect (Wu et al., 2005). This effect is called blocky artifact. The blockiness occurred in busy regions during the quantization process that use block-based coding.
2.5 Wavelet Algorithm
19
movies, color images and signals. It also has been widely used in data compression, fingerprint encoding and also image processing (Nguyen et al., 2011).
2.5.1 The Principle of Wavelet
Wavelet is a ‘small’ wave that zeroed the value outside the fixed interval time or space. It can be shifted or scaled to decompose a signal into different scales of resolution (Mukherjee, 2011). Wavelet will give different perceptions when something is observed from different locations. Like the eyes of humans do, for example, when the forest is observed from the above, it is spotted as a splash of green, while if it observed in a moving vehicle, it can be seen as a flashing forest. Conversely, if we observe the forest by walking, we can see the forest in more detail, such as the leaves, the root, the trunk as well as the structure of the trunk. There are three properties of wavelets: (a) separability, scability and translability; (b) multiresolution compatibility; and (c) orthogonallity (Gonzalez & Woods, 2002).
Another interesting feature of wavelet is that it lessens the blocky artifact that usually appear in high ratio JPEG compression. The traditional DCT tends to hide irregularities that carry important information, thus resulting in smoother edges and yielding many non-zero coefficients to be coded. The wavelet is better in localizing the edges and anomalies. As a result, it yields few non-zero coefficients and many zero coefficients. However, the disadvantage of wavelet is it hard to state the location of non–zero coefficients. To solve this problem, the Significance Map (SM) is introduced by indicating the location of the wavelet coefficient in binary array (Muzaffar & Choi, 2008). The SM typically needs a large portion of bit budget, thus the zerotrees is specified for SM for an efficient encoding.
Generally, natural images on average have a large amount of wavelet coefficients at lower subband and smaller amount of wavelet coefficient at higher subband. Larger coefficient values contain significant information while a near-zero coefficient value is simply can be ignored because it just carries a slightly insignificant value (Rehna, 2012).
20
approximate and detail components in multiresolution character is also useful for denoising, data compression and feature extraction (Sudhakar et al., 2005).
Besides that, wavelet has special features in which it has a flexible window size to determine accurately either time or frequency. It uses a narrower window at high frequency for a better resolution while using a wider window at low frequencies for better frequency resolution. The behavior of wavelet has some similarity with the human Deoxyribonucleic Acid (DNA) behavior: duplicating the essential unit and shifting into different permutations providing a varied range of different properties (Walker & Nguyen, 2001).
Another best thing about wavelet is it allows multiple compression algorithms integrated into one algorithm. Thus, this makes it very popular amongst researchers (Xiu & Zhu, 2010).
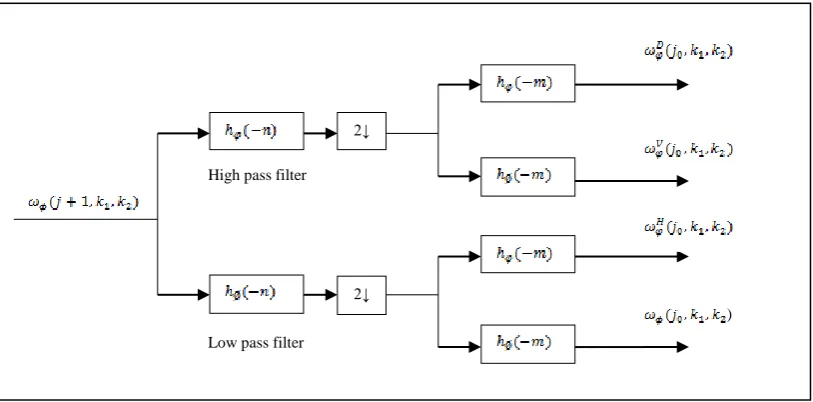
2.5.2 Discrete Wavelet Transformation (DWT)
Discrete Wavelet Transform (DWT) is an algorithm that sampling the small wave discretely. It can effectively separate the frequency of input into high frequency and low frequency subbands leading to a better resolution capability (Liu & Chen, 2016).
The DWT gains its popularity in image compression because it can represent a reasonable quality of compressed image using only a small amount of original signal (Andries et al., 2014). This process is done by using flexible signal filters offered by DWT that allow the user to suppress the signal at desired point, frequency or parameter (Velho etal., 2009). Here, a compact data format is produced and this is the reason why DWT is widely used in file, audio, image and video compression.
Typically, DWT uses two filters, namely analysis filter and synthesis filter. The analysis filter is used to split the original signal to several spectral components called subband. The signal first pass a low pass filter for approximation coefficients outputs that results in a smooth effect. Then, it will pass through the high pass filter for detailed coefficients that enhance the details.
21
an image are thrown out or set to zero. This is called the thresholding process and it give a smoothing effect to the image (Vijay et al., 2012).
The analysis filter is repeated on approximate subbands since it contains a large energy content which is 1/64 of the original image size (Walker & Nguyen, 2001), while the detail subbands carry small coefficients as can be perceived on the black region in detail subbands. This multiresolution capability will enable the user to treat the subbands independently depending on the needs of the application.
The process of downsampling the image using DWT is illustrated as in Figure 2.4.
Let’s an image with the size of N1 x N2 be expressed in image function as s(n1,n2). By applying DWT scaling function filter to the image function, it will generate the wavelet coefficients of an approximate subband.
1 2
0 1 2
1 2
1 1
0 1 2 1 2 ( , , ) 1 2
0 0
1 2 1
( , , ) ( , ) ( , )
N N
j k k n n
j k k s n n n n
N N
(2.1)where;
j0 is the wavelet scale;
k1 and k2 are the index written from n1 and n2 respectively; is the scaling function filter.
2↓
2↓ High pass filter
Low pass filter
[image:43.595.110.517.277.478.2])
22
While for Diagonal, Vertical and Horizontal subbands, the wavelet filter, φ is apply to the image function:
1 2
0 1 2 1 2
1 1
0 1 2 1 2 ( , , ) 1 2
0 0 1 2 1 ( , , ) ( , ) ( , ) N N D D
j k k
n n
j k k s n n n n
N N
(2.2)1 2
0 1 2 1 2
1 1
0 1 2 1 2 ( , , ) 1 2
0 0 1 2 1 ( , , ) ( , ) ( , ) N N V V
j k k n n
j k k s n n n n
N N
(2.3)1 2
0 1 2 1 2
1 1
0 1 2 1 2 ( , , ) 1 2
0 0 1 2 1 ( , , ) ( , ) ( , ) N N H H
j k k n n
j k k s n n n n
N N
(2.4)
where;
0 1 2
( , , ) D
j k k
carries the diagonal wavelet coefficients details;
0 1 2
( , , ) V
j k k
carries the vertical wavelet coefficients details;0 1 2
( , , ) H
j k k
carries the horizontal wavelet coefficients details; is the wavelet filter.
For example, an image with size of 256 x 256 will produce 65536 coefficients value at each subband. For instance, the total coefficient value at Horizontal subband are 65536 where each coefficient value can be obtained by extracting the image information using image function s n n( ,1 2)and scaling function
0 1 2
( , , )( ,1 2)
H
j k k n n
at
each pixel location( ,k k1 2). The same process also happen in Vertical, Diagonal and
Approximate subbands (Liu & Chen, 2016).
The approximate coefficients are commonly called as LL (low resolution approximate image) while the detail coefficients are called as HL (intensity variation along column, horizontal edge), LH (intensity variation along row, vertical edge) and HH (intensity variation along diagonal).
23
inserted between two coefficients because during the downsampling, the every second coefficient is thrown away (Vijay et al., 2012).
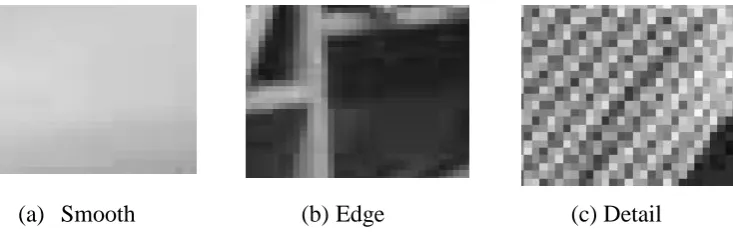
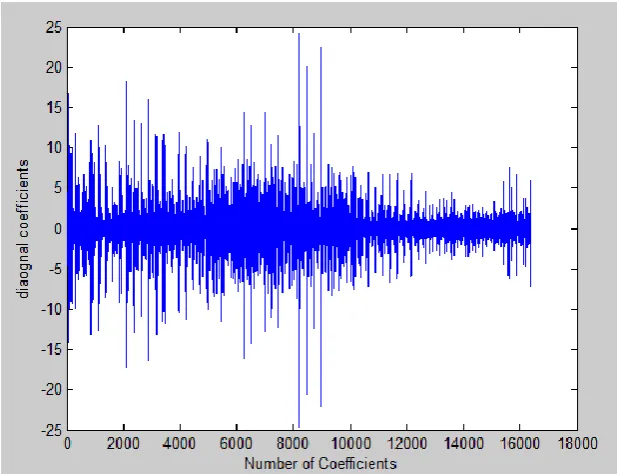
Wavelet algorithm enables the computer to decompose an image into various levels with a different-value resolution. The apparent advantage is it enables to isolate and manipulate data with specific properties. For example, Barbara image (see Figure 2.6) with pixel size 512 x 512 will produce 256144 wavelet coefficients in each subband. Barbara image is having more diagonal detail (see Figure 2.7) compared to vertical details (see Figure 2.8) and horizontal details (see Figure 2.9). These wavelet coefficients have significant effects on the quality of the image produced.
At horizontal, vertical and diagonal subband, there are a large number of near zero coefficients. These ‘near-zero’ coefficients are actually representing the smooth region of an image (background of an image or region with light texture). Modification at these coefficients will not harm the Peak Signal to Noise Ratio (PSNR) since our Human Visual System (HVS) finds it hard to detect any changes in the smooth region area (Hsia et al., 2012).
Oppose to it, the significant coefficients represent the fine details such as pattern on the table top and edges for example bookshelf on Barbara’s image (refer Figure 2.5). Modification on these coefficients will harm the PSNR value since our HVS is very keen in detecting small changes in these high valued coefficients (Sari & Shimamura, 2013).
[image:45.595.140.507.524.647.2](a) Smooth (b) Edge (c) Detail Figure 2.5: Different Image Characteristic (Andries et al., 2014)
24
Figure 2.6: Standard Grey Scale Barbara Image (Sari et al., 2012)
[image:46.595.164.474.378.615.2]6REFERENCES
Abdulla, A. A. (2010). Combining of Spatial and Frequency Domain Transformation With The Effect of Using and Non-Using Adaptive Quantization for Image Compression. IJCSI International Journal of Computer Science Issues, 7(6), 278–284.
Abirami, J., Sivasankari, K. N. S., & Ramya, S. (2013). Performance analysis of image compression using wavelet thresholding. IEEE Conference on Information and Communication Technologies, (ICT), 194–198.
Abo-Zahhad, M., Al-Ajlouni, A. F., Ahmed, S. M., & Schilling, R. J. (2013). A new algorithm for the compression of ECG signals based on mother wavelet parameterization and best-threshold levels selection. Digital Signal Processing,
23(3), 1002–1011. http://doi.org/10.1016/j.dsp.2012.11.005
Abu, N. A., Ernawan, F., & Suryana, N. (2013). A Generic Psychovisual Error Threshold for the Quantization Table Generation on JPEG Image Compression, 8–10.
Ahmadi, K., Javaid, A. Y., & Salari, E. (2015). Signal Processing : Image Communication An efficient compression scheme based on adaptive thresholding in wavelet domain using particle swarm optimization. Signal
Processing : Image Communication, 1–7.
http://doi.org/10.1016/j.image.2015.01.001
Andries, B., Lemeire, J., & Munteanu, A. (2014). OPTIMIZED QUANTIZATION OF WAVELET SUBBANDS FOR HIGH QUALITY REAL-TIME TEXTURE COMPRESSION, 5616–5620.
Athilakshmi, R., Jayanthi, J., & Chithra, B. (2014). HIGH QUALITY EDGE PRESERVATION USING WAVELET BY LLSURE IMAGE FILTERING.
International Journal of Advance Research in Computer Science and Electronics Engineering, 3(4), 236–241.
131
http://doi.org/10.1109/TIP.2013.2277801
Ayu, P., Savitri, I., Murdiansyah, D. T., & Astuti, W. (2016). Digital Medical Image Compression Algorithm Using Adaptive Huffman Coding and Graph Based Quantization Based on IWT-SVD. In Fourth International Conference on Information and COmmunication Technologies (Vol. 4).
Baranitharan, K. (2013). Approximation Coefficient Histogram, 228–230.
Bartrina-rapesta, J., & Aulí-llinàs, F. (2015). Cell-Based Two-Step Scalar Deadzone Quantization for High Bit-Depth Hyperspectral Image Coding, 12(9), 1893– 1897.
Bekhtin, Y. S. (2011). Adaptive wavelet codec for noisy image compression. In 2011 9th East-West Design & Test Symposium (EWDTS) (pp. 184–188). Ieee. http://doi.org/10.1109/EWDTS.2011.6116587
Belc, D. I. (2006). A Hybrid Wavelet Filter for Medical Image Compression.
Department of Electrical and Computer Engineering. Florida State University, Florida.
Bernatin, T., & Sundari, G. (2014). Video compression based on hybrid transform and quantization with Huffman coding for video codec. 2014 International Conference on Control, Instrumentation, Communication and Computational
Technologies, ICCICCT 2014, 452–456.
http://doi.org/10.1109/ICCICCT.2014.6993004
Bharti, P., Gupta, S., & Bhatia, R. (2009). Comparative Analysis of Image Compression Techniques: A Case Study on Medical Images. 2009 International Conference on Advances in Recent Technologies in Communication and Computing, 820–822. http://doi.org/10.1109/ARTCom.2009.88
Biswas, M., & Om, H. (2012). A New Soft-Thresholding Image Denoising Method.
Procedia Technology, 6, 10–15. http://doi.org/10.1016/j.protcy.2012.10.002 Bruckmann, A., & Uhl, A. (2000). Selective medical image compression techniques
for telemedical and archiving applications. Computers in Biology and Medicine,
30(3), 153–69. Retrieved from http://www.ncbi.nlm.nih.gov/pubmed/10758230 Bruni, V., & Vitulano, D. Ã. (2007). Combined image compression and denoising
using wavelets. Signal Processing: Image Communication, 22, 86–101. http://doi.org/10.1016/j.image.2006.11.006
132
http://doi.org/10.1016/S0923-5965(03)00023-7
Chang Kee, C. (n.d.). Image Compression using Wavelet Transform.
Cheng, H., & Lerner, C. (2015). Bit Allocation for Lossy Image Set Compression.
IEEE Pacific Rim Conference on Communication, Computer and Signal Processing, 52–57.
Dengwen, Z., & Wengang, C. (2008). Image denoising with an optimal threshold and neighbouring window. Pattern Recognition Letters, 29(11), 1694–1697. http://doi.org/10.1016/j.patrec.2008.04.014
Devi, P. S. A., & Mini, M. G. (2012a). Compression of Computed Radiographic Images Using Linear Prediction on Wavelet Coefficients. In 2012 International Conference on Advances in Computing and Communications (IEEE Conference Publication) (pp. 130–133). Ieee. http://doi.org/10.1109/ICACC.2012.29
Devi, P. S. A., & Mini, M. G. (2012b). Compression of Medical Images by Prediction on Wavelet Transform Coefficients. Bonfring International Journal
of Advances in Image Processing, 2(4), 9–16.
http://doi.org/10.9756/BIJAIP.3085
Enesi, I., & Zanaj, E. (2011). Wavelet Image Compression Method Combined with the GPCA. In 2011 14th International Conference on Network-Based Information Systems (pp. 559–564). Ieee. http://doi.org/10.1109/NBiS.2011.92 Fuad, N., Taib, M. N., Marwan, M. E., Hussein, T., Mara, K. P., & Pahat, B. (2013).
Evaluation of Left and Right Frontal Sub-Band via Three Dimensional EEG Model in Brain Balancing Application. Australian Journal of Basic and Applied Sciences, 7(5), 1–9.
Gonzalez, R. C., & Woods, R. E. (2002). Digital Image Processing (Second). Upper Saddler River, NJ: Prentice Hall.
Gosavi, H. S. (2016). Need of Integration of Second Generation Wavelets in Medical Image Compression. In 2016 International Conference on Advances in Computing, Communications and Informatics (ICACCI) (pp. 2394–2398). Guo, Q.-Z., Zeng, Z., Zhang, S., Zhang, G., & Zhang, Y. (2016). Adaptive bit
allocation product quantization. Neurocomputing, 171, 866–877. http://doi.org/10.1016/j.neucom.2015.07.062
133
Hashemi-berenjabad, S., Mahloojifar, A., & Akhavan, A. (2011). Threshold Based Lossy Compression of Medical Ultrasound Images Using Contourlet Transform.
18th Iranian Conference on BioMedical Engineering, (December), 14–16. Horng, M. (2012). Expert Systems with Applications Vector quantization using the
firefly algorithm for image compression. Expert Systems With Applications,
39(1), 1078–1091. http://doi.org/10.1016/j.eswa.2011.07.108
Hosseini, S. M., & Naghsh-Nilchi, A.-R. (2012). Medical ultrasound image compression using contextual vector quantization. Computers in Biology and Medicine, 42(7), 743–50. http://doi.org/10.1016/j.compbiomed.2012.04.006 Hou, X., Han, M., Gong, C., & Qian, X. (2015). SAR complex image data
compression based on quadtree and zerotree Coding in Discrete Wavelet Transform Domain: A Comparative Study. Neurocomputing, 148, 561–568. http://doi.org/10.1016/j.neucom.2014.07.007
Hsia, C., Guo, J., & Chiang, J. (2012). A fast Discrete Wavelet Transform algorithm for visual processing applications. Signal Processing, 92(1), 89–106. http://doi.org/10.1016/j.sigpro.2011.06.009
Huimin, C. U. I., Ruimei, Z., & Yanli, H. O. U. (2012). Improved Threshold Denoising Method Based on Wavelet Transform, 33, 1354–1359. http://doi.org/10.1016/j.phpro.2012.05.222
Hussain, A. J., Al-Jumeily, D., Radi, N., & Lisboa, P. (2015). Hybrid Neural Network Predictive-Wavelet Image Compression System. Neurocomputing,
151, 975–984. http://doi.org/10.1016/j.neucom.2014.02.078
Information, F., Technology, C., & Nuswantoro, U. D. (2013). TMT Quantization Table Generation Based on Psychovisual Threshold for Image Compression, 202–207.
Isaac, M. M., & Wilscy, M. (2015). Image Forgery Detection Based on Gabor Wavelets and Local Phase Quantization. Procedia Computer Science, 58, 76– 83. http://doi.org/10.1016/j.procs.2015.08.016
Iwahashi, M., Kobayashi, H., & Kiya, H. (2012a). Fine Rate Control and High SNR Coding for Sparse Histogram Images. In Picture Coding Symposium (pp. 205– 208).
Iwahashi, M., Kobayashi, H., & Kiya, H. (2012b). Lossy compression of sparse histogram image. 2012 IEEE International Conference on Acoustics, Speech