A Study on the Visualization Skills of
6th Grade Students
Ayten Özkan1, Elif Esra Arikan2,*, Erdoğan Mehmet Özkan1
1Department of Mathematics, Yildiz Technical University, Turkey 2Department of Education, Istanbul Sabahattin Zaim University, Turkey
Copyright©2018 by authors, all rights reserved. Authors agree that this article remains permanently open access under the terms of the Creative Commons Attribution License 4.0 International License
Abstract
Visualization is an effective method for students to internalize concepts and to establish correlations between concepts. Visualization method is especially more important in mathematics which is perceived as the combination of abstract concepts. In this study, whether 6th grade students can solve questions about ‘Fractions’ by using visual model and whether they can utilize visualization or not was searched. A literature scan about the visualization in teaching mathematics and an achievement test involving 10 questions were implemented for this study. The participants are 50 6th grade students who are studying at public and private schools in various parts of Istanbul. They were asked to solve questions by using visual model method. In accordance with the findings, it can be said that 6th grade students have difficulties in using visual model while studying on fractions and they prefer calculation by considering rules without using.Keywords
Fractions, 6th Grade Students, Visual Model, Visualization1. Introduction
Visualization; includes features to make an object, body, substance, product or behavior, action, process or an activity visible.
For instance, while a student is learning to calculate 2+3=5, s/he also learns the concept of mathematics [1]. In short, visualization suggests a method which makes invisible things visible [2].
When we analyze the literature about the definition of visualization, we can see different kinds of definitions.
Cunningham and Zimmerman [3] defined visualization as; the process of creating or utilizing geometric or graphic representations of concepts, principles or problems in
mathematics either by free-hand drawing or by computer drawing.
Zaskis et al. [4] defined visualization as “the action of making strong correlations between what an individual acquires through an internal concept and what s/he acquires through senses”. It was stated that this visualization process can be realized when a person visualize an object or event that s/he recognized in real life or transfers a structure that s/he imagined by using a computer, board or a piece of paper into physical world.
In other words, it is said that visualization can be a process of constructing visual images sometimes from physical world to our minds or reflecting knowledge from our minds to the physical world.
A more comprhensive definition of visualization was presented by Cunningham and Zimmerman [3] and Hershkowitz [5] as in the following:
“Visualization; creating thoughts that we do not have before and it is a skill and process of interpreting, reflecting and making information more meaningful by using images, visuals, diagrams etc. in order to advance meaning about these thoughts.”
When we look at the definition, it is seen that visualization is a process for helping to advance meaning and in this process, we can use various kinds of two-dimensional visual teaching objects such as images, drawings, figures, graphics, visuals, diagrams and tables.
Today, thanks to the developments in computer technologies, we can use software and animations in visualization. When we use figures and graphics in visualization, abstract or algebraic expressions are presented with the help of geometric models.
In animations, geometrical models of abstract or algebraic expressions are presented in action so that students can see and visualize the concept or change in his/her brain more easily. Software are interactive presentations which involve algebraic expressions of mathematical concepts, present topics to the students by using algebraic examples and which can use geometric models when necessary [8].
One of the important points of visualization is to have students learn how to think visually by using visual models so that s/he can improve his/her understanding about the topic. The ability to think visually helps people to understand events, processes and objects that they observer around them and to construct detailed and comprehensive concrete concepts schemes in their brains. Having a structure in our minds resembling a network affects retention and meaningfulness of the things we learnt positively. Most of the mathematical concepts have an abstract form. Generally, the reason why mathematics is not loved by students and perceived as difficult to understand, boring and dull is the fact that it is an abstract science which cannot do anything about physically. It is emphasized in teaching mathematics program that it can be learnt by everyone. Learning mathematics is up to their interest related to mathematics. Being interested is related to the students' perceptions and it is necessary to organize mathematics lessons in a way to address students' perceptions. In the beginning of the process for learning a topic in mathematics, if you use visualization while teaching concepts and testing whether desired objectives are acquired or not, it will be easier to understand information and to sustain retention. As a result of the previous studies, it was appeared that the more students will make mathematical concepts concrete the more topics will they understand.
It is called as mathematical visualization when you use probable concrete representations of objects in order to approach mathematical abstract correlations in a more effective way. Visualization is a method which is used today at schools. Concretizing should be preferred not only at mathematics classes but also during the other classes in order to make students have a better understanding about abstract concepts.
2. Materials and Methods
As the purpose of this study was to reveal a current situation without changing it, screening model among quantitative research models was utilized. Single screening model was chosen to analyses a spontaneous
situation of a single variable [9].
2.1. Sample and Universe
The participants of the study were chosen by using convenience sampling. Convenience sampling was chosen since it aims preventing time, money and workforce losses [10]. The study was carried out with 50 6th grade students studying at public schools from both Anatolian and European side of Istanbul.
2.2. Data Collection Instruments
In this study, fractions topic was chosen in order to test mathematical visualization skills. Students were asked 10 problems and they were asked to present these problems by using visualization method. However, reliability analysis was conducted with the papers of 27 students. The opinions of experts were collected for reliability and the reliability result of the problem solving test was found as Cronbach Alpha ρ=.751.
2.3. Data Analyses
The answers of the participating students were coded one by one as 1 when they provided correct answers and as 0 when they gave a wrong answer by using IBM SPSS 23 software. Descriptive statistical calculations were made and then one to one interviews were conducted with students who gave wrong answers. The situations open to suggestions in the interviews were presented in the findings part.
2.4. Findings
50 students participating in this study tried to solve an achievement test involving 10 questions about fractions topic by using modelling method. Findings obtained according to the quantitative analysis are presented in details in this section.
The results of the study are displayed in the following table:
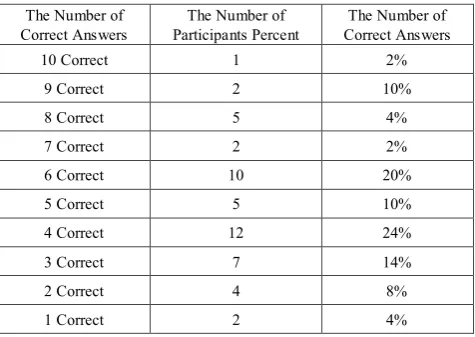
Table 1. The Descriptive Analysis of the Problem-Solving Achievement Test
The Number of
Correct Answers Participants Percent The Number of Correct Answers The Number of
10 Correct 1 2%
9 Correct 2 10%
8 Correct 5 4%
7 Correct 2 2%
6 Correct 10 20%
5 Correct 5 10%
4 Correct 12 24%
3 Correct 7 14%
2 Correct 4 8%
[image:2.595.303.541.582.750.2]According to Table 1, one student among 50 students provided correct answers for all the questions. 2 students gave 9 correct answers, 5 students gave 8 correct answers. Most of the students completed the test with 6 or 4 correct answers. There are 10 students with 6 correct answers and 12 students with 4 correct answers.
Table 2. The Evaluation of the Questions
Correct Wrong Answer No Operations Done with 1st Question 46 3 1 - 2nd Question 45 3 - 2 3rd Question 42 5 1 2 5th Question 12 20 12 6 6th Question 13 20 14 3 7th Question 17 16 15 2 8th Question 26 10 11 3 9th Question 16 10 19 5 10th Question 16 10 17 7 1st Question 46 3 1 -
According to the research results, students have difficulties mostly at questions 4, 5 and 6. Only 12
students out of 50 provided correct answers for the 4th and 6th questions. 13 students could answer 5th question. In addition to this, 6 of the students solved the 4th questions by using operations instead of using modelling method.
When asked students why they did not give the answer by using a visual model, they stated that they did not know how to represent fractions by using a visual model and instead of using a visual model, they preferred to use something easier taught by their teachers, which is ' the fraction of the fraction is multiplied' 5.
The only difference of the 5th question from the 4th question is the fact that this question was asked in a form of a problem. According to the results, 20 of the students gave a wrong answer for the 5th question and 14 of them did not answer this question. Besides, 3 of the students found the correct answer by utilizing operations instead of representing it through modelling. When asked why they did not solve the 5th question to the students who solved the 4th question with operations, they stated that they did not understand the question.
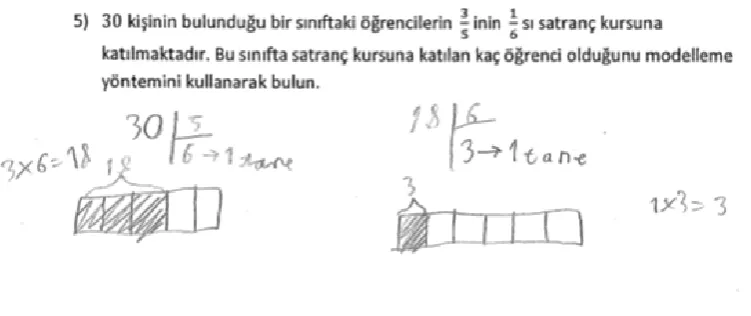
It was determined that students who provided a correct answer for the 5th questions solved the question as in the following.
Figure 1. A sample from the right answers given in question 5
In other words, while they were solving the question, after they divided it to unit squares, they divided unit squares into 6 pieces and then multiplied it to 3.
Figure 2. A sample from the right answers given in question 6
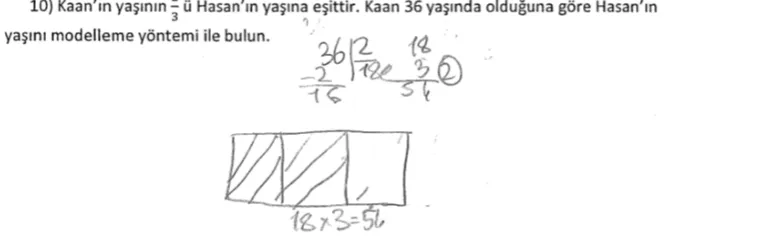
10 questions gave a wrong answer for the 10th question and 17 students did not answer this question. The common mistake of the students who gave a wrong answer is the fact that they tried to solve the from backwards.
Figure 3. A sample from the right answers given in question 10
According to the findings, only 1 student among 50 students provided correct answers for all the questions. When we asked the reason of this to the students, they stated that they do not have basic information about creating visual models. Students expressed that visual models were not emphasized during the lessons, they think that solving questions by using operations is simpler and shorter and in addition to this, in central examinations they do not use visualizations and they do not need it in this sense.
3. Conclusions
There are samples about how to find the fraction of a fraction by using visual method in text books prepared and published by both private sector (page 82) and ministry of education (page 154) to be used by 6th grade students in 2016-2017. Therefore, why students had difficulties in finding the correct answer in question 5 should be questioned. Because of the central exams for a good secondary school, students may not find every teaching method or method valuable. Although creating models for fractions seems waste of time for them, the
number of students who found the correct answer through operations is low. Again, the number of students who could solve question five through the rules that they memorized is 3. It cannot be said that students understand fractions conceptually with all its dimensions. In only question 3 we can see a considerable success from the questions 3, 7, 8, 9 and 10 that are about reaching the whole from parts. Question 3: “what is the number whose 5/6 is 25? Find it by creating a model” is the one which is problematized as in above and is questioning basic information. The other questions were asked as problems. By moving from here, it is seen that students perceive fractions only as a topic and they cannot solve problems when it is used together with other topics. The reason of this can be interpreted as they could internalize fractions. Orhun [11] stated that teaching fractions by using rules can bring an artificial success but this does not make sense in long term, learning fractions with visual models will create a concrete experience and so that their reasoning skills can develop. Işık [12] expressed that prospective teacher have difficulties in having conceptual information while operating on fractions.
[image:4.595.112.498.316.437.2]each other, and thus solving is achieved. If the shape drawn at the beginning is not taking the solution, it is changed by the individual and the solution is completed when the correct shape is drawn. Elia and Philipou (2004) investigated whether the nature of the shape drawn during problem solving affected the solution[13]. In the work they conducted within the qualitative methodology, they worked with eight of the 6th grade students. They investigated the influence of visualization types on problem solving skills of students. It was seen that most of the students preferred the simpler drawings rather than the fancy pictures.
The pupils used the drawing in the sense of the problem. They also found that the drawings of the students were more effective than the drawings given in the problem.
Visualization should be a method that is applied not only at the elementary school level or the concrete transaction period but every period. When the mathematics program renewed by the 2017-2018 academic year is examined, there is an "achievement to be made with real life situations and appropriate fraction models" for the 6th grade.
Fractions topic which students have difficulties in understanding in the second part of the primary education was discussed as the subject of this study. An achievement test involving 50 questions for finding the whole from the parts and the parts from the whole was given to students and as students do not have enough conceptual understanding about 'calculating the fraction of a fraction' and solving problems containing fractions, desired success cannot be obtained. If these kinds of problems are not solved in the early periods, when the fractions topic is enlarged, students can develop negative attitudes towards mathematics. In this sense, before teaching fractions topics, each student should be informed about how they will use and encounter fractions in their everyday lives because using real life problems prevent students from having a fear and anxiety towards mathematics [14].
Using visualization to make students to be competent about the topics is very important in terms of taking their interests to the lesson and concretizing abstract operations in their minds. Visualization has an important role in explaining the correlations between numbers, concretizing the correlations in equations and having an assistant role for creating correlations easily with symbols [15].
In order to make your students more successful in their lessons, teachers have a crucial role. As the participants of the study are individuals who are at concrete operations period, they need concrete images and visuals while thinking over abstract concepts [16]. If we consider this fact, it is thought that using visualization frequently during the lessons will be helpful.
If we consider the fact that fractions topic is a difficult one , it can be said that visualization is almost an obligation for teaching this topic.
The number of students who thought that questions 5
and 6 represent same concept as an expression and tried to find the correct answer is 19. Therefore, it is necessary to give opportunities to students to analyse which desired pieces correspond to what by using visualization.
If it is thought that concrete concepts can be a problem in constructing abstract concepts as a result of inappropriate structuring in mind [17], it can be said that visualization is an important building block in conceptualization
It is thought that students who do not find visualization valuable will have difficulty in mathematics lessons in the future. Because visualization allows for a better understanding of the complex and abstract mathematical issues. In the later topics of mathematics, it should be ensured that visualization is a frequent method to understand more abstract concepts such as dimension concept in terms of students [18]
REFERENCES
[1] E. M. Gray, D. O. Tall. Duality, ambiguity, and flexibility: A" proceptual" view of simple arithmetic. Journal for research in Mathematics Education, 116-140, 1994.
[2] B. H. McCormick. Visualization in scientific computing. Computer graphics, Vol.21, No.6, 1-14, 1987.
[3] S. Cunningham, W. Zimmerman. Visualization in teaching and learning mathematics. Mathematical Association of America Notes, New York, USA, 1991.
[4] R. Zazkis, E. Dubinsky, J. Dautermann. Coordinating visual and analytic strategies: A study of students' understanding of the group D 4. Journal for research in Mathematics Education, 435-457, 1996.
[5] R. Hershkowitz, R. Visualization in Geometry--Two Sides of the Coin. Focus on learning problems in mathematics, No.11, 61-76, 1989.
[6] M. Dereli. The effects of teaching the integers subject by cartoon to the students? Mathematical succeess. Master
Thesis, Marmara University, İstanbul, 2008.
[7] M. E. Özdemir, A. Duru, L. Akgün. İki ve üç boyutlu düşünme: iki ve üç boyutlu geometriksel şekillerle bazı özdeşliklerin görselleştirilmesi. Kastamonu Journal of
Education, Vol. 13, No.2, 527-540, 2005.
[8] A. C. Konyalıoğlu. Investigation of effectiveness of
visualization approach on understanding of concepts in vector spaces at the university level. Ph. D. Thesis, Atatürk University, Erzurum, 2003.
[9] N. Karasar. Bilimsel Araştırma Yöntemi. (12. Baskı). Nobel Yayın Dağıtım, Ankara, 2003.
[10]Ş. Büyüköztürk, E. Kılıç Çakmak, Ö. E. Akgün, Ş. Karadeniz, F. Demirel. Bilimsel Araştırma Yöntemleri,
Pegem A, Ankara, 2009.
[11]N. Orhun. A Cognitive Gap between Formal Arithmetic and
University Journal of Education, Vol.8, No.13, 99-111, 2007.
[12]C. Işık. İlköğretim matematik öğretmeni adaylarının kesirlerde çarpma ve bölmeye yönelik kurdukları
problemlerin kavramsal analizi. Hacettepe University Journal of Education, Vol.41, No.41, 2011.
[13]Elia, I., & Philippou, G. The Functions of Pictures in Problem Solving. International Group for the Psychology of Mathematics Education. PME 28. 327-334, Retrieved from: https://files.eric.ed.gov/fulltext/ED489736.pdf. 2004 [14]G. Gresham, T. Sloan, B. Vinson. Reducing mathematics
anxiety in fourth grade" at-risk" students. ERIC Clearinghouse, 1997.
[15]A. Arcavi. The role of visual representations in the learning
of mathematics. Educational studies in mathematics, Vol. 52, No.3, 215-241, 2003.
[16]M. T. Battista, G. H. Wheatley, G. Talsma. The Importance of Spatial Visualization and Cognitive Development for Geometry Learning in Pre-service Elementary Teachers, Journal for Research in Mathematics Education, Vol.13, No.5, 332-340, 1982.
[17]Hitt, F. The Role of Semiotic Representations in The Learning of Mathematics. Bills, L. (Ed.) Proceedings of the British Society for Research into Learning Mathematics, 18(3). 1998
[18]Kakmacı, Ö. Altıncı sınıf öğrencilerinin uzamsal görselleştirme başarılarının bazı değişkenler açısından