© 2017, IRJET | Impact Factor value: 5.181 | ISO 9001:2008 Certified Journal
| Page 432
DEFECTS ANALYSIS AND OPTIMIZATION OF PROCESS PARAMETERS
USING TAGUCHI DoE TECHNIQUE FOR SAND CASTING
Anil Rathore
1, Prof. F. Ujjainwala
21
Research Scholar, Industrial & Production Engineering Department, Shri G.S. Institute of Technology & Science, 23
Park Road, Indore, M.P., India
2
Assistant Professor
, Industrial &Production Engineering Department, Shri G.S. Institute of Technology &
Science, 23 Park Road, Indore, M.P, India.
---***---Abstract -
Although Metal Casting is an earliest known process, industries are suffering from the poor quality of casting because of a large number of parameters are involved in the process. The quality can be improved by reducing the defect through optimization of process parameters. In this paper, a systematic procedure is given to analyze the cold shut defect and reduce it by optimizing the parameters. A cold shut defect is found in the delivery casing which is produced by using gray cast iron. The quality control tools like Check Sheets, Histograms, Pareto Analysis and Fishbone Diagrams are used to analyze the defect and to find the parameters which affect the final quality of casting. Three parameters are selected which affect most to the final quality which is Pouring Temperature, Pouring Time and Gating System. Taguchi Technique is used for optimization of the parameters and Orthogonal Array is used for experimental purpose. In trial and error method a large number of shop floor experiments are required, Taguchi Orthogonal Array reduces these number of trials and save time and cost and give accurate results. Minitab software is used to apply Taguchi Technique for optimization. Taguchi gives the optimum value of parameters, after applying the optimum values on shop floor the defects are reduced up to a minimum.Key Words: Sand Casting, Cold Shut defect, Quality Control tools, DoE, Taguchi, Optimization.
1. INTRODUCTION
Metal casting is one of the earliest phenomenon known to a human being. It is the first step in the production and manufacturing of metallic components. It generally means pouring molten metal into a refractory mould with a cavity of shape to be made and allowing it to solidify. After solidification of the metal desired metal object is taken out from the mould either by breaking the mould in the case of expandable mould or taking the mould apart in case of permanent mould [9]. The process is called casting process and product is casting. Sand casting is also known as sand moulding process which is one of the cheapest methods. Over 70% of castings are produced by only sand casting processes. There are a number of parameters are involved in the sand casting process so it is very difficult to produce defect free casting. Number of defects occurs if the
parameters are not optimized i.e. Cold Shut, Misrun, Blow hole, Flash, Swelling, and Mismatch etc.
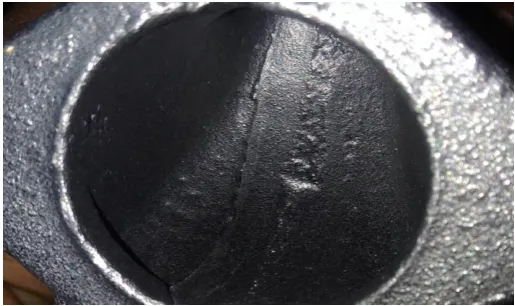
A cold shut is formed due to the imperfect fusion of two streams of metal into the mould cavity. It may appear like a crack or seam with rounded edges. The reasons behind the occurrence of this defect are less fluidity of molten metal, less wall thickness, improper gating system and slow pouring.
Fig -1: Cold Shut defect in Delivery Casing
2. LITERATURE SURVEY
B.R. Jadhav and Santosh J Jadhav [1] Worked on Investigation And Analysis Of Cold Shut Casting Defect And Defect Reduction By Using 7 Quality Control Tools. This paper represents a systematic procedure to analyze and minimize the cold shut defect in an automobile cylinder block which has a material gray cast iron Grade FG150. In this paper, they reduce the defect by controlling alloy composition and pouring temperature. To analyze and reduce defects the seven quality control tools are used which Include check sheet, Pareto analysis, cause effect diagram, flow chart, scatter diagram, histogram and control chart. The
trails show that temperature range 1418 to 1432 ℃ gives a
reduction in cold shut while considering other defects. The recommended range of phosphorous is 0.12 to 0.2%, phosphorous increases flowability so percentage should be towards upper control limit. Silicon percentage limit is recommended between 1.83 to 2.0%.The total rejection of
[image:1.595.307.565.349.502.2]© 2017, IRJET | Impact Factor value: 5.181 | ISO 9001:2008 Certified Journal
| Page 433
Borikar et al. [2] worked on Optimization of casting components by Minimizing cold shut defect. They observed that 80% of rejections are mainly due to cold shut. The authors carried out different techniques to minimize Cold Shut. This defect also in the moulds which are not properly vented because of the back pressure of the gases. By various control tools, the ranges of temperature, Phosphorous, and Silicon are find out. The temperature range for the minimum
defect is 1362 - 1382℃ which reduces Cold Shut from 9% to
5% and Phosphorous percent is 0.06% maximum for minimum defect while Silicon range is 2.4-2.6%.
Harvir Singh and Aman Kumar [3] described the Minimization of the Casting Defects Using Taguchi’s Method. The author used Taguchi’s method for experimental purpose and used Minitab 17 to find the optimum solution. Three-month data has been collected from the foundry after analysis it has been found that the 80% rejections were only because of cold shut, scab, and shrinkage. The major cause of defects was analyzed through the fish bone diagram and
the main cause is Pouring Temperature (℃), Sand Particle
Size (AFS), Mould Hardness Number and Permeability Number. Taguchi L9 orthogonal array method is used for the experiments. MINITAB 17 is used to find the optimum solution which is for pouring temperature is 1340℃, for Permeability number is 150, for Sand particle Size is 42 AFS and for Mould Hardness Number is 91.132. By applying the optimum solution the rejections level reduced from 6.25% to 4.416%.
Chatrad et al [4] described A Study on Minimization of Critical Defects in Casting Process Considering Various Parameters. The author applies the process parameters optimization for reducing the defects like cold shut, blowhole, run, porosity and sand inclusion. The author collected the four months data from the industry for better understanding the occurrence of a defect. The cause effect diagrams were prepared for various defects. The 9 experiments were performed based on DoE by varying the main three factors which are pouring temperature, handling time and pouring time. The results give the optimum range
of temperature which is 1420-1450℃, handling time is 9-11
second and pouring time is 4-5 seconds.
Shantanu Joshi and B.R. Jadhav [5] Described Casting defect reduction and productivity Improvement in Automotive Component. The author used the design of experiments technique to analyze the sand related defects in shell mould casting. Cause effect diagram used to find the root cause of defects and parameters identification. The most influencing parameters selected for the experimental purpose. Based on Taguchi 9 experiments conducted and responses measured. ANOVA analysis is done which defined that which casting process parameters significantly affect the percentage of rejection in casting. The defect is reduced from 3.2 % to a maximum up to 1.5%.
3. RESEARCH METHODOLOGY
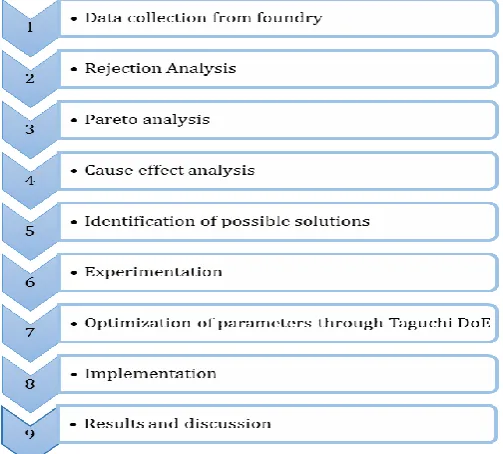
The research methodology starts with the collection of data from the small scale foundry then the data analysis is done through quality control tools. After data analysis experimentation is done by varying the major parameters and optimization is done through Taguchi DoE in Minitab software.
Fig -2: Research Methodology
4. DATA COLLECTION
The Three-month data have been collected from a small scale foundry, the material used for casting is Grey Cast Iron. The production and rejection data are collected from quality department and graph is plotted between the rejection percentage and types of components. The 10 components are selected which has high rejections and out of them a component which has high rejection is selected for research work.
[image:2.595.308.560.208.435.2]© 2017, IRJET | Impact Factor value: 5.181 | ISO 9001:2008 Certified Journal
| Page 434
The histogram shows the rejection data of one month. From data, it has been found that some components are suffering from high rejections. These rejections are mainly due to the sand related defects. From the analysis of above histogram, Splash Delivery Casing has maximum rejection percentage. Other two month data also shows that the Splash Delivery Casing has maximum rejection percentage so it is taken for the research work.
5. PARETO ANALYSIS
A trial has been conducted to find the various defects which occur in the casting of Splash Delivery Casing. Out of 484 Castings, 45.66% castings were rejected. It is seen that from
45.66% total rejection, 78.28 % castings are rejected only
because of Cold Shut defect and 21.72 % defects are
because of Core Lift, Casting Break, Mould Break and Swelling.
Chart -2: Pareto Analysis
Pareto analysis works on 80/20 principle which states that 80% of rejection occurs only because of 20% defects. From
the analysis of above Pareto chart, it is clear that 91.86 %
rejections are only because of two types of defects which are
Cold shut and Core Lift. So by working on cold shut defect we can increase the productivity and reduce overall defect.
Fig -3: Location of defect in Splash Delivery Casing
A cold shut occurs in the curved wall at the intake of the delivery casing of monoblock pump.
6. CAUSE EFFECT ANALYSIS
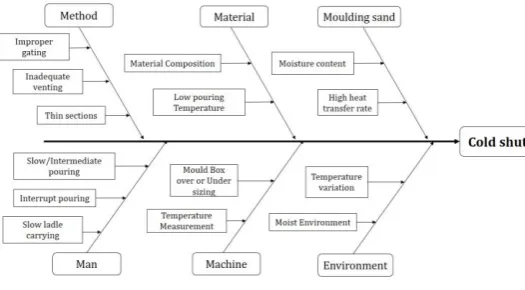
Ishikawa Diagram for cold shut defect is shown in figure 4 which shows the major causes of the defect i.e. Cold Shut. There are six major causes for cold shut defect which are Man, Machine, Method, Material, Moulding Sand, and Environment. Each cause has multiple parameters which affect the final product. Each parameter which has influence in final casting is shown in the Cause Effect Diagram.
Fig -4: Fishbone Diagram for Cold Shut
The analysis gives all possible parameters which are responsible for cold shut defect but not all the parameters are equally responsible for the defect. Some parameters are less responsible while some have a major influence on the occurrence of defect. So it is necessary to identify those parameters which are highly responsible for the defect. The parameters which are major responsible for cold Shut defect are Less fluidity of molten metal, high moisture content in moulding sand, slow and intermediate pouring, slow ladle carrying, improper gating and less wall thickness.
7. POSSIBLE SOLUTIONS
The solutions for above causes follows:
1) Increase the fluidity: The fluidity can be increased by increasing the pouring temperature (Jadhav et al, 2013) and by changing the metal composition (increase the Silicone and Phosphorous content) (Kumar et al, 2015). 2) Moisture Content: By keeping the moisture up to optimum level Cold Shut defect can be reduced. (Kinagi et al, 2014).
3) Skilled Manpower: In manual pouring the pouring should be done by experienced person. The pouring time should be optimized. Intermediate pouring should not be done (chatrad et al, 2016).
4) Methoding: The design of gating system should be accurate. Gating design is such that the cavity should fill within minimum time without causing any defect. 5) Sectional Thickness: the component should be
[image:3.595.309.572.223.368.2] [image:3.595.37.288.324.457.2]© 2017, IRJET | Impact Factor value: 5.181 | ISO 9001:2008 Certified Journal
| Page 435
For complex component, the wall thickness should be sufficient to fuse the two metal streams properly.
8. SELECTION OF PARAMETERS & SIGNAL LEVELS
FOR TAGUCHI ANALYSIS
Three parameters are selected for experimentation which is
Pouring Temperature (℃), Gating system and Pouring Time
(Seconds). Metal composition and other parameters are not taking because of some limitation. Parameters are described below:
1) Pouring Temperature: The temperature range in these case is from 1320 –1450 ℃. The aim is to
define a range of temperature which gives minimum rejections.
2) Gating system: The gating system is changed from previous gating and experiments are conducted for changed gating system and for the previous gating. 3) Pouring Time: Pouring is done manually so the pouring time varies according to the human's skills. In these research pouring time which has minimum rejection is found through optimization.
The selection of Signal levels are done for shop floor Experiments which are in the following table:
Table -1: Signal level for Experiments
9. SELECTION OF ORTHOGONAL ARRAY
The orthogonal array is selected from Array Selector. For three factors and two levels L4 orthogonal array is suggested so for experimentation the L4 orthogonal array is used
which shown in below Table:
Table -2: Signal level for Experiments
10. EXPERIMENTATION
Based on L4 orthogonal array four experiments are performed on the shop floor. A different set of the parameter is taken for each experiment and the output is recorded after each variation in response which is in the following table:
Table -3: Experimentation Results
11. OPTIMIZATION OF PARAMETERS
The responses of experiments are recorded for the optimization. The optimization of research parameters is done in the Minitab 16 software through Taguchi Design of Experiments Technique. In this research, the focus is on a single defect which is cold shut so while inspection there is the only single defect is considered in the results. Because the major problem is because of cold shut defect.
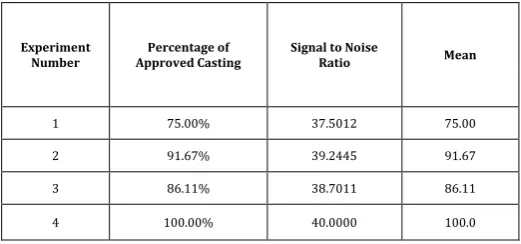
[image:4.595.305.566.503.625.2]The Signal to Noise Ratio and mean is shown for the each experiment in table 4. Signal represents the desired value which is Percentage of approved casting in this case and noise represents undesirable value.
Table -4: S/N Ratio and Mean for the Experiments
The SN ratios for different factors and different levels are shown in table 5. The rank is also given with the parameters. Rank shows that which factor has a high impact on the response. The average SNR for each signal level and for each factor is shown in Table 5 which is calculating by using following:
S/N = −10log × (Σ(1/Y2)/n) [5]
Where, n= Number of Experiments, and y= Percentage of approved casting.
S. No. Parameter Name level 1 level 2
1 Pouring Temperature (℃) 1320-1390 1390-1420
2 Gating System No Change Change
3 Pouring Time ( Second) 15 13
Number of
Experiment Temperature Pouring Gating System Pouring Time
1 1 1 1
2 1 2 2
3 2 1 2
4 2 2 1
Experi ment Numbe r
Signal level for parameters Total Casting Poured
Number of casting approved
Percentage of Casting Approved Pouring
Temp.
Gating System
Pouring Time
1 1 1 1 36 27 75.00%
2 1 2 2 36 33 91.67%
3 2 1 2 36 31 86.11%
4 2 2 1 32 32 100.00%
Experiment
Number Approved Casting Percentage of Signal to Noise Ratio Mean
1 75.00% 37.5012 75.00
2 91.67% 39.2445 91.67
3 86.11% 38.7011 86.11
© 2017, IRJET | Impact Factor value: 5.181 | ISO 9001:2008 Certified Journal
| Page 436
Table -5: Response Table for S/N Ratio
12. RESULTS AND DISCUSSION
The results of optimization are shown below, the plots are shown for Mean and S/N Ratio in this section.
12.1 Main Effects Plot for Quality
The main effect plot is an outcome of the optimization that gives the uniform difference between the different levels of a factor. When there is a consistent trend among the different levels of a factor then the situation is same as these outputs. Figure 5 gives the main effect for Means for different Factors and for each level.
2 1
96 92 88 84 80
2 1
2 1
96 92 88 84 80
Pouring Temperature
M
e
a
n
o
f
M
e
a
n
s
Gating System
Pouring Time
Main Effects Plot for Means Data Means
Fig -5: Main Effect Plot for Means
The Main Effects Plot indicates following for given factors:
I. Pouring Temperature: At level 2 (1390-1420℃) the Percentage of Approved Casting is between 92 and 96 which is higher than level 1 (1320-1390 ℃) in
which Percentage of Approved Casting is between 80 and 84.
I. Gating System: Plot shows that after changing the gating system at level 2 the Percentage of Approved Casting is near about 96 while at level 1 where gating is not changed the Percentage of Approved Casting is between 80 and 84.
II. Pouring Time: At level 2 (13 Second) the Percentage of Approved Casting is between 84 and 88 which is higher than level 1 in which Percentage of Approved Casting is Between 88 and 92.
12.2 Main Effects Plot for SN Ratios
The Main Effects Plot for SN ratios is shown in figure 6 which shows the SN ratios for different factors. The Signal to noise ratio is plotted for the condition of Larger is better. For the higher value of Percentage of approved Casting, the SN Ratio should be as high as possible. The high value of Signal to Noise ratio required for a robust system.
2 1
39.6 39.2 38.8 38.4 38.0
2 1
2 1
39.6 39.2 38.8 38.4 38.0
Pouring Temperature
M
e
a
n
o
f
S
N
r
a
ti
o
s
Gating System
Pouring Time
Main Effects Plot for SN ratios
Data Means
Signal-to-noise: Larger is better
Fig -6: Main Effect Plot for SN Ratio
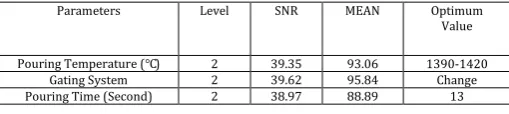
[image:5.595.37.287.119.162.2]The optimized value of parameters for Splash Delivery Casing is shown in the following table:
Table -6: Optimum values for Parameters
Parameters Level SNR MEAN Optimum Value
Pouring Temperature (℃) 2 39.35 93.06 1390-1420 Gating System 2 39.62 95.84 Change Pouring Time (Second) 2 38.97 88.89 13
13. IMPLEMENTATION
The corrections are made in gating system and the pouring is done under controlled condition between temperature 1390
to 1420 ℃ and pouring time is 13 Second. From optimization,
the first priority is for Gating System and the second priority is for Pouring temperature so all three parameters are implemented and results are recorded which are following:
Table -7: Implementation Results
Level Pouring Temperature Gating System Pouring Time
1 38.37 38.10 38.75
2 39.35 39.62 38.97
Delta 0.98 1.52 0.22
Rank 2 1 3
Total Number of Casting Poured
Number of Approved Casting
Percentage of Approved Casting
[image:5.595.308.568.208.390.2] [image:5.595.36.293.342.512.2] [image:5.595.309.564.485.542.2]© 2017, IRJET | Impact Factor value: 5.181 | ISO 9001:2008 Certified Journal
| Page 437
14. CONCLUSION
The research work can be concluded by following points:
The Quality Control tools like Histograms, Pareto
Analysis and Fish bone Diagrams are used to analyze and identify the most defective component, major defect and various causes for the defect respectively.
Four experiments are conducted on the shop floor
for the component based on Taguchi L4 Orthogonal Array method and responses are recorded.
Optimization of the parameter is done by Taguchi
DoE Technique with the help of Minitab Software and the graphs are plotted for Larger is better condition.
The optimized value of parameters for Splash
Delivery Casing are Pouring Temperature
1390-1420 ℃, Gating System should be changed and
Pouring Time is 13 second. The highest priority is for Gating system.
By applying the optimal values for the production
an Experiments is conducted and it has been found that the Cold Shut defect is reduced from 35.74% to 1.4%.
REFERENCES
[1]
B. R. Jadhav and Santosh J Jadhav, (2013),“Investigation And Analysis Of Cold Shut Casting Defect And Defect Reduction By Using 7 Quality Control Tools”, International Journal of Advanced Engineering Research and Studies, E-ISSN2249–8974, pp 28-30.
[2]
Vinod Borikar, Kapgate N., Prashant G. Wairagade, RaniA. Kshirsagar, Aniket D., (2017) “Optimization of casting components by minimizing cold shut defect”, International Journal Of Advance Research And Innovative Ideas In Education, Vol-3, Issue-2, ISSN(O)-2395-4396, pp 124-128.
[3]
Harvir Singh and Aman Kumar (2016), “Minimizationof the Casting Defects Using Taguchi’s Method”, International Journal of Engineering Science Invention, ISSN (Online): 2319 – 6734, ISSN (Print): 2319 – 6726, Volume 5, Issue 12, PP 06-10.
[4]
Beeresh Chatrad, Nithin Kammar, Prasanna Kulkarniand Srinivas P Patil, (2016) “A Study on Minimization of Critical Defects in Casting Process Considering Various Parameters.” International Journal of Innovative Research in Science,Engineering, and Technology, Vol. 5, Issue 5, ISSN (Online): 2319-8753, ISSN (Print): 2347-6710, pp 8894-8902.
[5]
Shantanu Joshi and B. R. Jadhav, (2015), “Casting defectreduction and productivity Improvement in Automotive Component”, International Journal for Research in Applied Science & Engineering Technology
(IJRASET), Volume 3 Issue VI, ISSN: 2321-9653, pp 192-196.
[6]
Yokesh J Kumar, K S Amirthagadeswaran and SripriyaGowrishankar (2015), “Casting process optimization for reducing the cold shut defect in casting using response surface methodology”, Indian Journal of Engineering & Material Science, Vol. 22, pp 187-194.
[7]
Prasan Kinagi and R. G Mench, (2014), “A Developmentof Quality in Casting by Minimizing Defects”, International Journal of Recent Research in Civil and Mechanical Engineering, Vol. 1, Issue 1, pp: (31-36).
[8]
Bose V Binu and K N Anil Kumar (2013), “Reducingrejection rate of castings using Simulation Model”, International Journal of Innovative Research in Science, Engineering and Technology, Volume 2, Special Issue 1, ISSN (Online) : 2319 – 8753, ISSN (Print) : 2347 – 6710, pp 589-597.
[9]
P N Rao, (2004), Manufacturing technology, secondedition, Tata McGraw- Hill publishing Company Limited, 2014.
BIOGRAPHIES
Mr. Anil Rathore, Research Scholar
Industrial & Production
Engineering Department, Shri G.S. Institute of Technology & Science, 23 Park Road, Indore, M.P., India
Prof. F. Ujjainwala, Assistant