http://dx.doi.org/10.4236/msce.2015.31003
Characterisation of Thin Films Using a
Coherence Scanning Interferometry
Yang Yu, Daniel Mansfield
Taylor Hobson Ltd., PO Box 36, 2 New Star Road, Leicester, LE4 9JQ, UK Email: [email protected]
Received November 2014
Abstract
Accurate measurement of film thickness and its uniformity are very important to the performance of many coated surfaces and for many applications are critical. Effective inspection of the film thickness and uniformity is the key to high performance. Conventionally, film thickness is meas- ured using a spectrophotometer/reflectometer, ellipsometer or a physical step measurement; however, these techniques all have limitations. Coherence Scanning Interferometry (CSI) is an es-tablished method to measure surface topography as this technique offers many advantages such as speed, ease of use and accuracy. The measurement of “thick” films (exceeding ~1.5 µm) which gives rise to clearly separate fringe bunches is a well-established CSI capability. However, a me-thodology known as the ‘helical complex field’ (HCF) [1] [2] function allows film thickness to be measured down to ~25 nm. This new method, combined with Coherence Correlation Interferome-try (CCI) [3] offers film thickness measurements with sub-nanometre vertical resolution and ~1 µm lateral resolution. It is ideally suited for detailed analysis of coated optical surfaces. In this paper, the fundamentals of the techniques are described and some case studies are presented.
Keywords
Film Thickness, CCI, Thick Film, HCF
1. Introduction
Thin films are widely used in many high-technology industries, such as solar PV, semiconductors, MEMs, dis-plays, parylene coatings, hard coatings and photoresists. Effective measurement of thin film thickness is always a demand by both research and industry.
Various metrology tools have been employed to measure film thickness. These include conventional methods such as spectrophotometry, ellipsometry and physical step measurement in addition to the established method of Coherence Scanning Interfererometry. Other methods have also been used to investigate coating thickness, such as wavelength interferometry, prism couplers and thermal wave detection with a laser beam.
The non-contact Coherence Correlation Interferometry (CCI) instrument is an advanced coherence scanning interferometer which provides fast and accurate high-resolution 3D surface measurements and film thickness measurements.
applica-tions: photoresist coatings, anti-reflection coatings and DLC coatings. Some of the results are also compared with conventional techniques.
1.1. Photoresists [4]
Photoresists have many applications in numerous technologies, including semiconductor and printed circuit board manufacture as well as in MEMS, solar PV, holography and biomedical engineering. Correct exposure of the photoresist film is the key in controlling production costs: an incorrect exposure dose will result in an in-crease in the number of failed pattern parts. The exposure time can be obtained by measuring the photoresist film thickness, as a relationship exists between the developed resist film thickness and the exposure dose.
It is generally not realistic to make a precise predetermination of the proper exposure because it can be very difficult to produce ‘ideal’ photoresist films that exhibit both a uniform correct thickness and constant refractive index. To meet these requirements and then to control the exposure of the photoresist films, it is necessary to accurately measure the thickness and distribution of the photoresist coating, typically on a wafer, during or after the photoresist formation process.
1.2. Anti-Reflection Coatings Used in Photovoltaics Devices [5] [6]
The performance of a solar cell is measured in terms of its efficiency at turning sunlight into electricity. High ef-ficiency together with low manufacturing and lifetime costs in PV solar cells are the biggest concerns for most solar designers and manufacturers. In order to maximise efficiency, solar panels need to absorb as high a per-centage of incident light as possible.
Standard solar panels normally reflect more than a third of the light energy to which they are exposed. This means that over 30% of the light—and potential electricity—is lost.
In order to increase solar panel efficiency, anti-reflection coatings are applied to the surface of the panels so as to cancel out this reflection. This technique brings great benefits to the solar industry through its ease of ap-plication and low cost.
AR coatings play an important role in solar PV cells. In silicon photovoltaics, for example, anti-reflection coatings are used to improve the light trapping capability and efficiency. Silicon nitride thin film coatings represent the most common passivation technique used for silicon photovoltaics. The thickness of a silicon nitride layer is critical for its anti-reflective properties, since a quarter wavelength is optimal.
Obtaining accurate measurements of both the thickness and roughness of AR coatings on solar PV cells is critical to their efficiency and reliability as well as in maintaining low production costs. Most AR coating mate-rials used in solar cells are fragile and a non-contact, non-destructive metrology solution is often essential.
1.3. Diamond Like Carbon (DLC) Coating [7] [8]
Diamond-like carbon (DLC) coatings are used to modify the surfaces of materials and improve primarily the tribological properties. DLC coatings are used in a wide range of applications because they have many advan-tages because of their low cost, relative ease of application and their ability to provide some of the properties of diamond to surfaces of almost any material, particularly Germanium and Silicon.
The DLC layer requires a specific thickness to achieve the desired surface properties. For example, DLC coatings are often optimised for a specific wavelength region by adjusting the layer thickness during the coating process to deliver good BBAR (Broadband Anti-reflective) performance. Precise control of the DLC film thick-ness is important for optimising the coatings for both R&D and industrial purposes.
2. Measurement Techniques
2.1. CCI (Coherence Correlation Interferometry)
smooth. Given its low level light sensitivity together with its ability to provide both thickness and roughness in a single measurement, the CCI is proving itself a very versatile instrument.
2.2. Traditional Thick Film Technique
When the thickness of the film is larger than ~1.5 µm (the actual thickness will depend on refractive index and NA of the objective lens), the CSI interaction with the measured layer results in the formation of two fringes, each corresponding to a surface interface. This is shown in Figure 1. The CCI algorithm can therefore be used to determine the thickness, by locating the positions of the two envelope maxima, assuming the refractive index is known. In addition, the surface structure of both the top surface (air/film) and the bottom surface (film/ substrate) can also be obtained [1]-[4].
2.3. Film Thickness Technique (HCF) [1] [2]
For thicknesses of films less than 1.5 µm (depending on refractive index), thickness cannot be extracted using the thick film technique due to the coalescence and distortion of the fringes (Figure 2). An alternative method has to be employed.
For thicknesses of films less than ~1.5 µm the two CSI-formed fringes overlap and appear as a single inter-ference fringe bunch as shown in Figure 2. Such film thicknesses cannot be accurately calculated using the tra-ditional thick film technique. An alternative method has to be employed. The patented ‘helical complex field’ (HCF) function has therefore been developed to extract the film information. In order to obtain accurate film thickness, it is necessary to have prior knowledge of the dispersive film index. The HCF approach can be used for the measurement of film thickness within the range of ~25 nm to ~10 µm.
3. Case Studies
3.1. Testing of the HCF Approach
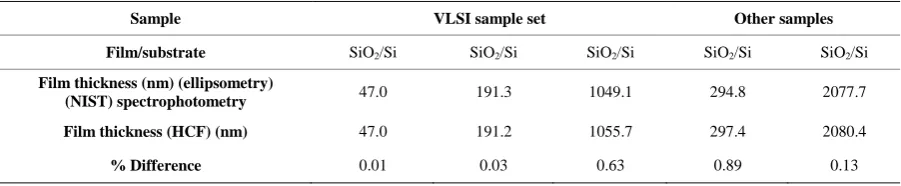
This work was carried out using the measurements of SiO2 films on Si substrates. 5 samples ranging in thickness from ~50 nm to ~2000 nm were tested using CCI HD (HCF). The results are shown in Table 1.
Figure 1. Single pixel measurement from a 7 µm thick film.
[image:3.595.88.539.627.720.2]Figure 2. A single pixel fringe envelope from an actual interferometry mea-surement of Ta2O5 thin film (270 nm) coated on BK7 glass sample. Table 1. Correlation of HCF technique with other common techniques.
Sample VLSI sample set Other samples
Film/substrate SiO2/Si SiO2/Si SiO2/Si SiO2/Si SiO2/Si
Film thickness (nm) (ellipsometry)
(NIST) spectrophotometry 47.0 191.3 1049.1 294.8 2077.7
Film thickness (HCF) (nm) 47.0 191.2 1055.7 297.4 2080.4
3.2. Comparison Test between the HCF Approach and Physical Step Measurement
In this work, a PTB standard which contains a 100 µm strip with SiO2 coating on Si substrate has been measured by using CCI HD and Nanostep. The test results are given in Table 2.
3.3. Comparison Measurements of Photoresist Films on Si Substrates
Three different film thickness samples with photoresist S1813 on Si substrates were used to carry out the tests. The HCF test results were compared to the results from traditional methods: spectrophotometry and ellipsometry. Furthermore, the results from the HCF technique were compared to those from the thick film technique. The re-sults are given in Table 3 and Table 4.
3.4. Comparison Test Measurements of Anti-Reflection Coating Used in
Photovoltaic Devices
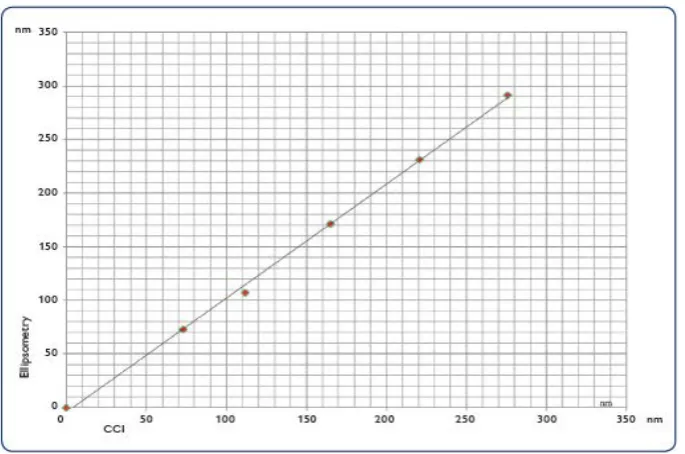
A series of AR thin films of different thicknesses in the range 75 nm to 900 nm for Niobia and 75 nm to 300 nm for Silicon Nitride were prepared using sputtering. The silicon nitride films were deposited onto polished silicon. The Niobia films were deposited onto glass. The ellipsometry data was obtained by taking the average from five different mapped points on the surface. A similar approach was taken using the CCI HD. The accuracy of the film thickness measurement was tested by correlating the results obtained from the same samples using ellip-sometry (Horiba, Jobin Yvon, UVISEL).
Niobia has excellent chemical stability and corrosion resistance. Niobium oxide coating can exhibit different electrical or optical properties depending on deposition techniques and fabrications in order to optimize material characteristics for a given applications [6].
Anti-reflection coatings play an important role in improving light trapping and efficiency. Silicon nitride thin film coatings represent the most common passivation technique used for silicon photovoltaics and can be cha-racterized easily using the CCI technique [5].
Silicon Nitride Coating
[image:4.595.87.534.470.521.2]Five different values of Silicon Nitride coating thickness samples ranging from ~70 nm to ~280 nm were meaured.
Table 2. Comparison between film thickness analysis (HCF) and physical step measurement technique.
Nanostep (nm) CCI HD (nm) Difference (nm) Accuracy
290.6 292.7 2.1 0.7%
[image:4.595.86.540.549.624.2]Repeatability (σ) 0.6
Table 3. Comparison between HCF technique and Spectrophotometry/Ellipsometry techniques.
Sample materials Photoresist on Silicon
Spectrophotometry (µm) 1.085 1.272 1.477
Ellipsometry (µm) 1.088 1.279 1.481
Film thickness analysis (HCF) (µm) 1.083 1.274 1.479
Note: The authors would like to thank CREST of Loughborough University for the ellipsometry measurement results.
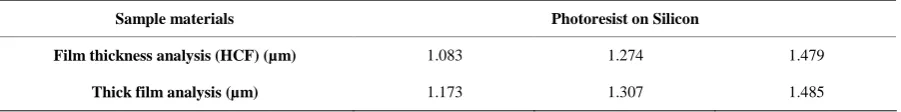
Table 4. Comparison between HCF technique and traditional thick film analysis
Sample materials Photoresist on Silicon
Film thickness analysis (HCF) (µm) 1.083 1.274 1.479
[image:4.595.90.541.664.720.2]3.5. Measurements of Diamond Like Carbon (DLC) Coating on Silicon
Substrate Using CCI HD
Two DLC coating samples with different thicknesses were tested using the HCF technique. In addition, the coating thickness results were compared with those determined using the traditional ellipsometry technique.
4. Discussions
The results from Table 1 show good correlation between the CCI/HCF approach and ellipsometry/spectro- pho-tometry for thicknesses of SiO2 films on Si substrate ranging from ~50 nm to ~2 µm. It can be seen from Table 2 that good agreement was also obtained between the HCF technique and physical step measurement. Table 3 gives the test results from photoresist films on Si by using the HCF approach and conventional methods (spec-trophotometry and ellipsometry). Good correlation is obviously indicated between the HCF and other conven-tional techniques. It can be clearly seen from Table 4 that film thickness analysis (HCF) is more accurate and reliable than thick film analysis. Combining Figure 3 and the corresponding difference between the two meth-ods in Table 4 shows that the error declines with an increasing film thickness, thus showing that the error in thick film analysis is due to the distortion of interference fringes.
Figure 4 and Figure 5 show good correlation results on both Niobia and Silicon Nitride between the HCF technique and the more traditional ellipsometry approach.
Table 5 also gives good correlation results between Film Thickness Analysis (HCF) technique on CCI HD and the traditional ellipsometry technique on DLC coating measurements (Figure 6).
Figure 3. Single pixel fringe for each sample.
Figure 4. Thickness correlation between CCI and ellipsometry–using several Niobia thin films sputtered on glass.
5 fringes 6 fringes 7fringes
Figure 5. Thickness correlation between CCI and ellipsometry using a Silicon Nitride layer on polished silicon.
Figure 6. Auto-pattern measurements were made on a sample with DLC coating on Silicon substrate.
Table 5. Comparison between film thickness (HCF) technique and traditional ellipsometry method
Region 1 2 3 4 5 6
Film thickness (HCF) (nm) 575.2 576.6 570.1 576.6 575.2 568.9
Ellipsometry (nm) ~570
Film thickness (HCF) (nm) 302.8 304.8 302.5 301.7 300.8 301.6
Ellipsometry (nm) ~300
The CCI is able to measure a wide range of film thicknesses down to about ~25 nm, with a lateral resolution of ~1 micron over a large area. The technology is also able to measure surface properties such as roughness, even for these low reflectivity surfaces.
Compared to spectrophotometry and ellipsometry techniques, the CCI HD with higher lateral resolution can provide fast, accurate measurements without sample preparation and requiring minimum operator skills, for ~25 nm to 10 µm thicknesses and over a measurement area ranging from a few µm2 to ~mm2, while spectrophoto- metry can only give a single average film thickness over an area of a few mm2. In addition, CCI HD can provide auto-pattern measurement to show the variation of film thickness through a large area of ~ 100 mm2, to study the uniformity of the films.
1.5 mm 1.5
[image:6.595.86.539.523.600.2]5. Conclusion
The development of the Helical Complex Field (HCF) function together with Coherence Correlation Interfero- metry provides the ideal metrology tool to perform fast and accurate film thickness and uniformity measure- ments for a wide range of film thicknesses (down to 50 nm or less) in large number of film applications.
Acknowledgements
The authors would like to express thanks to Dr Bianca Maniscalco and Prof Mike Walls at CREST of Loughbo-rough University for their valuable ellipsometry measurement results and discussions.
References
[1] Mansfield, D. (2006) Thin Film Extraction from Scanning White Light Interferometry. Proc. of the Twenty First An-nual ASPE Meeting, October.
[2] Mansfield, D. (2008) Extraction of Film Interface Surfaces from Scanning White Light Interferometry. Proc. SPIE,
7101, 71010U. http://dx.doi.org/10.1117/12.797978
[3] Bankhead, A., et al. (2004) Interferometric Surface Profiling, GB2390676.
[4] Yu, Y., et al. (2011) Precision Measurements of Photoresist film Thicknesses Using Scanning White Light Interfer-ometry, International Conference on Mechanical and Electrical Technology, 3rd ICMET, Volumes 1-3.
[5] Maniscalco, B., et al. (2011) Metrology of Silicon Photovoltaic Cells Using Coherence Correlation Interferometry Photovoltaic Specialists Conference (PVSC), 37th IEEE.
[6] Granqvist, C.G. (1992)Electrochromism and Smart Window Design. Solid State Ionics, 53-56, 479-489.
http://dx.doi.org/10.1016/0167-2738(92)90418-O
[7] Lemoine, P., et al. (2006) Measuring the Thickness of Ultra-Thin Diamond-Like Carbon Films. Carbon, 44, 2617- 2624. http://dx.doi.org/10.1016/j.carbon.2006.04.029