7358
CAUSAL DIRECTIONALITY BETWEEN MOBILE PHONE
DEPENDENCY AND MOBILE PHONE USE AMONG
KOREAN ADOLESCENTS
1JUNG AH CHOI
Gyeongbuk, Kyungil University, Department of Social Welfare, South Korea E-mail: 1[email protected]
ABSTRACT
As adolescents using mobile phone rapidly increase, the associated problems are also reported, one of which is mobile phone dependency. While several cross-sectional studies revealed the associations between mobile phone use and mobile phone dependency, little is known about the causal directions between the two variables. To examine the causality, this study developed and empirically tested a series of autoregressive cross-lagged models where prior mobile phone dependency predicts both subsequent mobile phone dependency and mobile phone use, and vice versa, using longitudinal data. The data of 1,148 adolescent mobile phone users from Korean Children and Youth Panel Survey of Grade 4 students who were followed for 6 years (2010-2015) were analyzed using structural equation modeling. Results suggested that prior mobile phone dependency predicted subsequent mobile phone use, while prior mobile phone use didn’t predict subsequent mobile phone dependency. Empirical evidence was found for mobile phone dependency as a causal precedence to mobile phone use.
Keywords: Mobile Phone Dependency, Mobile Phone Use, Autoregressive Cross-lagged Model, KCYPS
1. INTRODUCTION
With rapid progress in information and communication technologies (ICT), their impacts on daily life of people are increasing. Most of all, it is notable that widespread use of mobile phones increases, especially among adolescents. South Korea is one of Asian countries with high mobile phone usage rates [1]. Recent survey reported that 95.0% of Koreans aged over 6 years have mobile phones and the rates have continuously increased since 2011 [2]. It is also reported that 77.0% of elementary school students over Grade 4, 95.3% of middle school students, and 94.7% of high school students have mobile phones in Korea [3]. The comparable rates of mobile phone owners among youths were reported in other Western and Asian countries [1],[4],[5]. Adolescents who frequently use their mobile phones have increased as well. A recent study surveyed to Korean youths reported that 87.6% of teens and 94.0% of youths in their twenties used mobile phones daily in 2016 and the rates have continually increased from 2013—80.2% of teens and 80.9% of youths in their twenties [6].
As ICT devices have become a central part of daily life, dependency on the ICT has been widely discussed and reported. Few studies concerning mobile phone addiction or dependency
have been conducted, especially in adolescents [4],[7],[8],[9], while there have been considerable studies about dependency on or addiction to internet. However, studies addressing the issue of mobile phone use or dependency are increasing fast recently.
Previous studies have investigated a variety of problems associated with mobile phone use or dependency. Mobile phone dependency, being used to describe a problematic or excessive usage pattern of mobile phone [1], has been defined as a state which life patterns of using mobile phone become more salient, self-control for mobile phone use fails, and one continues to use mobile phone, despite serious biopsychosocial consequences [10]. Leung empirically examined the psychological factors of mobile phone dependency and found three factors—“compulsive text messaging”, “compulsive making and receiving calls”, and “obsessive thinking of using mobile phone” [1].
7359 adolescents. According to Sánchez-Martínez and his colleagues, 20.0% of the participants aged 13 to 20 years were reported to be dependent on mobile phone, introducing another study reporting 34.0% of mobile phone dependency prevalence among 12-years-old children in Spain [4]. A study surveyed to Hong Kong adolescents revealed the high-dependency rate to be 16.9%, with the rate of 13.8% for male and 22.7% for female [1].
Meanwhile, a measure of studies found the negative effects of mobile phone dependency or problematic mobile phone use. For example, smart phone over-dependency was found to be associated with a number of psychosocial problems— loneliness, anxiety, depression, impulsivity, low self-esteem, high stress levels and so forth—in Koreans aged 3 to 69 years [10]. Mobile phone dependency was shown to be also associated with attention problems, depression, social relationships, and academic achievement among Korean adolescents [11]. Specifically, the study revealed that mobile phone dependency had positive effects on depression, indicating the stronger the degree of mobile phone dependency, the higher the level of depression, and depression had also negative influences on the social relationships with friends and teachers, indicating the higher the level of depression, the worse relationships with friends and teachers [11]. In addition, mobile phone dependency had negative effects on attention, which had positive effects on language arts and mathematics achievement [11]. These findings revealed that mobile phone dependency was associated with various psychosocial problems not only directly but also indirectly. There were also found comparable study findings reporting the relationships between mobile phone dependency and a variety of maladjustments such as poor health practices [12], poor mother–child relationships [13], psychological distress [9], suicidal attempts and suicidal ideation [14] in Asian countries and Spain. Previous studies have also shown that high frequency of mobile phone use is related to negative outcomes. Lepp and his colleagues examined the relationships between frequent mobile phone use and life satisfaction among American college students [15]. The study findings revealed that mobile phone use and texting influenced life satisfaction indirectly through GPA and anxiety [15]. The associations between mobile phone use and physical health were also investigated. The results revealed that frequent mobile phone use had negative effects on physical health measured by cardio respiratory fitness [16]. Some researchers used a variable combined with
frequencies of mobile phone use and qualitative aspects of mobile phone use to examine the associations between mobile phone use and mental health problems [17].
As described above, researchers used different concepts or measures to elucidate the disadvantageous effects associated with mobile phone use—mobile phone dependency, frequent mobile phone use, and combined measures. While there are conceptual and methodical controversies concerning mobile phone dependency or mobile phone addiction, it should be noted that mobile phone overuse is a different concept with mobile phone dependency [18] and it does not necessarily produce negative outcomes [19]. Given differences and relationships between mobile phone overuse and mobile phone dependency, mobile phone dependency should be considered in the associations between maladjustments and highly frequent mobile phone use.
Meanwhile, there have been substantial studies reporting the significant relationships between mobile phone dependency and mobile phone use [20],[21]. For example, Hong and his/her colleagues found that mobile phone addiction had significant effects on amount of daily calls and text messages [19]. According to the study examining the effects of demographic and psychosocial predictors on intensive mobile phone use among Spanish adolescents aged 13 to 20 years, mobile phone dependency increased the risk of being intensive mobile phone users by three times [4]. Similar findings were reported among Koreans as well—higher frequencies and more time spent in mobile phone use were found in risk group for smartphone over-dependency than normal group [10].
However, the causal directions between the two variables—mobile phone dependency and mobile phone use—were not clearly examined because almost all studies were cross-sectional. Given the causality being unexamined, this study aims to verify the causal direction using longitudinal data and autoregressive cross-lagged (ARCL) model [22]. Specifically, the major research questions are as follows:
1. Is the cross-lagged effects from mobile phone dependency to mobile phone use significant, controlling the autoregressive effects of the two variables?
7360 2. METHODS
2.1 Subjects
Data for this study were drawn from a larger dataset, Grade 4 student panel of Korean Children and Youth Panel Survey (KCYPS). KCYPS is a longitudinal investigation for understanding change patterns of Korean children’s and adolescents’ attitudes and behaviors, and the relevant factors of the patterns [23].
Children and adolescents participated in the study annually from 2010 to 2015. This study analyzed the data of 1,148 mobile phone users. Among the 1,148 participants, 503 (43.8%) were boys and 645 (56.2%) were girls. The average age of the participants was 9.95 years at the first-year survey. The rates of respondents owning mobile phone was 67.7% at Grade 4, 83.6% at Grade 5, 90.0% at Grade 6, 94.3% at Grade 7, 95.1% at Grade 8, and 96.7% at Grade 9, showing increase for 6 years.
2.2 Measures
2.2.1 Mobile phone dependency
Mobile phone dependency was measured using 7 items developed by Lee and his colleagues [24]. The items concern the degree of time increase in using mobile phone use, anxiety felt without mobile phone or calls, feeling isolated without mobile phone, extreme inconvenience without mobile phone, and so forth [23].
Each item was measured with a four-point Likert scale ranging from 1 (very much) to 4 (not at all) and recoded with a high score being associated with a high level. Internal consistency (Cronbach’s α) ranged from .826 to .898 from Time 1 (2010) to Time 6 (2015).
2.2.2 Mobile phone use
Mobile phone use was measured using 9 items, which were about the frequency of phone calls with family members, text messages with family members, phone calls with friends, text messages with friends, playing video games, taking photos, watching video, listening music, and time checking [23].
Each item was measured with a four-point Likert scale ranging from 1 (frequently) to 4 (not at all) and recoded with a high score being associated with a high frequency. The average score of the items was used in the analysis. Internal consistency (Cronbach’s α) ranged from .705 to .724 from Time 1 (2010) to Time 6 (2015).
2.3 Analysis
The longitudinal relations between mobile phone dependency and mobile phone use were examined with autoregressive cross-lagged (ARCL) model where one variable measured at a given time point (t) is regressed on both the variable and the other variable measured at the prior time point (t-1) [16], using structural equation modeling (SEM).
ARCL model has strengths to verify the causal relationships [25]. Autoregressive coefficients reflect the degree one variable at time t -1 has effects on the variable at time t and cross-lagged coefficients indicate the degree one variable at time t is predicted by the other variable at time t -1. The equations for the ARCL model in the bivariate case are as follows:
𝑦 𝛼 𝜌 𝑦, 𝜌 𝑥, 𝜀 , (1)
𝑥 𝛼 𝜌 𝑥, 𝜌 𝑦, 𝜀 , (2)
where 𝛼 and 𝛼 represent the intercepts at time t. In the equations, 𝜌 and 𝜌 represent the autoregressive coefficients, while 𝜌 and
𝜌 represent the cross-lagged coefficients. Random errors are represented by 𝜀 and 𝜀 [26], [27].
While 𝑦 and 𝑥 can be measured variables or latent variables, it is possible to control measurement errors and to statistically examine metric invariance over time in case of latent variable models [28]. This study analyzed the ARCL model using structural equation modeling. The SEM analysis was conducted in two steps, examining a measurement model to define latent variables and a structural model to specify the associations among the latent variables [29]. This study used AMOS 20.0 in the SEM analyses and employed maximum likelihood estimation, while descriptive statistics was analyzed using SPSS 20.0.
7361 3. RESULTS
3.1 Descriptive Analysis
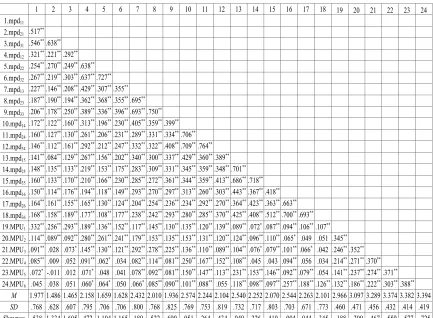
Table 1 presents means, standard deviations, skewness, kurtosis, and intercorrelations for all the measured variables. As shown in table 1,
[image:4.612.90.523.192.510.2]no measure of any variables exceeded a univariate skewness of 2.0 and kurtosis of 4.0. According to the criteria for normality (i.e., skewness: <2.0; kurtosis: <4.0 in SPSS), normal theory maximum likelihood was used in the SEM analyses [32].
Table 1: Descriptive Statistics and Intercorrelations of Measured Variables.
(N=1,148)
Note. mpdit : indicators of mobile phone dependency. i=number of indicators (1-3), t=number of time point (1-6).
MPU=Mobile Phone Use.
* p<.05; ** p<.01
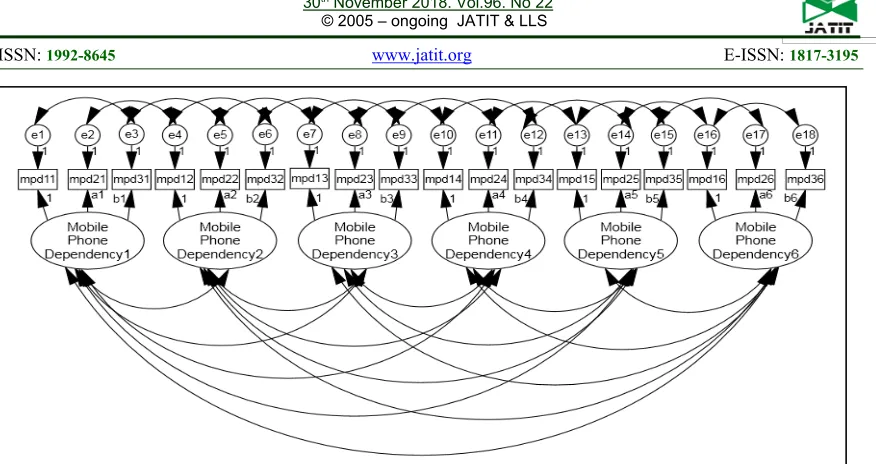
3.2 Measurement Model
The measurement model was estimated using confirmatory factor analysis, as shown in figure 1. Mobile phone use was not included in the analysis, being analyzed as a measured variable. Mobile phone dependency had three indicators, which were constructed using item parceling. A series of measurement invariance tests were conducted to determine the best fit measurement model (see table 2).Model 1 was the baseline model where the first factor loadings of mobile phone dependency from Time 1 to Time 6 were constrained to one, while other factor
loadings were not constrained. Next, all the factor loadings were constrained to be equal across time to test full measurement invariance in Model 2. The χ2 difference test results between Model 1 and Model 2 indicated that full measurement invariance was not hold. The constraints increased the χ2 value from 349.831 to 379.197, obtaining 10
df and the value of χ2 difference between Model 1 and Model 2 was statistically significant (p<.05). The CFI value also decreased from .979 to .978, indicating worse model fit.
Thus, the third factor loadings were unconstrained to be equal across time, while other loadings were constrained in Model 3. The χ2
1 2 3 4 5 6 7 8 9 10 11 12 13 14 15 16 17 18 19 20 21 22 23 24
1.mpd11
2.mpd21 .517**
3.mpd31 .546** .638**
4.mpd12 .321** .221** .292**
5.mpd22 .254** .270** .249** .638**
6.mpd32 .267** .219** .303** .637** .727**
7.mpd13 .227** .146** .208** .429** .307** .355**
8.mpd23 .187** .190** .194** .362** .368** .355** .695**
9.mpd33 .206** .178** .250** .389** .336** .396** .693** .750**
10.mpd14 .172** .122** .160** .313** .196** .230** .405** .359**.399**
11.mpd24 .160** .127** .130** .261** .206** .231** .289** .331**.334**.706**
12.mpd34 .146** .112** .161** .292** .212** .247** .332** .322**.408**.709**.764**
13.mpd15 .141** .084** .129** .267** .156** .202** .340** .300**.337**.429**.360**.389**
14.mpd25 .148** .135** .133** .219** .153** .175** .283** .309**.331**.345**.359**.348**.701**
15.mpd35 .160** .133** .170** .210** .166** .230** .285** .272**.361**.344**.359**.413**.686**.718**
16.mpd16 .150** .114** .176** .194** .118** .149** .293** .270**.297**.313**.260**.303**.443**.367**.418**
17.mpd26 .164** .161** .155** .165** .130** .124** .204** .254**.236**.234**.292**.270**.364**.423**.363**.663**
18.mpd36 .168** .158** .189** .177** .108** .177** .238** .242**.293**.280**.285**.370**.425**.408**.512**.700**.693**
19.MPU1 .332** .256** .293** .189** .136** .152** .117** .145**.130**.135**.120**.139**.089**.072*.087**.094**.106**.107**
20.MPU2 .114** .089** .092** .280** .261** .241** .179** .153**.135**.153**.131**.120**.124**.096**.110**.065* .049 .051 .345**
21.MPU3 .091** .028 .073* .145** .130** .121** .292** .278**.225**.136**.110**.089**.104**.076*.079**.101**.066* .042 .246** .352**
22.MPU4 .085** .009 .052 .091** .062* .034 .082** .114**.081**.250**.167**.152**.108** .045 .043 .094** .056 .034 .214** .271** .370**
23.MPU5 .072* -.011 .012 .071* .048 .041 .078** .092**.081**.150**.147**.113**.231**.153**.146**.092**.079** .054 .141** .237** .274** .371**
24.MPU6 .045 .038 .051 .060* .064* .050 .066* .085**.090**.101**.088**.055 .118**.098**.097**.257**.188**.126**.132** .186** .222** .303** .388**
M 1.977 1.486 1.465 2.158 1.659 1.628 2.432 2.010 1.936 2.574 2.244 2.104 2.540 2.252 2.070 2.544 2.263 2.101 2.966 3.097 3.289 3.374 3.382 3.394
7362
Figure 1: Measurement Model
difference test results between Model 1 and Model 3 indicated that partial measurement invariance was hold—the constraints increased the χ2 value from 349.831 to 359.215, obtaining 5 df and the value of χ2 difference between Model 1 and Model 3 was not statistically significant (p>.05). In addition, the TLI value increased from .970 to .971 and the RMSEA value decreased from .045 to .044, suggesting better model fit. Finally, Model 3 yielded better fit than any other models.
Table 2: Measurement Model Fits and Model Comparisons.
Model χ2 df TLI CFI RMSEA(90%CI) △χ2 △df
1 349.831 105 .970.979.045(.040, .050)
2 379.197 115 .970.978.045(.040, .050) 29.366 10 3 359.215 110 .971.979.044(.039, .050) 9.384 5
Note. Model comparisons
Model 1: Baseline model (a1≠a2≠a3≠a4≠a5≠a6, b1≠b2≠b3≠b4≠b5≠b6)
Model 2: All the factor loadings were constrained to be
equal across time (a1=a2=a3=a4=a5=a6,
b1=b2=b3=b4=b5=b6).
Model 3: The third factor loadings were not constrained to be equal across time (a1=a2=a3=a4=a5=a6, b1≠b2≠b3≠b4≠b5≠b6).
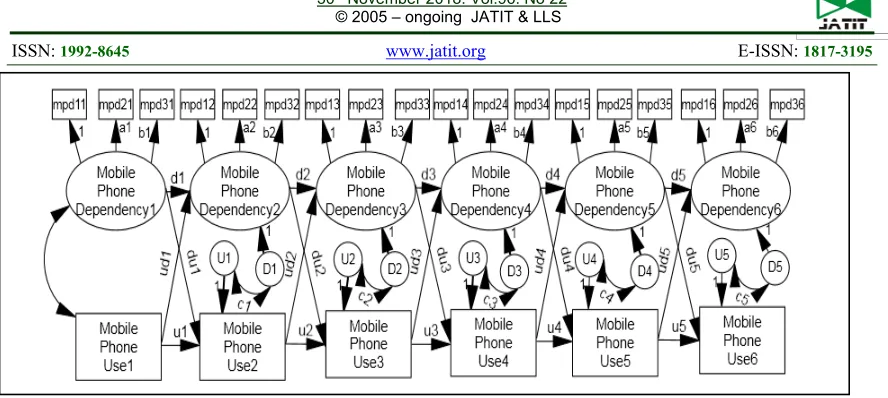
3.3 Structural Model
The best-fit model was determined by comparing a series of ARCL models as shown in figure 2 and table 3. Model 1 was the model where partial measurement invariance of mobile phone dependency was hold and the autoregressive
cross-lagged effects between mobile phone dependency and mobile phone use were freely estimated. Next, error covariances between mobile phone dependency and mobile phone use from Time 2 to Time 6 were additionally estimated in Model 2. Estimation of the error covariances between mobile phone dependency and mobile phone use decreased the χ2 value from 1114.282 to 846.484, losing 5 df and the χ2 difference between Model 1 and Model 2 was statistically significant (p<.05), indicating better fit of Model 2. The TLI value increased from .919 to .942 and the CFI value also increased from .934 to 953, with the RMSEA value decrease from .058 to .050, suggesting the model fit improvement.
7363
Figure 2: Structural Model
[image:6.612.88.302.313.450.2]Note.Measurement errors are not included for simplicity of presentation.
Table 3: Structural Model Fits and Model Comparisons.
Model χ2 df TLI CFI RMSEA
(90%CI) △χ2 △df
1 1114.282 227 .919 .934 .058(.055,.062)
2 846.484 222 .942 .953 .050(.046,.053) 267.798 5
3 850.076 226 .943 .953 .049(.046,.053) 3.592 4
4 852.299 230 .944 .953 .049(.045,.052) 2.223 4
5 856.688 234 .945 .953 .048(.045,.052) 4.389 4
6 864.780 238 .946 .953 .048(.045,.051) 8.092 4
7 883.581 242 .945 .952 .048(.045,.052) 18.801 4
Note. Model comparisons
Model 1: Only the second factor loadings of mobile phone dependency were constrained to be equal across time (a1=a2=a3=a4=a5=a6).
Model 2: Error covariances (c1-c5) were estimated.
Model 3: Autoregressive coefficients of mobile phone
dependency were constrained to be equal
(d1=d2=d3=d4=d5).
Model 4: Autoregressive coefficients of mobile phone use were constrained to be equal (u1=u2=u3=u4=u5). Model 5: Cross-lagged coefficients from mobile phone dependency to mobile phone use were constrained to be equal (du1=du2=du3=du4=du5).
Model 6: Cross-lagged coefficients from mobile phone use to mobile phone dependency were constrained to be equal (ud1=ud2=ud3=ud4=ud5).
Model 7: Error covariances were constrained to be equal (c1=c2=c3=c4=c5).
In Model 5, constraints of the cross-lagged coefficients from mobile phone dependency to mobile phone use being equal over time were added to Model 4. These constraints increased the χ2 value from 852.299 to 856.688, obtaining 4 df and the χ2 difference between Model 4 and Model 5 was not statistically
significant (p>.05). The TLI value increased from .944 to .945 and the RMSEA value decreased from .049 to .048. The results implied that the model fit of Model 5 was better than Model 4. Constraints of the cross-lagged coefficients from mobile phone use to mobile phone dependency being equal across time were added to Model 5, the model called Model 6. The additional constraints increased the χ2 value from 856.688 to 864.780 and also increased df from 234 to 238 by 4. The change in the χ2 value was not statistically significant (p>.05), with the TLI value increase from .945 to .946. The results indicated that Model 6 yielded a better model fit than Model 5. Followed by Model 6, error covariances between mobile phone dependency and mobile phone use from Time 2 to Time 6 were constrained to be equal in Model 7. The χ2 value increased from 864.780 to 883.581 and df
increased from 238 to 242 by 4. The increase in χ2 value was statistically significant (p<.05). The TLI value decreased from .946 to .945 and the CFI value also decreased from .953 to .952, with the same RMSEA value. These results suggested the model fit of Model 7 was worse than Model 6. To summarize, 7 ARCL models were compared and Model 6 yielded the best model fit among these models.
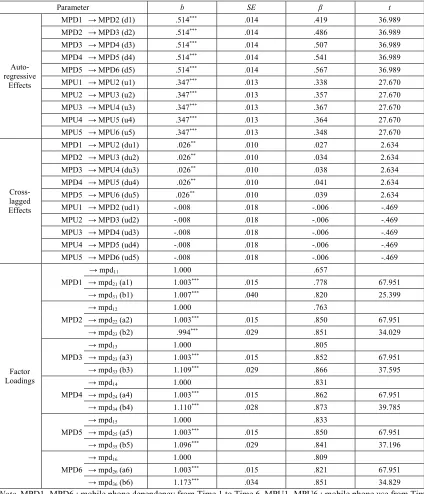
7364 mobile phone use at the prior year, the higher the frequency of mobile phone use at the following year. Third, the cross-lagged effects from prior mobile phone dependency to subsequent mobile phone use (du1-du5) were statistically significant (b = .026, p<.01), while the cross-lagged effects from mobile phone use at prior year to mobile
[image:7.612.91.515.207.701.2]phone dependency at the subsequent year (ud1-ud5) were not significant (b = -.008, p>.05). The results implied that the higher the level of mobile phone dependency at the prior year, the more frequent use of mobile phone, but mobile phone use at the prior year didn’t increase the degree of mobile phone dependency.
Table 4: Parameter Estimates for the Final Model.
Note. MPD1- MPD6 : mobile phone dependency from Time 1 to Time 6, MPU1- MPU6 : mobile phone use from Time 1 to Time 6.
** p<.01; *** p<.001
Parameter b SE β t
Auto-regressive
Effects
MPD1 → MPD2 (d1) .514*** .014 .419 36.989
MPD2 → MPD3 (d2) .514*** .014 .486 36.989
MPD3 → MPD4 (d3) .514*** .014 .507 36.989
MPD4 → MPD5 (d4) .514*** .014 .541 36.989
MPD5 → MPD6 (d5) .514*** .014 .567 36.989
MPU1 → MPU2 (u1) .347*** .013 .338 27.670
MPU2 → MPU3 (u2) .347*** .013 .357 27.670
MPU3 → MPU4 (u3) .347*** .013 .367 27.670
MPU4 → MPU5 (u4) .347*** .013 .364 27.670
MPU5 → MPU6 (u5) .347*** .013 .348 27.670
Cross-lagged Effects
MPD1 → MPU2 (du1) .026** .010 .027 2.634
MPD2 → MPU3 (du2) .026** .010 .034 2.634
MPD3 → MPU4 (du3) .026** .010 .038 2.634
MPD4 → MPU5 (du4) .026** .010 .041 2.634
MPD5 → MPU6 (du5) .026** .010 .039 2.634
MPU1 → MPD2 (ud1) -.008 .018 -.006 -.469
MPU2 → MPD3 (ud2) -.008 .018 -.006 -.469
MPU3 → MPD4 (ud3) -.008 .018 -.006 -.469
MPU4 → MPD5 (ud4) -.008 .018 -.006 -.469
MPU5 → MPD6 (ud5) -.008 .018 -.006 -.469
Factor Loadings
MPD1
→ mpd11 1.000 .657
→ mpd21 (a1) 1.003*** .015 .778 67.951
→ mpd31 (b1) 1.007*** .040 .820 25.399
MPD2
→ mpd12 1.000 .763
→ mpd22 (a2) 1.003*** .015 .850 67.951
→ mpd23 (b2) .994*** .029 .851 34.029
MPD3
→ mpd13 1.000 .805
→ mpd23 (a3) 1.003*** .015 .852 67.951
→ mpd33 (b3) 1.109*** .029 .866 37.595
MPD4
→ mpd14 1.000 .831
→ mpd24 (a4) 1.003*** .015 .862 67.951
→ mpd34 (b4) 1.110*** .028 .873 39.785
MPD5
→ mpd15 1.000 .833
→ mpd25 (a5) 1.003*** .015 .850 67.951
→ mpd35 (b5) 1.096*** .029 .841 37.196
MPD6
→ mpd16 1.000 .809
→ mpd26 (a6) 1.003*** .015 .821 67.951
7365 4. DISCUSSION
This study examined the longitudinal relations between mobile phone dependency and mobile phone use to understand the causal directions between the two variables using ARCL model. The key findings were as follows.
First, the model where error covariances were estimated and each autoregressive cross-lagged coefficient was constrained to be equal yielded the best model fit among the compared ARCL models. Second, autoregressive effects of mobile phone dependency were statistically significant; the mobile phone dependency measured at the previous year had positive effects on the variable measured at the following year. Third, autoregressive effects of mobile phone use were also statistically significant; the mobile phone use at the prior year had positive effects on the variable at the subsequent year. Fourth, the cross-lagged effects from mobile phone dependency to mobile phone use were statistically significant; mobile phone dependency at the previous year had positive influences on mobile phone use at the following year. Finally, the cross-lagged effects from mobile phone use to mobile phone dependency were not statistically significant; mobile phone use at the previous year had no effects on mobile phone dependency at the following year. These findings suggest the causal directions between mobile phone dependency and mobile phone use; mobile phone dependency is a predictor for mobile phone use.
The results showing these causal directions were supported by several studies examining the relationships between mobile phone dependency and mobile phone use. According to these studies, mobile phone dependency or addiction increased mobile phone use frequency [4],[10],[19]. Internet addiction research also supports the direction of relationships between dependency and use. Charlton and Danforth [33] suggested there may be overusers who are not addicted to certain technologies; overuse is not a requirement for dependency but dependency can cause overuse [19].
These findings suggest practical implications. Previous studies which examined the associations between mobile phone overuse and a variety of negative outcomes [15],[16] focused on the roles of mobile phone use without consideration of mobile phone dependency. Mobile phone dependency as a predictor for mobile phone use should be focused in efforts to prevent or alleviate the associated problems with mobile phone use.
Recently, there have been increasingly reported studies examining the predictors for mobile phone dependency [19],[34],[35]. According to these studies, individual factors such as social extraversion, anxiety, and self-esteem [19] and parenting factors including parental monitoring, parental warmth, rational explanation [34], and psychological control [35] were revealed to have effects on mobile phone dependency. As suggested in these previous studies, the predictors for mobile phone dependency should be further investigated and targeted to promote adolescents’ health and adjustments.
While this study advanced our understanding of the causal directions between mobile phone dependency and mobile phone use, there are some limitations to consider. First, bivariate autoregressive cross-lagged effects were examined, although there would be other related variables, for example, the predictors for mobile phone dependency and the outcomes of mobile phone use. Therefore, future research should consider inclusion of the relevant variables in longitudinal analyses. Second, gender differences in the associations were not examined, while there may be gender gaps. Several studies suggested the gender differences in mobile phone dependency or mobile phone use. For example, the higher prevalence of mobile phone dependency [1], [21] and the more frequent use of mobile phone [18] were reported among girls. While these studies investigated gender differences univariatly, future research needs to examine gender gaps in the associations among the relevant variables with mobile phone dependency. Third, this study used the self-report of adolescents. The response may include inaccurate and subjective information, while the self-report of adolescents is supported in accuracy and relevancy [36]. Thus, the more objective measures or responses from multiple respondents (e.g., adolescent respondents and parental respondents) need to be considered for future studies.
7366 nationwide in Korea and surveyed from Grade 4 to Grade 9—the developmental period including not only early adolescence but also middle adolescence. Thus, the study findings are more generalizable.
ACKNOWLEDGEMENTS: This article is based on the author’s paper, ‘Autoregressive Cross-lagged Analyses of Mobile Phone Dependency and Mobile Phone Use among Korean Adolescents’, presented at International Workshop on Convergence Information Technology (IWCIT) 2017, 22 December, 2017, DongSeo University, Busan, Korea.
REFRENCES:
[1] C.H. Leung, “Assessing Mobile Phone Dependency and Teens’ Everyday Life in Hong Kong”, Australian Journal of Psychology, Vol. 69, No.1, 2017, pp.29-38.
[2] J. H. Shin, Y.H. Kim, and Y.S. Oh, 2017 Korean Media Panel Survey, Korea Information Society Development Institute (KISDI), Chungbuk: Korea, 2017.
[3] J.J. Joo, Y.C. Jung, Y.H. Kim., and Y.S. Oh, 2016 Korea Media Panel Survey, Korea Information Society Development Institute (KISDI) Chungbuk: Korea, 2016.
[4] M. Sánchez-Martínez and A. Otero, “Factors Associated with Cell Phone Use in Adolescents in the Community of Madrid (Spain)”, CyberPsychology and Behavior, Vol.12, No.2, 2009, pp.131-137.
[5] L. Chen, Z. Yan, W. Tang, F. Yang, X. Xie, and H. He, “Mobile Phone Addiction Levels and Negative Emotions among Chinese Young Adults: The Mediating Role of Interpersonal Problems”, Computers in Human Behavior, Vol. 55, 2016, pp. 856-866.
[6] Ministry of Gender Equality and Family (MOGEF), 2017 White Paper on Korean Youth, MOGEF, Seoul: Korea, 2017.
[7] L.M. Miller, H. Schweingruber, and C.L. Brandenburg, “Middle School Students’ Technology Practices and Preferences: Re-examining Gender Differences”, Journal of Educational Multimedia & Hypermedia, Vol. 10, 2001, pp.125–40.
[8] D. Madell and S. Muncer, “Back from the Beach but Hanging on the Telephone? English Adolescents’ Attitudes and Experiences of Mobile Phones and the Internet”, CyberPsychology and Behavior, Vol. 7, 2004, pp.359–367.
[9] M. Beranuy, U. Oberst, X. Carbonell and A. Chamarro, “Problematic Internet and Mobile Phone Use and Clinical Symptoms in College Students: The Role of Emotional Intelligence”, Computers in Human Behavior, Vol.25, No.5, 2009, pp. 1182-1187.
[10] S.S. Ryoo, G.W. Nam, and N.R. Um, The Survey on Internet Overdependence, Ministry of Science and ICT ꞏ National Information Society Agency, Daegu: Korea, 2016.
[11] D.G. Seo, Y. Park, M.K. Kim, and J. Park, “Mobile Phone Dependency and Its Impacts on Adolescents’ Social and Academic Behaviors”, Computers in Human Behavior, Vol.63, 2016, pp.282-292.
[12] M. Toda, K. Monden, K. Kubo, and K. Morimoto, “Mobile Phone Dependence and Health-Related Lifestyle of University Students”, Social Behavior and Personality: an international journal, Vol.34, No.10, 2006, pp. 1277-1284. [13] M. Toda, S. Ezoe, A. Nishi, T. Mukai, M. Goto,
and K. Morimoto, “Mobile Phone Dependence of Female Students and Perceived Parental Rearing Attitudes”, Social Behavior and Personality: an international journal, Vol.36, No.6, 2008, pp. 765-770.
[14] P. W. Wang, T. L. Liu, C. H. Ko, H. C. Lin, M. F. Huang, Y. C. Yeh and C. F. Yen, “Association between Problematic Cellular Phone Use and Suicide: the Moderating Effect of Family Function and Depression”, Comprehensive Psychiatry, Vol.55, No.2, 2014, pp. 342-348. [15] A. Lepp, J. E. Barkley, and A. C. Karpinski,
“The Relationship between Cell Phone Use, Academic Performance, Anxiety, and Satisfaction with Life in College Students”, Computers in Human Behavior, Vol.31, 2014, pp.343-350.
[16] A. Lepp, J. E. Barkley, G. J. Sanders, M. Rebold, and P. Gates, “The Relationship between Cell Phone Use, Physical and Sedentary Activity, and Cardiorespiratory Fitness in a Sample of US College Students”, International Journal of Behavioral Nutrition and Physical Activity, Vol.10, No.79, 2013, pp.1-9.
[17] S. Thomée, A. Härenstam, and M. Hagberg, “Mobile Phone Use and Stress, Sleep Disturbances, and Symptoms of Depression among Young Adults-A Prospective Cohort Study”, BMC Public Health, Vol.11, No.66, 2011, pp. 1-11.
7367
[19] F. Y. Hong, S. I. Chiu, and D. H. Huang, “A Model of the Relationship between Psychological Characteristics, Mobile Phone Addiction and Use of Mobile Phones by Taiwanese University Female Students”, Computers in Human Behavior, Vol.28, No.6, 2012, pp. 2152-2159. [20] J. Billieux, M. Van der Linden, M. d'Acremont,
G. Ceschi, and A. Zermatten, “Does Impulsivity Relate to Perceived Dependence on and Actual Use of the Mobile Phone?”, Applied Cognitive Psychology, Vol.21,No. 4, 2007, pp.527-537 . [21] J. Billieux, M., Van der Linden, and L. Rochat,
“The Role of Impulsivity in Actual and Problematic Use of the Mobile Phone”, Applied Cognitive Psychology, Vol.22, No.9, 2008, pp.1195-1210.
[22] J. A. Choi, “Autoregressive Cross-Lagged Analyses of Mobile Phone Dependency and Mobile Phone Use among Korean Adolescents”, Proceedings of International Workshop on Convergence Information Technology (IWCIT) 2017, Korea Society of Computer Information, December 21-23, 2017, pp. 147-148.
[23] National Youth Policy Institute (NYPI). Korean Children and Youth Panel Survey (KCYPS) Data
User's Guide. Retrieved from
http://www.nypi.re.kr/archive/brdartcl/boardarticl eView.do?menu_nix=qZc474Ak&brd_id=BDID X_k9Fd9oFi29nooCcJ7kX1I4&srch_ctgry_idx= CTIDX00043, 25/2/2017
[24] S. Lee, H. Kim, E. Na, S. Lee, S. Kim, J. Bae, J., and B. Choi, Study on Adolescent Mobile Phone Use and the Effects, Samsung Social Mental Health Institute, Seoul : Korea, 2002.
[25] M. J. Delsing and J. H. Oud, “Analyzing Reciprocal Relationships by Means of the Continuous‐Time Autoregressive Latent Trajectory Model”, Statistica Neerlandica, Vol.62, No.1, 2008, pp.58-82.
[26] K. A. Bollen and P. J. Curran, “Autoregressive Latent Trajectory (ALT) Models: A Synthesis of Two Traditions”, Sociological Methods and Research, Vol. 32, No.3, 2004, pp. 336-383. [27] E. Schlueter, E. Davidov, and P. Schmidt,
“Applying Autoregressive Cross-Lagged and Latent Growth Curve Models to a Three-wave Panel Study”, In K. Montfort, J. Oud, and A. Satorra (Eds.) Longitudinal Models in the Behavioral and Related Sciences (pp.315-336), Lawrence Erlbaum Associates, Mahwah: New Jersey, 2007.
[28] S.H. Hong, M.S. Park, and W.J. Kim, “Testing the Autoregressive Cross-Lagged Effects between Adolescents’ Internet Addiction and Communication with Parents: Multigroup Analysis across Gender”, Korean Journal of
Educational Psychology, Vol. 21, No.1, 2007, pp.129-143.
[29] R. E. Schumacker and R. G. Lomax, A Beginner’s Guide to Structural Equation Modelling, Lawrence Erlbaum Associates, Mahwah: New Jersey, 2004.
[30] L. Hu and P. M. Bentler, “Fit Indices in Covariance Structure Modeling: Sensitivity to Underparameterized Model Misspecification”, Psychological Methods, Vol.3, 1998, pp.424-453. [31] L. Hu and P. M. Bentler, “Cutoff Criteria for Fit
Indexes in Covariance Structure Analysis: Conventional Criteria versus New Alternatives”, Structural Equation Modeling, Vol.6, No.1, 1999, pp.1-55.
[32] P. J. Curran, S. G. West, and J. F. Finch, “The Robustness of Test Statistics to Non-normality and Specification Error in Confirmatory Factor Analysis”, Psychological Methods, Vol.1, 1996, pp.16-29.
[33] J. P. Charlton and I. D. W. Danforth, “Differentiating Computer-related Addictions and High Engagement”, In K. Morgan, C. A. Brebbia, J. Sanchez, and A. Voiskounsky (Eds.), Human Perspectives in the Internet Society: Culture, Psychology and Gender (pp. 59–68), WIT Press: Southampton, 2004.
[34] S. M. Bae, “The Relationships between Perceived Parenting Style, Learning Motivation, Friendship Satisfaction, and the Addictive Use of Smartphones with Elementary School Students of South Korea: Using Multivariate Latent Growth Modeling”, School Psychology International, Vol.36, No.5, 2015 pp.513-531.
[35] S. Lee, K. Lee, S. H. Yi, H. J. Park, Y. J. Hong, and H. Cho, “Effects of Parental Psychological Control on Child’s School Life: Mobile Phone Dependency as Mediator”, Journal of Child and Family Studies, Vol.25, No.2, 2016, pp.407-418. [36] F. M. Sessa, S. Avenevoli, L. Steinberg, and A. S.