12
An Adaptive Multimodal Biometric Recognition Algorithm
for Face Image using Speech Signal
M. Nageshkumar
J.S.S. Research Foundation
Dept. of E&C
University of Mysore-06
M.N. ShanmukhaSwamy
J.S.S. Research Foundation
Dept. of E&C
University of Mysore-06
ABSTRACT
A multimodal biometric authentication system based on plastic surgery face image using text dependent speech signal is described in this paper. In addition, the system is designed to keep the rate as high as possible for the plastic surgery face image by using text dependent speech signal. Each module of the system, i.e. the face and speech, is developed separately and fusion is done at matching level to obtain the optimal score for the multimodal biometric recognition system. Although information fusion in a multimodal system can be performed at various levels, integration at the matching score level is the most common approach due to the ease in accessing and combining the scores generated by different matchers. Since the matching scores output by the various modalities are heterogeneous, score normalization is needed to transform these scores into a common domain, prior to combining them.
Keywords
Multimodal biometric system, Plastic surgery face image, Speech signal, Matching Score level Fusion.
1.
INTRODUCTION
The term biometrics or biometry, also called a biometric characteristic or a biometric trait, can be seen as a scientific discipline- a ―life measurement‖. Biometrics can be defined as measurable physiological and behavioral characteristics that can be utilized to verify the identity of an individual person. Multimodal biometric systems consolidate the evidence presented by multiple biometric sources and typically provide better recognition performance compared to systems based on a single biometric modality.
Face recognition is one of the physiological biometric technologies which exploit the unique features on the human face. Although face recognition may seem an easy task for human, but machine recognition is a much more daunting task. Generally, there are two categories of approaches for face recognition, namely global facial feature and local facial feature. Although the global facial-based feature approach is the most researched area, this approach is still plagued with many difficulties and drawbacks due to factors such as face orientation, illumination, and the presence of foreign objects.
This paper presents an improved offline face recognition algorithm based on a multi-local feature selection approach for grayscale images. The approach taken in this work consists of
four stages, namely (i) face detection, (ii) face feature extraction, (iii) face matching and (iv) face identification.
Systematic studies have been tested for face-recognition algorithms in a variety of challenging situations like bad lighting, bad pose and bad expression soon, but none of those conditions had nearly the effect of plastic surgery. A computer science and electrical engineering professor at West Virginia University, in Morgantown. In June, Noore reported the results of the first experimental study to quantify the effect of plastic surgery on face-recognition systems, at the IEEE Computer Society’s Computer Vision and Pattern Recognition conference, in Miami. His team of collaborators is based in West Virginia and at the Indraprastha Institute of Information Technology, Delhi, in India.
The main surgical operations performed in plastic surgery are: face lifting, face rounding, modification of the chin, ear, eyebrow, neck, modification of the internal and external corners of the eye, thickening of the eye-lid, as well as the lower and upper lip, free modification of the length, width, back, ridge of the nose, modification of the double-chin, elimination of wrinkles, as well as coloring of the face and hair. A multimodal biometric face recognition is a well studied problem in which several approaches have been proposed to address the challenges of illumination [1,2], pose [3, 4, 5], expression [2], aging [6, 7] and disguise [8, 9], the growing popularity of plastic surgery introduces new challenges in designing future face recognition systems.
Using a database containing before-and-after images from plastic surgery patients, Noore and his colleagues tested six of the most widely used face-recognition algorithms [2]. Even in pictures where the subject was facing forward and the lighting was ideal, the best of the algorithms matched a person’s pre- and post-surgery images not more than about 30-40 percent of the time. The researchers found that for local alterations—say, a nose job, getting rid of a double chin, or removing the wrinkles around the eyes—today’s systems could make a match roughly one-third of the time. For more global changes like a face-lift, the results were dismal a match rate of just 2 percent. But even after plastic surgery, there are some features beneath the skin will still observable that remains unchanged for a long time.
13 the previous stage. Finally, compares face image against database
(gallery) and reports a match.
To design a high accuracy recognition system, the choice of feature extractor is very crucial. In general, feature extraction methods can be divided into two categories:
(i) Constituent based and (ii) Face based.
The constituent based approaches are based on relationship between extracting structural facial features, such as eyes, mouth, nose, etc. The constituent approaches deal with local information instead of global information. Therefore constituent based method can provides flexibility in dealing facial features, such as eyes and mouth but it will affected by irrelevant information in an image. These are flexible templates constructed with a priori knowledge of the shape and size of the different features [9]. The templates can change their size and shape so that they can’t match properly. These methods work well in detection of the eyes and mouth, despite variations in tilt, scale and rotation of head. However modeling of the nose and eyebrow was always a difficult task [10], [9]. Additionally it cannot deals with complicated background settings. Moreover the computation of template matching is very time consuming.
The second one is the face based approach uses raw pixel information or features extracted from the whole image which as a representation of face. Therefore face based method uses global information instead of local information. Principal Component Analysis (PCA) is a typical and successful face based method. Turk and Pentland developed a face recognition system using PCA in 1991 [11]. Since the global information of an image are used to determine the feature elements, information that are irrelevant to facial region such as shoulders, hair and background may contribute to creation of erroneous feature vectors that can affect the face recognition results.
Comparing to constituent based approach, face based approach provide flexibility in dealing global face features and not affected by irrelevant information in an image; therefore face based approach is selected as a solution in this paper for the multimodal biometric plastic surgery face recognition.
The rest of this paper is organized as follows. Section 2 presents the proposed PCA methods for face feature extraction. Section 3 presents the speech feature extraction method using MFCC / GMM. Section 4 presents the fusion at the matching score Level. Section 5 reports on the experimental results. Finally, Section 6 concludes.
2. FACE FEATURE EXTRACTION
In our case, PCA is applied on the face image to obtain ―eigenface‖ features. These features were then projected onto a face space.
2.1 Eigenface using principle component
analysis
We have applied PCA on the face pattern to obtain eigenface features as described below:
1. A set of face images were acquired.
2. Coordinates that represent the feature points were extracted.
3. The coordinates were converted into a training set. 4. Perform the computation of the eigenvalues.
5. Generate a space of eigenface. Only M eigenface corresponding to M largest eigenvalues were retained. These eigenface spanned the face space which constituted of the training set.
6. Compute the weight of each eigenface to determine its contribution in the face space.
Steps (1) - (6) were applied on each of the face images obtained.
2.2 Procedures for identifying images
To ascertain whether the test image is in the database or not, we obtain the eigenface of the test image following the procedure described above and the procedure described below:
1. Perform all the operations described above for the test image.
2. The test image was projected on each of the eigenface. This was done by finding the set of M weights corresponding to the test image.
3. The distance between the test image and the face space is compared to an arbitrary distance threshold to check whether the test image was sufficiently close to the face space.
4. If it is sufficiently close to the face space, the distance of the M weights of the test image to the M weights of each face in the training set is calculated. This is done to check whether the test image correspond to any known identity. The test image is then assigned with the identity of the image which has the smallest distance.
2.3 Detailed procedure of Eigen face approach
The procedure shown in this section describes how eigenface is obtained. This procedure is based on the eigenface approach developed by Turk and Pentland [11]. First, coordinates obtained from the pattern have to be represented in a matrix for processing. This representation, known as training set, is important to generate eigenvalues. Then we have to calculate the mean in order to reduce the variation in the images. This mean is subtracted from the original images found in the training set to obtain a new set of images. The covariance matrix is deduced to measure the degree of similarity between the data. A weight is then calculated to deduce the contribution of each eigenface, to project it onto the face space.
First of all a set of n images is obtained. This can be represented as the following set A. A= [I1,I2,I3,……….In]Each image has a
set of coordinates which represent the pictures.
14
1 1 1 1 1 1
1 2 3 4
, , ... ,
. .
. .
, , ,
n n n n n n
image image image image
x y x y x y
Facemat
x y x y x y
For using the PCA technique, we have to convert the set of coordinates into a training set, which is represented as follows:
1 1 1
1 1 1
1 2 3 4
...
. .
. .
n n n
n n n
image image image image
x x x
y y y
T
x x x
y y y
To reduce the variation in the element of the training set and to make it standardize, the average
1
1
Mn n
T
M
(1)Is calculated and subtracted from the images of training set as follows:
i
T
i (2) Resulting to the following new training set:1
,
2, ,...
3 M (3)Eigenfaces are the set of principal components of the training set. To obtain the eigenface description of the training set, the training images are subjected to PCA, which seeks a set of vectors which significantly describes the variations of the data. Mathematically, the principal components of the training set are the eigenvectors of the covariance matrix of the training set.
In our case, we must calculate a matrix that will measure the degree of correlation among the vein data and this is
done by using covariance.
1
1
MT n n n
C
M
(4)This can also be formulated as follows:
1
TC
AA
M
(5)The formula used deduces the similarity between the objects. However, too much eigenvectors and eigenvalues were generated A simpler technique was applied to reduce the dimension of the matrix. The formula used is shown below:
T
i i i
A Av
V
(6) The matrix ATA was constructed and respective eigenvalues and eigenvectors were calculated. However, with the eigenvalues obtained many eigenvectors can be generated. The question thatarises is to know how much eigenface is to be used. Turk and Pentland proposed the following formula:
1
1
0.9
M
i i M
j j
(7)
However, in our plastic surgery face recognition case, we have accounted for more than 85% of the variation in the training set. The following formula is used:
1
1
0.85
M
i i M
j j
(8)
This improves error reduction in the matching process. We have already obtained M eigenfaces. For each element in the training set, the weight is calculated. This weight will demonstrate the contribution of each eigenface to respective training element. If the weight is bigger, then the eigenface has shown the real face. If the value is less, there is no big contribution with the real face for that particular eigenvalue. The following operation shows how each element in the training set is projected onto the face space:
T
k
Av
kT
i (9)1
k
M
',1
i
M
Each element in the training set has a weight to determine their contribution they have to the face space.
2.4 Matching
The comparison is done between eigenvalues generated for database and query images using hamming distance approach. In this approach the difference between the bits of two values are counted and the number is divided by the total number of comparisons.
1
1
NFace i i
i
MS
A
B
N
(10)where A is the eigen vector for database image and B is the eigen vector for query image while N is the number of elements. This matching score (MSFace) is used as input for the fusion
module where the final matching score is generated.
3. SPEECH FEATURE EXTRACTION
15
Fig. 1. General Architecture of a speaker recognition system.
Multimodal speech recognition-Humans use multimodal communication when they speak to each other. Studies in speech intelligibility have shown that having both visual (face) and audio (speech) information increases the rate of successful transfer of information, especially when the message is complex or when communication takes place in a noisy environment. The use of the visual face information, particularly lip information, in speech recognition has been investigated, and results show that using both types of information gives better recognition performances than using only the audio or only the visual information, particularly in noisy environment.
Text-dependent methods- Since the performance of text independent methods was limited, time-domain and text dependent methods were also investigated [12, 13, 14, 15]. In time-domain methods, with adequate time alignment, one can make precise and reliable comparisons between two utterances of the same text, in similar phonetic environments. Hence, text-dependent methods have a much higher level of performance than text-independent methods.
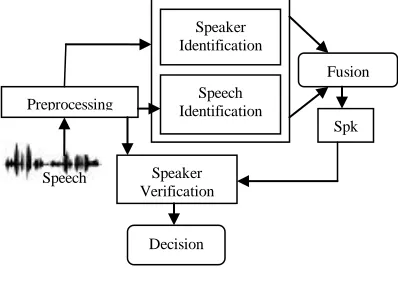
3.1 Proposed system architecture
In this paper we present a new speaker recognition system based on the fusion of two identification classifiers followed by a verification step. This system is divided into two stages, the first one composed by two classifiers (speaker and word classifiers) and the second one made up by a verification system using the decision result of the first stage.
Fig.2.Proposed system architecture
Each speaker is identified by two signals: the first one (combination of three words from a set of 21 possible words) is
used by both speaker and word identification systems, while the second one by the verification system.
3.2 Preprocessing
The role of feature extraction is to represent speech in a way that preserves information that is relevant and important for subsequent recognition. Speech is initially passed through a pre-emphasis filter.
H(z) = 1-α z-1 where α =0.95 (11) The role of the pre-emphasis filter is to remove the spectral tilt, where the first formant has been shifted down while the higher frequency formants have been shifted up, allowing them to be analyzed at the same level.
3.3 Normalization
How to normalize intra-speaker variation of likelihood (similarity) values is one of the most difficult problems in speaker verification. Variations arise from the speaker him/herself, from differences in recording and transmission conditions, and from noise. Speakers cannot repeat an utterance precisely the same way from trial to trial. Hence DTW is used for normalization prior to feature extraction. Due to the wide variations in speech between different instances of the same speaker, it is necessary to apply some type of non-linear time warping prior to the comparison of two speech instances. DTW is the preferred method for doing this, whereby the principles of dynamic programming can be applied to optimally align the speech signals. On the other hand, for detecting similar shapes with different phases, DTW has been used to calculate more robust distance for time series data. It can be used to measure similarity between sequences of different lengths.
3.4 Speech Feature Extraction using MFCC
Mel Frequency Cepstral Coefficients (MFCC) is chosen because of the sensitivity of the low order cepstral coefficients to overall spectral slope and the sensitivity properties of the high-order cepstral coefficient. Currently it is the most popular feature extraction method. MFCC is produced after the recorded signal is pre-emphasized, framed and Hamming windowed. Then the signal is normalized and lowpass filtered. Lowpass filter is used to remove the potential artificial high frequencies appearing in their modulation spectrum due to transmission errors. The Hamming window was calculated after getting the results from the endpoint process. The equation used is as follows:
( )
w(1
w) cos(2
/ (
s1))
w
n
N
W n
(12)where aw is equal 0.54, meanwhile bw, functions to normalized the energy through the operation so that the signal will not change. For the purpose of front end processing to obtain the
Feature Extractio
n
Matching Create Models
Speaker Models Database Training
Recognition
Decision Speech
Signal
Spk
Speaker Verification
Speech Identification
Speaker Identification
Preprocessing
Fusion
Decision Speech
[image:4.612.60.259.527.669.2]16 desired frequency resolution on a Mel scale, the simple Fourier
Transform (FT) is used. The average spectral magnitude for each amplitude coefficient is calculated as:
( ) ( )
0
1
n S f
N
FB n
Savg f
W
N
(13)where the number of samples to get the average value is denoted as N, weighting function is denoted as w FB(n) and magnitude of
[image:5.612.328.551.420.618.2]the frequency computed by the Fourier transform is denoted as |s(f)|. The cepstral coefficient is computed to minimize the non-information bearing variability from that amplitude via the following calculations:
2
0
1
( )
log
( )
0
1
N j kn
N avg
k
C n
S
k e
n
N
N
(14)where the average signal value in the kth is denote as Savg.
3.5 Speaker identification text dependent
system
The speaker identification system is a closed-set text dependent system. This system calculates the log likelihood ratio, by using following eq., between the first signal (made up by three words W1; W2; W3) and all speakers’ models. No decision is taken at
this level, but the log likelihood ratios are sorted. The matching function in GMM is defined in terms of the log likelihood of the GMM in respect to the speech segment X given by:
1
(
| )
log (
| )
Q
q q
p X
p x
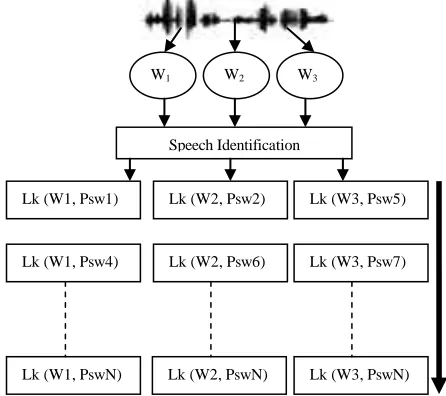
(15)3.6 Word identification speaker dependent
system
The same signal, made up by three words, is also used to feed a word identification speaker dependent system. This system is constructed as the fusion of three classifiers, one for each word of the first signal. The outputs of each classifier are used in order to propose one or several recognized combinations of words. Only the first three outputs of each module are combined by taking into account the log likelihoods and the validity of the password. Each combination of outputs will have associated the sum of their log likelihood. This approach, which uses manual words segmentation, was compared with a Viterbi algorithm that performs an automatic extraction of the three words from the entire first signal.
For initialization
1
( )
j
log
jlog
b
j(0 )
1for
t
1,
1
j
N
For recursion
1, 1
( )
max
( )
log
(0 )
2
,
1
t
j
i j j ti
a
ijb
j tfor
t
T
j
N
For termination,
p o
( |
v)
max
1i N t( )
i
for t
T
N = Number of states
T = Number of frames for feature vectors o = [o1, o2,…,oT ]
aij = State transition between i and j A = {aij} are their N-by-N matrix
B = {logbj (ot)} is a N-by-T matrix in log output probability
( )
t
j
= Likelihood value at the time index t and state j
3.7 Data Fusion
After sorting the log likelihood ratios LLK(W1;W2;W3|Spi)
calculated with regard to the models of each speaker Spi , with i =
1……N and N the number of speakers stored in the database, and the log likelihood ratios LLK(W1;W2;W3|Pswi) calculated with
regard to the models of each password |Pswi , a first test consists
to compare the most likely speaker given by the speaker classifier with the first three identified passwords (made up by three words) given by the word identification system. If his password was found between the three identified passwords, a couple (speaker/password) was thus identified. A second test consists to compare the most likely password with the first three identified speakers. If this password belongs to one of them, another couple (password/speaker) is identified. In the cases where two couples are identified, the couple with the biggest likelihood ratio (Lk_Sp + Lk_Psw) is retained. The system can reject directly a recording if there are no identified couples.
Fig.3. Speech identification system
3.8 Speaker verification system
The verification system uses a second signal pronounced by the speaker previously identified. If the likelihood ratio of this
W1 W2 W3
Speech Identification
Lk (W3, PswN) Lk (W2, PswN)
Lk (W1, PswN)
Lk (W3, Psw7) Lk (W2, Psw6)
Lk (W1, Psw4)
Lk (W3, Psw5) Lk (W2, Psw2)
17
1
2
FINAL Face Speech
MS
MS
MS
verification is smaller than a predefined threshold, the identity of the speaker is confirmed, otherwise the speaker is rejected.
3.9 Score Normalization
The matching scores at the output of the individual matchers may not be homogeneous. For example, one matcher may output a dissimilarity measure while another may output a similarity measure. Further, the scores of the individual matchers need not be on the same numerical scale and may follow different statistical distributions. Due to these reasons, score normalization is essential to transform the scores of the individual matchers into a common domain prior to combining them. Score normalization is a critical part in the design of a combination scheme for matching score level fusion.
Score normalization refers to changing the location and scale parameters of the matching score distributions at the output of the individual matchers, so that the scores of different matchers are transformed into a common domain. In a good normalization scheme, the estimates of the location and scale parameters must be robust and efficient.
This step brings both matching scores between 0 and 1. The normalization of both the scores are done by
min
max
min
Face Face Face
Face Face
MS
N
(16)min
max
min
Speech Speech Speech
Speech Speech
MS
N
(17)where minFace and maxFace are the minimum and maximum scores
for face recognition and minSpeech and maxSpeech are the
corresponding values obtained from speech trait.
4. FUSION
Fusion is the umbrella term for a wide range of methods for the combination of multiple pieces of biometric data. These may be raw samples such as images, processed data such as templates, matcher similarity scores or distances, verification decisions, and identification candidate lists or ranks. Fusion generically covers the combination of data from multiple samples, multiple (imaging or biometric) modes, or multiple algorithms. Fusion is usually conducted to improve matching performance.
Score level fusion - is the most readily implemented form of fusion. It combines the similarity score outputs of the two or more matching algorithms. The algorithms may be operating on the same input sample (for example two fingerprint minutiae algorithms) or on samples from completely separate modes (face, and hand geometry, for example). It is generally the case that a fusion module is driven by prior knowledge of the statistical properties of its inputs.
The different biometric system can be integrated to improve the performance of the verification system. The following steps are performed for fusion:
1. Given the query image as input, features are extracted by an individual recognition.
2. The weights and are calculated.
3. Finally the sum of score technique is applied for combining the matching score of two traits i.e. face and palmprint. Thus the final score MNFINAL is given by
(18)
Where and are the weights assigned to both the traits. The final matching score (MSFINAL) is compared
against a certain threshold value to recognize the person as genuine or an impostor.
5. EXPERIMENTAL RESULTS
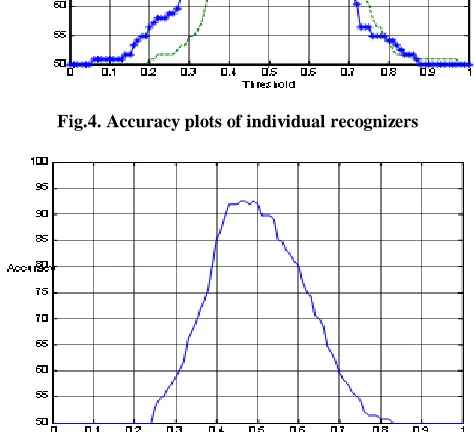
The results are tested on face and speech dataset of our own database. The database consists of three face images (120×3) and two speech signals (120×2) per person with total of 120 persons. The face images are acquired using CCD camera with uniform light source. However, speech signal are acquired using a microphone. For the purpose allowing comparisons two levels of experiments are performed. At first level face and speech algorithms are tested individually. At this level the individual results are computed and an accuracy curve is plotted as shown in Figure 4. At this level the individual accuracy for face and speech is found to be 85.36% and 91.06% respectively as shown in Table 1.
However in order to increase the accuracy of the biometric system as a whole the individual results are combined at matching score level. At second level of experiment the matching scores from the individual traits are combined and final accuracy graph is plotted as shown in Figure 5. Table 1 shows the accuracy and error rates obtained from the individual and combined system. The overall performance of the system has increased showing an accuracy of 92.48% with FAR of 1.58% and FRR of 6.34% respectively.
Table 1. Showing individual and combined accuracy
Trait Algorithm Accuracy (%)
FAR (%)
FRR (%)
Face PCA 85.36 15.64 4.85
Speech MFCC 91.06 8.94 12.69
18
[image:7.612.55.292.182.398.2]Fig.4. Accuracy plots of individual recognizers
Fig.5. Accuracy graph for combined classifier
6. CONCLUSION
The paper proposes a biometric personal authentication system using a novel combination of face and Speech signal. For system deployment the combination is found to be useful as one needs a close up system and other needs contact. One modality is used to overcome the limitations posed by the other. The experimental results show that the accuracy of system would increase on combining the traits. The system is giving an overall accuracy of 92.48% with FAR and FRR of 1.58% and 6.34%.
7. REFERENCE
[1] S. Li, R. Chu, S. Liao, and L. Zhang, ―Illumination invariant face recognition using near-infrared images‖, IEEE Transactions on Pattern Analysis and Machine Intelligence, vol. 29, no. 4, pp. 627–639, 2007.
[2] R. Singh, M. Vatsa, and A. Noore, ―Improving verification accuracy by synthesis of locally enhanced biometric images and deformable model‖, Signal Processing, vol. 87, no. 11, pp. 2746– 2764, 2007.
[3] V. Blanz, S. Romdhami, and T. Vetter, ―Face identification across different poses and illuminations with a 3d morphable model‖, in Proceedings of International Conference on Automatic Face and Gesture Recognition, 2002, pp. 202–207.
[4 X. Liu and T. Chen, ―Pose-robust face recognition using geometry assisted probabilistic modeling‖, in Proceedings of International Conference on Computer Vision and Pattern Recognition, 2005, vol. 1, pp.502– 509.
[5] R. Singh, M. Vatsa, A. Ross, and A. Noore, ―A mosaicing scheme for pose-invariant face recognition‖, IEEE Transactions on Systems, Man and Cybernetics - Part B, vol. 37, no. 5, pp. 1212–1225, 2007.
[6] A. Lanitis, C.J. Taylor, and T.F. Cootes, ―Toward automatic simulation of aging effects on face images‖, IEEE Transactions on Pattern Analysis and Machine Intelligence, vol. 24, no. 4, pp. 442–450, 2002.
[7] N. Ramanathan and R. Chellappa, ―Face verification across age progression‖, IEEE Transactions on Image Processing, vol. 15, no. 11, pp. 3349–3362, 2006.
[8] N. Ramanathan, A.R. Chowdhury, and R. Chellappa, ―Facial similarity across age, disguise, illumination and pose‖, in Proceedings of International Conference on Image Processing, 2004, vol. 3, pp. 1999–2002.
[9] Huang, L. C.; and Chen, C. W. ―Human Face Feature Extraction for Face Interpretation and Recognition‖. In Proceedings of the IEEE International Conference on Pattern Recognition, 204-207. Hague Netherlands, 1996.
[10] Yullie, A. L.; Cohen, D. S.; and Hallinan, P. W. “Feature Extraction from Faces using Deformable Templates‖. In Proceeding of the IEEE International Conference on Pattern Recognition, 104-109. San Diego, USA, 1989
[11] Turk, M.; and Pentland, A. ―Face Recognition using Eigenfaces‖. In Proceedings of the IEEE Computer Society Conference on Computer Vision and Pattern Recognition, 586-591. Maui, USA, 1991.
[12] B. S. Atal, ―Text-independent speaker recognition,‖ J.A.S.A., 52, 181 (A), 83th ASA, 1972.
[13] B. S. Atal, ―Effectiveness of linear prediction characteristics of the speech wave for automatic speaker
identification and verification,‖ J.A.S.A., 55, 6, pp. 1304-1312, 1974.
[14] S. Furui, ―Cepstral analysis technique for automatic speaker verification,‖ IEEE Trans. Acoustics, Speech,
Signal Processing, ASSP-29, pp. 254-272, 1981.