SCHOOL OF ENGINEERING
MSc THESIS
Academic Year 2003-2004
AZMAHANI SADIKIN
MODELLING OF THE FLOW OF
REFRIGERANT 134a IN CAPILLARY TUBES
Supervisor: Dr. Ossama Badr September 2004
This thesis is submitted in partial fulfilment of the requirements for the degree of Master of Science
ABSTRACT
Practical tools for the design of capillary tubes for refrigeration systems employing the traditional CFC-12 and HCFC-22 as refrigerants are widely available. Due to environmental concern of the depletion of ozone layer and global warming, CFCs and HCFCs have to be phased out eventually according to the Montreal Protocol. As a result, a number of alternative refrigerants including HFC-134a have emerged as promising chlorine free alternatives to CFC-12 in domestic refrigerators and freezers. The proper size of a capillary tube with a new refrigerant is a critical factor for the optimum performance of a refrigeration system.
This study presents a computer model KAPILARI, which has been developed to predict the length of capillary tube used as an expansion device in small refrigerating and air-conditioning systems. The pressure drop through a capillary tube in the single-phase and two-phase regions is modelled in an attempt to predict the size of capillary tube. The model is based on the governing equations of conservation of mass, energy and momentum. Stoecker's basic model was modified with the consideration of various effects due to sub cooling, choked flow and friction factor used in single-phase region.
ACKNOWLEDGEMENT
I am pleased to acknowledge the assistance of Dr. Ossama Badr, my supervisor in completing this thesis for the valuable suggestions and comments.
NOMENCLATURE A D e
Is
f
h Ls L p Ps Q ReD T Te Tsuperheat Tcond Tsub Us U Usonic Usonicr Usonicg v x mcross-sectional area of the capillary tube Cm2)
bore of capillary tube (m)
ideal gas constant-volume specific heat (J/kgK) surface roughness of the tube (m)
single-phase flow friction factor (dimensionless) two-phase flow friction factor (dimensionless) specific enthalpy ofthe refrigerant (J/kg) length of capillary tube in single phase (m) total length of capillary tube (m)
pressure ofthe refrigerant in two-phase flow region CPa) saturation pressure (Pa)
cooling capacity (W) Reynolds number temperature (K)
evaporating temperature (OC) degree of superheat (OC) condensing temperature (OC) degree of sub cooling (OC)
flow velocity of subcooled liquid refrigerant (mJs) flow velocity of the refrigerant (mJs)
velocity of sound in a mixture of liquid and vapour refrigerant (mJs) velocity of sound in liquid refrigerant (mJs)
velocity of sound in vapour refrigerant (mJs) specific volume of the refrigerant (m3/kg)
fraction of vapour in mixture ofliquid and vapour (i.e. quality or dryness fraction)
dynamic viscosity of refrigerant (Pa.s) density of refrigerant (kg/m3)
incremental length (m)
pressure drop in subcooled liquid-phase flow region (Pa)
Subscripts
c
cond e
J
g
111
r
sub superheat
s
Abbreviations
ASHRAE
CFC HCFC HFC ODP
critical condenser evaporator saturated liquid saturated vapour mean
reduced sub cooling superheat
subcooled liquid refrigerant
American Society of Heating, Refrigeration and Air-Conditioning Engineers
chlorofluorocarbon hydrochlorofluorocarbon hydro fl uro carbon
LIST OF FIGURES
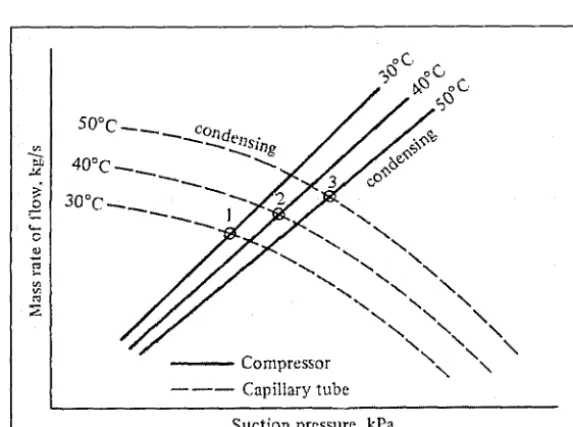
Fig. 1.1 Balance points between a reciprocating compressor and a capillary tube (Stoecker and Jones, 1982)
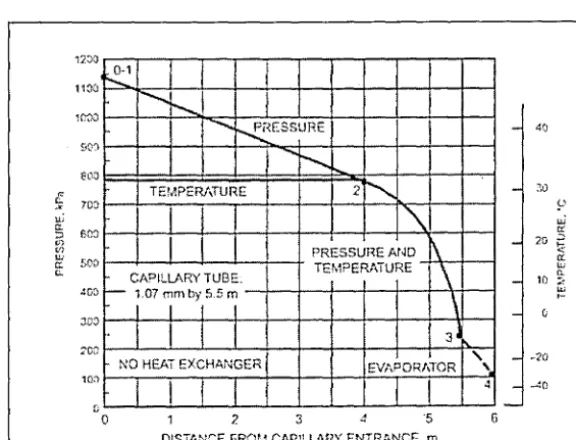
Fig. 2.1 Pressure and temperature distribution along typical capillary tube (ASHRAE, 2002)
Fig. 2.2 Flow through a capillary tube (Stoecker and Jones, 1982)
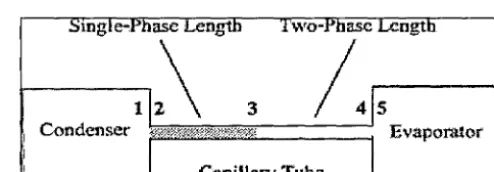
Fig. 2.3 Schematic diagram of an adiabatic capillary tube
Fig. 2.4 Incremental length of a capillary tube
Fig. 4.1 Schematic diagram of the thermodynamic cycle
Fig. 4.2 Simple flowchart ofKAPILARI program
Fig.4.3(a) KAPILARI Program flowchart
Fig. 4.3(b) KAPILARI Program flowchart
Fig.4.4(a) ThermoCycle flowchart
Fig.4.4(b) ThermoCycle flowchart
Fig. 4.5 Ls flowchart
Fig.4.6(a) TwoPhaseLength flowchart
Fig. 4.6(b) TwoPhaseLength flowchart
Fig. 4.6( c) TwoPhaseLength flowchart
Fig. 4.6( d) TwoPhaseLength flowchart
Fig. 4.6( e) TwoPhaseLength flowchart
Fig. 4.7 Add flowchart
Fig.4.8(a) Subroutine Vapour_Volume flowchart
Fig. 4.8(b) Subroutine Vapour_Volume flowchart
Fig. 4.9
Fig. 5.1
Fig. 5.2
Fig. 5.3
Fig. 5.4
Fig. 5.5
Fig. 6.1
Fig. 6.2
Fig. 6.3
Fig. 6.4
Fig. 6.5
Fig. A.1
Fig. A.2
Fig. A.3
Fig. A.4
Fig. A.5
Subroutine Vapour_Enthalpy flowchart
Comparison of mass flow rate in capillary tube using present model and CAPILAR model
Pressure distribution along capillary tube in present model.
Comparison of the present model with W ongwise et al. model
Comparison of present model with Kim et al. model
Comparison of present model with Sami et al. model
Variation of the length of the capillary tube as a function of the cooling capacity and bore
Variation of the length of the capillary tube as a function of the evaporating temperature and bore
Variation of the length of the capillary tube as a function of the condensing temperature and bore
Variation of the length of the capillary tube as a function ofthe degree of subcooling and bore
Variation of the length of the capillary tube as a function of the degree of superheat and bore
Relative deviations of the saturation pressure compared to the ICI data
Relative deviations of the specific volume compared to the ICI data
Relative deviations of the specific enthalpy compared to the ICI data
Relative deviations of the viscosity compared to the ICI data
LIST OF TABLES
Table 3.1
Table 3.2
Table 5.1
Table 5.2
Table 5.3
Table 5.4
Table 5.5
Table 6.1
Thennodynamic coefficients and constants for HFC-134a
Predicted thennodynamic properties ofHFC-134a
Comparison of present model and CAPILAR model
Capillary tube length calculated by present model and CAPILAR model using mass flow rate or cooling capacity as the input parameter
Geometry of capillary tubes (Melo et al. 1999)
Test on capillaries 1-6
Comparison of capillary tube length of present model with Kim et al. model, Sami et al. model and Wongwise et al. model
Test data for testing the capability ofthe program
Table A.1(a) Velocity of sound in liquid HFC-134a refrigerant (Ineos FLUOR, 2004)
Table A.1(b) Velocity of sound in liquid HFC-134a refrigerant (Ineos FLUOR, 2004)
TABLE OF CONTENTS
1. INTRODUCTION
1.1 1.2 1.3 1.4
Capillary tube
Sizing of Capillary Tubes CFC Substitutes
Aim of thesis
2. FLOW ANALYSIS AND DESIGN OF ADIABATIC CAPILLARY
1
1 3 4
5
TUBES 6
2.1 Flow Analysis in Adiabatic Capillary Tubes 6
2.1.1 Single-phase flow and two-phase flow 6
2.1.2 Choked flow 7
2.1.3 Metastable flow 8
2.1.4 Homogenous flow 9
2.1.5 Separated flow 9
2.2 Design methods of Adiabatic Capillary Tubes 10
2.2.1 Calculating pressure drop 11
2.2.1.1 Single-phase flow region 11
2.2.1.2 Two-phase flow region 13
2.3 Proposed Mathematical Modelling 16
2.3.1 Solution method for two-phase region 18
3. CALCULATION OF THERMODYNAMIC PROPERTIES
OF HFC-134a 21
3.1 Thermodynamic properties of HFC-134a
3.1.1 The equation of state 3.1.2 The Saturation Pressure, Ps
3.1.3 Ideal gas constant-volume specific heat, Cv
3.1.4 Saturated vapour specific enthalpy, hg 3.1.5 Saturated liquid enthalpy
3.1.6 Liquid density
23
3.2
3.1.7 Saturated vapour viscosity 3.1.8 Liquid viscosity
3.1.9 Velocity of sound in vapour refrigerant 3.1.10 Velocity of sound in liquid refrigerant
The accuracy of the predicted thermodynamics properties
4. THE COMPUTER MODEL
4.1 4.2 4.3 4.4 4.5 Main program
Module and Subprograms used in KAPILARI model Evaluation of thermodynamic properties
Flow charts for KAPILARI KAPILARI program 28 30 30 30 32 33 33
5. VALIDATION STUDY 51
6. CAPILLARY TUBES LENGTH PREDICTION BY KAPILARI
MODEL 63
6.1 6.2 6.3 6.4 6.5 6.6 6.7
Effect of cooling capacity
Effect of evaporating temperature Effect of condensing temperature Effect of degree of subcooling Effect of degree of superheat Effect of capillary tube bore Conclusion remark
7. CONCLUSION
8. RECOMMENDATIONS FOR FURTHER \VORK REFERENCES
APPENDIX A
Al A2
Velocity of sound in liquid HFC-134a
Relative deviations of thermodynamic and transport properties
APPENDIXB 83
Bl Main Program 84
B2 Module Global 86
B3 Subroutine Coefficient 87
B4 Subroutine ThermoCycle 88
B5 Subroutine Ls 90
B6 Subroutine TwoPhaseLength 91
B7 Subroutine Add 95
B8 Subroutine Vapour_Volume 97
B9 Subroutine Vapour_Enthalpy 98
1. INTRODUCTION
A modem refrigerator is based on a closed system, where the working fluid (i.e. the refrigerant) flows through the basic components, the evaporator, compressor, condenser and expansion valve. The expansion valve is simply a restriction device which maintains the high pressure and low pressure side in the system via a throttling process. There are two main functions of an expansion valve (Stoecker and Jones,
1982; ASHRAE, 1998; and Trott and Welch, 2000):
•
•
Reduces the pressure of liquid refrigerant leaving the condenser and flashing some amount of it into vapour so it cools down to the evaporating
temperature.
Regulates the flow of the refrigerant to the evaporator according to its demand so that the evaporator will not be overfed nor starved when condenser and evaporator temperatures vary during operation.
Capillary tubes, thermostatic expansion valves, constant-pressure expansion valves and electric expansion valves are the commonly used expansion devices in refrigeration systems (Stoecker and Jones, 1982; ASHRAE, 1998; and Trott and Welch, 2000). Capillary tubes are commonly used in small units.
The behaviours of the components of a refrigerator are interdependent. Therefore, the performance of entire system depends on the characteristics of the individual components as well as the refrigerant charge. Hence, by introducing a new refrigerant, the components of a refrigerant system have to be re-optimize. This is whole true for capillary tube since an improperly sized capillary tube can significantly reduce the performance of a refrigeration system (Bansal and Rupasinghe, 1996; and Choi and Kim, 2002).
1.1 Capillary tube
Capillary tube, one of the four major components in a refrigeration system was first used in the early 1930's in refrigerators. Capillary tube is made of extremely small-bore copper tube of 0.5 to 2.5 mm diameter from 2 to 5 m length, connecting the outlet of condenser to the inlet of evaporator (Stoecker and Jones, 1982; and Trott and Welch, 2000). Capillary tubes are of two types (Bansal and Rupasinghe, 1998): adiabatic, where refrigerant expands from high pressure to low pressure adiabatically; and non-adiabatic capillary tube, where the refrigerant expands to low pressure but capillary tube is set up to form a heat exchanger relationship with the suction line of the compressor.
The capillary tube has no moving parts, nothing to wear out, no maintenance required, simple and inexpensive. It also allows the pressure between the condenser and the evaporator to equalize during off cycle, thus reducing the compressor starting
torque requirements. On the other hand, the capillary tube is not adjustable so it desirable to hold the refrigerant charge near optimal limits. Therefore, it is only applicable in small refrigeration system such as domestic refrigerators and freezers where the refrigeration load and the refrigerant charge remain fairly constant. Small refrigeration systems of interest have refrigeration capacities below 10 kW (Stoecker and Jones, 1982; and Wong and Ooi, 1995) and its application of capillary tube can be extended to systems with refrigeration capacities up to 35 kW (ASHRAE, 2002).
Capillary tube has numerous combinations of bore and length available to obtain the desired restriction. The size of the capillary tube is selected so that it delivers the proper flow rate of the refrigerant at a specified load and temperatures. Despite the fact that the tube is not adjustable to variations in discharge pressure, suction pressure or load, it controls the flow reasonably under varied conditions. The compressor and expansion device must arrive at suction and discharge conditions which allow the compressor to pump from the evaporator the same flow rate of refrigerant that the expansion device feeds to the evaporator. An unbalance flow condition between capillary tube and compressor must necessarily be temporary.
At a given condensing pressure (i.e. compressor-discharge pressure), there is one value of the evaporating pressure (i.e. compressor-suction pressure) at which the tube will pass the correct amount of refrigerant to the evaporator as shown in Fig. (1.1). At any of these balance points, the condenser is completely drained of liquid.
- -Compres.<;or - - - Capillary tube
Suction pressure. kPa
Fig. 1.1 Balance points between a reciprocating compressor and a capillary tube (Stoecker and Jones, 1982)
For a given condensation pressure, if the refrigerating load drops accompanied by a decrease in the evaporating temperature and compressor-suction pressure, the capillary tube delivers more refrigerant to the evaporator than the compressor can
[image:15.608.135.422.415.628.2]handle. This state of unbalance is resolved by the flow of some vapour from the condenser through the tube so it reduce the mass flow rate through the capillary tube and achieve the desired flow-rate control. However, work is wasteful because it is uses to compress the vapour, which does not produce any useful refrigerating effect in the evaporator, but such a waste can be tolerated in small systems. On the other hand, if the load increases, the evaporator temperature increases and accompanied by an increase of compressor-suction pressure. Then, the compressor pumps a greater mass flow rate of the refrigerant from the evaporator. This starves the evaporator and fills the condenser with liquid. As a result, the condenser surface is covered by liquid, hence reduces the heat transfer surface area for condensing the refrigerant vapour. Thus, the condensing pressure rises and subsequently increases the flow rate through the capillary tube. Simultaneously, the reduction in evaporator charge reduces the surface area of the evaporator wetted by the refrigerant's liquid, bringing the evaporating pressure and the compressor mass flow rate down again. A balance condition is restored, but again with wasteful results, because the condensing and the evaporating pressures are respectively higher and lower than they need be (Stoecker and Jones, 1982).
The main disadvantages of using this simple device is that they are not adjustable to changing load conditions, are prone to clogging by foreign matter and the mass of refrigerant charge has to be held within a close limits. As the capillary tube is designed for one set of operating conditions, any changes from design conditions result in an inefficiency of operating system. However, these limitations of capillary tubes are tolerated for small refrigeration units because the changes in loads are constant and small.
1.2 Sizing of Capillary Tubes
Historically, tubes are sized with number of ways such as empirically by interpolation and extrapolation by previous designers (Stoecker and Jones, 1982; Melo et aI., 1992; Wong and Ooi, 1995; and Bansal and Rupasinghe, 1996) or through graphical charts produces by commercial companies and various agencies such as ASHRAE for common refrigerants (ASHRAE, 1994). However, these charts tend to under predict the refrigerant mass flow rate and are only available for refrigerants CFC-12 and HCFC-22.
Other than using analytical technique, the selection of proper diameter and length of a capillary tube for a given application is largely a trial and error process. The designer of a new refrigeration unit employing a capillary tube must select an exact bore and length of capillary tube so that the compressor and capillary tube can fix a balance point at desired evaporating temperature. The final adjustment of the length is most often 'cut and try'. Usually, a longer tube than desired is installed in the system with the probable result that the balance point will occur at too Iowan evaporating temperature. Then, the tube is shortened until the desired balance is reached. In an
attempt to overcome this problem, there is a number of computer models have been developed and validated against specific sets of experimental data in literatures.
The available computer software for sizing capillary tube is based on different mathematical models. Normally, the computer models are developed to investigate the performance, behaviour and mass flow rate of refrigerants in capillary tube. So, the mass flow rate is calculated through a specific capillary tube, with a given diameter and length. As a result, the solving process has to be iterative though. The reason for such an iterative process is the dependence of the mass flow rate upon the friction factors and the dynamic pressure at the capillary tube inlet, which are dependent on the mass flow rate. Therefore, the present model interest, which yields the minimum CPU time, consists in firstly determine the mass flow rate and then calculating the length of capillary tube for any given diameter and design conditions.
1.3 CFC Substitutes
Over 30 years ago, Rowland and Molina (1974), proposed that the emission of chlorinated man-made chemicals to the atmosphere could damage the stratospheric ozone layer. Subsequently, an extensive worldwide programme of stratospheric ozone monitoring has confirmed that there is severe depletion of ozone over the Antarctic during springtime.
After Montreal Protocol and its amendments, the use of materials with high ozone depletion potential (ODPs) are aim to be reduced. Firstly, the halons were banned, then the chlorofluorocarbons (CFCs) and now is the push to ban the hydrochlorofluorocarbons (HCFCs) on a time scale which becomes shorter with each new amendment in the protocol.
CFC-12 was commonly used in the household refrigerators and freezers where HFC-134a is now accepted to some extent as its substitute to the point of thermodynamic view, but its high global warming potential is still of concern. Due to the differences in thermodynamic and transport properties of HFC-134a from those of CFC-12, a refrigeration unit employing HFC-134a needs to be redesigned to optimize its performance. Moreover, since the demand for saving the environment is encouraging and also improving the performance of any equipment, re-evaluation of the individual components especially the capillary tube that use HFC-134a as a refrigerant is one of the essential factor for the optimum performance of refrigerating and air-conditioning systems. Therefore, there is an emerging need to develop a software that capable of sizing capillary tube for HFC-13a as an alternative to CFC-12 at selected bore for any given design conditions.
1.4 Aim of thesis
A review of flow analysis in capillary tube and design methods employed for selecting the length and bore of a capillary tube for a refrigeration system is undertaken and the best mathematical model is selected for sizing a length of capillary tube.
A calculation of thermodynamic properties of HFC-134a is reviewed to enable of sizing a capillary tube. Equations and correlations for calculating thermodynamic properties are employed in a computer subprogram contains subroutines and functions that assist the main program to calculate the capillary tube length. A computer code using Fortran 90 is chosen because Fortran 90 is an excellent language for solving the problems encountered in scientific, numerical and engineering applications accurately.
Then, Fortran 90 codes are facilitated for sizing capillary tube with a selected bore and with a given refrigeration capacity, evaporating temperature, degree of superheat, condensing temperature and degree of sub cooling based on mathematical model selected.
The computer model is validated with experimental results obtained from available literatures.
Subsequently, capability of the program is tested and simulation of design conditions are carried out to see the effect of varying designs parameters to the length of capillary tube, namely cooling capacity, evaporating temperature, degree of superheat, condensing temperature, degree of sub cooling and inner diameter of capillary tube.
Finally, conclusion is drawn from the results obtained from model developed and recommendations for further work are suggested in order to expand the research undertaken in this proj ect.
2. FLOW ANALYSIS AND DESIGN OF ADIABATIC CAPILLARY TUBES
The design and flow analysis of adiabatic capillary tubes have been studied extensively; both numerically and experimentally, by many researches (Bolstad and Jordan, 1948; Whitesel, 1957a & 1957b; Mikol, 1963; Stoecker and Jones, 1982; Li et aI., 1990; Melo et aI., 1992; Wijaya, 1992; Escanes et aI., 1995; Wong and Ooi, 1996; Bansal and Rupasinghe, 1996; Bansal and Rupasinghe, 1998; Jung et aI., 1999; Melo et aI., 1999; Sami et aI., 2000; Chen and Lin, 2001; Wongwises and Pirompak, 2001; Kim et aI., 2002; and Wongwise and Trisaksri, 2003; and Bansal and Wang, 2004).
2.1 Flow Analysis in Adiabatic Capillary Tubes
2.1.1 Single-phase flow and two-phase flow
A common flow condition is to have subcooled liquid at the inlet of capillary tube. Bolstad and Jordan (1948) observed that pressure and temperature distribution along the capillary tube is similar to that shown in Fig. (2.1).
0-1 I
t"-... I
~I
I
... ~<ESSUREI
I
TEMPERI\TURE 70::
CAPILLARY TUBE,
r- 1.07 r.1mby 5.5 m
(, o
J I I I
~o HEAT EXCHANGER
I
[image:19.608.146.434.402.622.2]2
I
...
2 ...
,\1
.
f\PRESSLJHE AND TEMPERATURE
\
I
\
3~
J
EVN'OR/,TOR
I
3 5
DISTANCE FROM CAPiLLAHY ENTRANCE. m
20
10
"
,
~
6
Fig. 2.1 Pressure and temperature distribution along typical capillary tube (ASHRAE, 2002)
At the entrance to the capillary tube, point 0-1, a slight pressure drop occurs and usually unreadable on the gauges. From point 1 to 2, the pressure drops linearly whilst the temperature remain constant. At these two points, the refrigerant is
entirely in liquid phase. At point 2, the refrigerant starts to evaporate and first bubble of vapour fonus. The pressure is the saturation pressure corresponding to the refrigerant temperature.
The two phase flow exists between points 2 to the end of the tube (point 3). The pressure drops rapidly and in nonlinear trend. The pressure drop per unit length increases as the end of capillary tube is approached as a result of two-phase friction and vapour acceleration. Meanwhile, the temperature continues to drop and the temperature is being saturated temperature corresponding to the pressure. In this portion of tube, both saturated vapour and saturated liquid exists with the dryness fraction and volume of vapour increasing in the direction of flow. This results in the fluid flow velocity to increase due to the larger specific volume of the fluid. A significant pressure drop occurred from the end ofthe tube into the evaporator space, point 3 to 4.
2.1.2 Choked flow
Choked flow corresponds of existence of sonic velocity at the capillary tube outlet. This is due to increases of fluid velocity because oflarge specific volume of the fluid until the fluid velocity reaches sonic velocity and Mach number becomes unity.
The inference of choked flow in a capillary tube of a refrigeration system is that at a critical evaporator pressure or suction pressure, the pressure-flow rate curve of a capillary tube may reached a plateau (see Fig. 2.2), where the mass flow rate does not increase even though the suction pressure drops further (i.e. the tube is choked).
/ ' Choked flow
---Sudion pressure
Fig.2.2 Flow through a capillary tube (Stoecker and Jones, 1982)
For system performance, this means that to achieve a flow balance between the compressor and the capillary tube, the suction pressure must drop until the flow rate through the compressor matches the flow rate through the capillary tube. As a result, there is penalty in operating efficiency. Therefore, many appliances manufactures bond the capillary tube to the compressor suction line, to retard the flashing of the liquid flowing through the tube, hence, lowering the specific volume of the flowing refrigerant and retarding choking (Stoecker and Jones, 1982).
Many research studies have been conducted for analyzing choked flow in capillary tubes. Bolstad and Jordan (1948) observed that the existence of choked outlet condition at point 3 to 4 (see Fig. 2.1) and showed that after choking occurred, further lowering of the evaporator pressure, do not increase the mass flow rate through the tube. This situation is called critical condition, corresponds to the point where the refrigerant entropy reaches its maximum value. When choked condition is established, the flow through the capillary tube can not be further accelerated. As a result, when the flow is choked, the two-phase velocity becomes the sound velocity. Therefore, the velocity at the exit of capillary tube should be less than the velocity of sound of refrigerant to avoid choked flow or choked tube.
Melo et aI. (1992) presented a mathematical model for sizing capillary tubes and a computer model, CAPILAR, that are capable for assessing a choked flow and metastable flow. Bansal and Wang (2004) had developed a diagram that presents a better way to understand the choked flow phenomenon graphically and can be useful for design and analysis of refrigerant flow in capillary tubes.
2.1.3 Metastable flow
A metastable phenomenon (a thermodynamic non equilibrium condition) may exist within the flashing process, where the state of the refrigerant changes from liquid to vapour-liquid mixture. This means that the inception of vaporization does not take place at the location of thermodynamic saturated state at a saturation pressure at point 2 (see Fig. 2.1) but takes place at a location at a pressure downstream from the thermodynamic saturated point whilst the refrigerant remains in liquid phase for limited length past point 2 based on detailed measurements of Mikol (1963). This delayed evaporation must be accounted for in analytical modeling of the capillary tube, or mass flow rate of refrigerant will be underestimated according to ASHRAE (2002). Investigations of the metastable flow in adiabatic capillary tubes have been conducted by many researchers (Li et aI., 1990; Chen and Lin, 2001; and Wongwise, 2003).
2.1.4 Homogenous flow
Homogenous flow describes a two phase flow as a single-phase flow, with pseudo properties arrived at by suitably weighting the properties of the individual phase. The basic assumption for this model is that the velocity of vapour and liquid are same in thermodynamic equilibrium.
Many researches used homogenous flow for their mathematical modelling (Melo et al., 1992; Escanes et al., 1995; Wong and Ooi, 1995; Jung et al., 1999; Sami and Maltais, 2000; Sami, Desjardins and Maltais, 2001; Wongwises and Trisaksri, 2003). In modeling the pressure drop of the homogenous flow involving vapour-liquid mixture in capillary tube, the friction factor for the flow must be known (Wong and Ooi, 1995).
Assumptions made by using homogenous flow are metastable flow effect is neglected, the refrigerant flow is one-dimensional flow, adiabatic and thermodynamic equilibrium for two phase flow region (Stoecker and Jones, 1982; Melo et al., 1992; Wong and Ooi, 1995; Escanes et al., 1995; Bansal and Rupasinghe, 1998; and Bansal and Wang, 2004).
Bansal and Rupasinghe (1998) presented a homogenous two-phase flow model, CAPIL, to investigate performance and designs criteria for adiabatic capillary tube. The thermodynamics and transport properties of the refrigerant are determined by REFPROP database which is based on Carnahan-Starling-Desantis Equation State.
2.1.5 Separated flow
Separated flow model considers the phases segregated into two streams; one is liquid and one is vapour and traveling at different mean velocities but constant. Wong and Ooi (1996) had presented an analysis for separated flow model and the results showed that this model can adequately predict the flow of refrigerants in a capillary tube. The pressure distribution in capillary tube by using separated flow model gives better prediction compared to homogenous flow model especially at the region near the choked condition where homogenous flow model give larger discrepancies (Wong and Ooi, 1996).
2.2 Design methods of Adiabatic Capillary Tubes
There are many design methods available in literature in sIzmg capillary tubes. Escanes et al. (1995) proposed a numerical solution in transient and steady state by employing an implicit numerical method for the fluid flow and empirical correlations for the local friction and convective heat transfer obtained from literature.
Bansal and Rupasinghe (1996) provided an empirical approach to develop a simple correlation for sizing capillary tube used for HFC-134a. The correlation is based on the assumption that the capillary tube length depend on the capillary tube inner diameter, mass flow rate of the refrigerant in the tube, degree of sub cooling, surface roughness of capillary tube and evaporating and condensing temperature.
Melo et al. (1999) presented experimental results on capillary tubes using CFC-12, HFC-134a and HC-600a and compared with dimensionless analysis developed for prediction of mass flow rates of refrigerants.
Jung et al. (1999) had modified Stoecker's basic model to size capillary tube for HFC-22 and its alternative refrigerant by considering pressure drops due to subcooling and area contraction.
Sami and Maltais (2000) presented a numerical model for predicting capillary tube performance using new alternative refrigerants to HCFC-22 and the model based on fluid flow conservation equations written for a homogenous refrigerant fluid flow under saturated, subcooled and two-phase flow conditions and the numerical results revealed that the proposed model simulated meet the experimental results.
Wongwise and Pirompak (2001) presented results for their developed adiabatic capillary tube model by comparing various alternative mixtures of refrigerant and in particular between the following pairs of CFCs and HCFCs with HFCs. They also presented results that are useful for selecting appropriate viscosity model for each refrigerant. Chicchitti model was the best predictor of two-phase flow for HFC-134a by comparing with Melo (1999). They also provide a preliminary selection chart for refrigerant HFC-134a. The chart is valid only for steady adiabatic flow through capillary tubes. For a capillary tube having an internal diameter of 1.63 mm and a length of 2.03 m, the required mass flow rate can be easily determined from the chart by knowing the condenser pressure and the degree of sub cooling. The chart is similar to rating charts for CFC-12 developed by ASHRAE.
Kim et al. (2002) presented a dimensionless correlation based on Buckingham 1[
theorem to predict mass flow rate through adiabatic capillary tubes for R22, R407C and R 41 OA. The correlation is based on experimental data and the values of refrigerant properties were obtained from REFROP database.
Wongwise and Trisaksri (2003) produced new correlations for sizing capillary tube based on conservation of mass, energy and momentum and validated with
experimental data. The new correlations are developed by selecting parameters that have influence on the length of capillary tube.
2.2.1 Calculating pressure drop
The flow within a capillary tube is modeled by dividing the flow into a subcooled liquid region and saturated two-phase flow region (see Fig. 2.3). The refrigerant can exist as either a subcooled liquid or in two-phase at its inlet at point 1. At subcooled liquid region, the pressure decrease linearly from point 2 to 3. At point 3, flashing occurs. At saturated two-phase flow sections, at point 3 to 4, the pressure drop increases along the capillary tube.
Condenser Evaporator
Fig. 2.3 Schematic diagram of an adiabatic capillary tube
2.2.1.1 Single-phase flow region
Pressure drop L1ps between two points of tube can be expressed from steady flow energy equation (Whitesel, 1957a & 1957b; Mikol, 1963; Wong and Ooi, 1995; Bansal and Rupasinghe, 1998; Wongwise and Pirompak, 2001; and Wongwises and Trisaksri, 2003):
where
A .(: Ls U;
LJps
=
p-D 2vs
Is
single-phase flow friction factorLs length of capillary tube in single phase D bore of capillary tube
A cross-sectional area of the capillary tube
Vs specific volume of subcooled liquid refrigerant
11
[image:24.608.186.433.283.369.2]