BIROn - Birkbeck Institutional Research Online
Gudmundsson, G.S. and Zoega, Gylfi (2014) Age structure and the current
account. Economics Letters 123 (2), pp. 183-186. ISSN 0165-1765.
Downloaded from:
Usage Guidelines:
Please refer to usage guidelines at or alternatively
1
Age structure and the current account
Gudmundur S. Gudmundssona and Gylfi Zoegab,c,
a Department of Economics and Business, Universitat Pompeu Fabra, Ramon Trias Fargas 25-27, 08005 Barcelona.
b Department of Economics, University of Iceland, Saemundargata 2, 101 Reykjavik, Iceland. c Birkbeck College, University of London, Malet Street, LondonWC1E7HX.
11 November 2013
Abstract
We adjust current account surpluses and deficits of 57 countries in the period 2005-2009 for differences in the age structure of their populations and find that these differences can account for a significant part of the variation in the data. Among the large countries we find that the adjustment increases the surpluses of Germany and Japan while the surpluses of China, Singapore, Hong Kong, Korea, Thailand, Indonesia and Malaysia are significantly diminished.
Keywords: Current account, age structure, life-cycle saving behavior. JEL classification: J1; E2
2
1.
Introduction
Do China’s current account surpluses reflect the effect of its one-child policy on savings rates or are they instead caused by exchange-rate manipulations? Similarly, do German surpluses reflect the effect of that countries’ age distribution or are they caused by its membership of the Euro zone? Similarly for deficit countries: Perhaps demographics partially explain the current account deficits of Spain, the U.K. and the U.S. Moving further afield, do the high saving rates of the fast growing East Asian economies primarily reflect their rising number of prime-aged individuals in past decades and will they decline as the population ages? These are some of the questions that we attempt to answer in this paper. We explore the extent to which observed current account imbalances between countries can be attributed to differences in the population age structure and to which extent they can be attributed to other factors such as economic policy. In particular, we take into account the statistical relationship between age structure and the current account and correct for its influence on the current account of 57 countries using data from 1980 to 2009.
Our hypothesis that savings behavior reflects age structure is based on the life-cycle hypothesis (see Modigliani, 1975) and the national account identity. These imply, ceteris paribus, that a nation largely at work should have a larger current account surplus compared with another with proportionately more young and old people. An aging population is likely to generate higher saving rates when individuals start saving for retirement and lower saving rates once they start spending their savings during retirement. An aging population is also likely to provide fewer investment opportunities since rising capital-labor ratios make the return to investment lower. Further reinforcing this trend is the possibility that an aging population will have a dwindling pool of potential entrepreneurs. To the extent that such demographic differences explain the global imbalances they may only reflect an efficient reallocation of capital.
We start by surveying the literature before describing the data and estimating relationships between the age structure and current account surpluses.
2.
Literature
3
determinant of savings rates. The relationship was confirmed in a cross section of a large sample of countries but his findings stirred some controversy.1
Fry and Mason (1982) and Mason (1987, 1988) rekindled interest in this relationship by looking at the savings rate as a function of the youth dependency ratio in addition to the product of this ratio and economic growth. Economic growth is included because the younger cohorts enjoy higher permanent incomes and higher consumption when labor productivity growth is positive. For this reason the negative effect of an increase in the youth dependency ratio on savings should be rising in the rate of productivity growth. These authors found empirical support for their model in a negative relationship between the youth dependency rate and savings rates.
Taylor and Higgins (1994) explained the capital flow from Britain to Australia, Canada, the U.S. and Argentina in the late 19th century, early 20th century by high youth dependency ratios in the New World while controlling for the interaction of growth and the youth
dependency ratio. The resource abundant New World attracted large numbers of immigrants with a high fertility rate, which generated higher youth dependency ratios in the New World than in the Old. As a result the savings rate was lower in the former and a capital flowed from the Old World. In a comprehensive study, Higgins (1998) studied the effect of demography on national savings and the current account balance in a sample of 100 countries. He found that an increase in both the youth- and old-age dependency ratios is associated with lower savings and larger current account deficits. These effects are quite sizable; the demographic effects on the current account balance in some cases exceeded 6% of GDP per year over the seventies to the end of the nineties.
Taylor (1995) used demographic trends to predict that the growing elderly dependency ratio in the developed world and the falling youth dependency ratio in the developing world were likely to create a pattern of current account surpluses in some of the developing countries and deficits in the Old World in the first part of the 21st century. Changes in the world saving-investment nexus would transform the pattern of global capital flows seen in the 1970s and 1980s.
More recently, Miles (1999) performs simulations based on calibrated general equilibrium models to find that savings in the longer term are likely to fall well below 1990s levels as the proportion of the population aged over 65 rises. Lindh (1999) describes a positive relationship between the share of the working age population and savings and growth. Bloom and
4
Williamson (1998) attribute the East Asia’s economic miracle to a democratic transition, which occurred in part because its working age population grew at a much faster rate than its dependent population between 1965 and 1990. In Bloom at al. (2010) a rising share of the population aged over 60 will depress savings and growth. Aksoy and Smith (2012) find a strong effect of demography on growth using OECD data. Finally, Lane and Milesi-Ferretti (2012) find that more rapidly advancing advanced economies run more positive current account balances while a high old-age dependency ratio lowers the balance for developing countries.
3.
Demographics and the current account
We start with a preliminary look at the data. The data consist of twelve population variables, measuring the proportion of population in each of twelve age groups, for 57 countries over the period 1980-2009.2
The surplus and deficit countries have different age structures, with the deficit countries on average having a higher share of people over the age of 50. Figure 1 shows the age structure of the working age population in the top 10 current account deficit and surplus countries, averaging over the period 2005-2009.
Figure 1. The average age structure in the top 10 surplus and deficit countries
2The countries are: Argentina, Australia, Austria, Belgium, Brazil, Bulgaria, Canada, Chile, China, Colombia, Croatia, Czech Republic, Denmark, Estonia, Finland, France, Germany, Greece, Hong Kong, Hungary, Iceland, India, Indonesia, Ireland, Israel, Italy, Japan, Korea, Rep., Latvia, Lithuania, Luxembourg, Malaysia, Mexico, Morocco Netherlands, New Zealand, Norway, Pakistan, Peru, Philippines, Poland, Portugal, Romania, Russia, Saudi Arabia, Singapore, Slovak Republic, Slovenia South Africa, Spain, Sweden, Switzerland, Thailand, Turkey, Ukraine, the United Kingdom and the United States.
4.0 4.5 5.0 5.5 6.0 6.5 7.0 7.5 8.0
Deficit countries
5
We note that there are more people in the 35-49 age groups in the surplus countries than in the deficit countries while the share of people over 50 is higher in the deficit countries.
We now proceed to calculate correlations between the share of the population in each of the twelve age groups and the current account surplus as a percentage of GDP over the period 1995-2009. The results are shown in Figure 2. The correlation is positive for the ages 30-55 but negative for both younger and older groups. This implies that the larger the share of the population in the younger and the older age groups, the larger is the current account deficit. Furthermore, the larger the share in the middle-age groups the smaller the deficit, or
equivalently, the larger is the current account surplus. This is exactly what the life-cycle theory would suggest.3,4
Figure 2. The correlation between the current account and population shares (1995-2009)
4.
Regressions
To further analyze the relationship between age structure and the current account we regress the current account surplus in percentages of GDP on three composite population variables, measured in percentages of the total population, in addition to the growth rate of output per capita and an interaction term between the youngest age group and growth, following Fry and
3 Cross-country studies that have found correlations between saving rates and the demographic structure, hence
the life-cycle hypothesis, include, in addition to Leff (1969), Modigliani (1970), Modigliani and Sterling (1983), Graham (1987), Masson and Tryoin (1990), and Masson et al. (1996). For a micro-level study of household saving behaviour, see Poterba (1994).
4 An interesting difference arises between the pattern shown in Figure 2 and the analogous pattern found when
using data for the 1960-1990 period. In that period the correlation between age and the current-account surplus was positive for the older age groups but it is negative for 1995-2009, as seen in Figure 2. This pattern gradually emerges when we calculate the correlations recursively; first for the period 1990-1995, then by adding 1996, 1997 and so on, one at the time.
-0.20 -0.10 0.00 0.10 0.20 0.30 0.40
6
Mason (1982). We use data on all 57 countries from 1980-2009 for the regressions. The three age groups are 0-24, 25-64 and 65+.
We estimate the relationship with two different estimators: The within-groups estimator, also known as the fixed-effects estimator, and the pooled OLS estimator. When the
relationship is estimated with fixed effects, one of the population variables has to be omitted to prevent perfect multicollinearity. For this reason, the middle group variable was omitted. For consistency, we also omit the same variable in the pooled OLS regression. The models were estimated with robust standard errors clustered by country.
Table 1. The current account and the age structure
Standard errors in parentheses. *** denotes significance at the 1% level, ** at the 5% and * at the 10%.
Column (1) of Table 1 presents the results of estimating the relationship with the pooled OLS estimator. The results are roughly consistent with the graphical representation in Figure 2. In particular, the current account surplus is lower the larger is the share of the 65+ and the 0-24 age groups. The coefficients of the two growth terms are statistically insignificant.5,6 In columns (2) and (3) we repeat the estimation with the fixed-effects estimator, both with and without the growth terms. The fixed effects estimator yields very similar results, which indicates that the coefficient estimates in column (1) are not merely picking up the effect of omitted time-invariant country effects. Because the demographic variables can be considered
5 Higgins (1998) also found a statistically insignificant coefficient for the interaction term.
6
We also tried a specification with two dummy variables, one for countries previously exposed to a financial crisis and one for oil producing countries. While both turned out to be significant, their inclusion did not significantly affect the estimated coefficients of the demographic variables.
Pooled OLS Fixed Effects
(1) (2) (3)
Young
(0-24) -0.550*** (0.142) -0.607*** (0.168) -0.615*** (0.188)
Old (65+) -1.136*** (0.335) -1.271*** (0.461) -1.306*** (0.488)
Growth per
Capita (30.262) -35.292 (29.232) -14.889 Growth *
Young (0.613) 0.610 (0.655) 0.227
Constant 33.921*** (9.389)
Average fixed Effect
37.387*** (11.212)
38.216*** (12.367)
R2 0.119 0.451 0.469
F-statistic 51.15 21.509 21.425
7
predetermined with respect to contemporaneous economic variables, we rule out endogeneity of the population structure. As the inclusion of the growth terms did not seem to significantly alter the estimated coefficients of the population variables we adopt column (2) of Table 1 as our main regression.
5.
Age-adjusted imbalances
We now use the results from Table 1 to correct the average observed current account values between 2005 and 2009 for the effects of the age structure. We subtract the age effect from the observed current account data using estimated coefficients from column (2) in Table 1 and then subtract the average value of the fixed effects. This creates a series of the same order as the original current account, without taking the cross-country differences in the fixed effect constants into account. This transformation changes the position of many countries
significantly as shown in Figure 3 where the horizontal axis has the unadjusted values and the vertical axis has the adjusted current account. Observations above the 45° line indicate
[image:8.595.88.502.445.719.2]countries that have a greater adjusted surplus or smaller adjusted deficits.
Figure 3. Average adjusted and unadjusted current account surpluses (2005-2009)
While the points roughly follow the 45° line on average, there are some notable departures from the line, indicating that demographic differences explain part of the global imbalances.
Saudi Arabia Singapore
Hong Kong Sweden
China Germany
Japan
Korea Pakistan
-25 -20 -15 -10 -5 0 5 10 15 20 25
-25 -15 -5 5 15 25
CA
8
Thus the adjusted surpluses of Japan, Germany and Sweden are larger than the actual ones while the surpluses of South Korea, China, Hong Kong and Singapore are significantly smaller.
In Table 2 we show the actual current account surplus (% of GDP) for 2005-2009, the correction measured by the difference between the adjusted and the unadjusted surpluses – so that a positive number implies that the current account surplus (deficit) of the country is larger (smaller) once the age distribution has been taken into account – and the corrected surplus.7 Among surplus countries, we see that the current account surpluses of Japan, Germany, Sweden and Belgium are increased by the adjustment while the surpluses of Singapore, Hong Kong, Korea, China, Thailand and Saudi Arabia are significantly decreased. Among the deficit countries, we have the deficits of Pakistan, Italy, France, Latvia and Estonia falling. The deficits of the Slovak Republic, the Czech Republic, Turkey and Ireland become larger. While the adjusted deficit of Iceland – the record deficit country – slightly increased through the adjustment, the adjusted deficits of the Baltic countries Greece and Bulgaria remained high in spite of a downward revision. Iceland, Bulgaria, Latvia, Romania, Greece and Portugal remain the highest deficit countries.
China’s surplus of 7.80% of GDP in 2005-2009 is reduced by 4.4%with the adjustment. In contrast, Germany’s surplus of 6.18% is increased by 3.14%. This is explained by the fact that China has a smaller share of older people than Germany and the age structure in the past twenty years has tended to increase the surplus of China and, after 2000 and diminish the surplus of Germany.8 The surplus of Japan is also increased. Among the big deficit countries we have Spain’s deficit increasing slightly and the same with the United States.
Overall, the results show that if it were not for changes in the age structure, the surpluses of Korea, Thailand, Malaysia, China, Hong Kong, Chile and Singapore, amongst others, would be smaller; the surpluses of Germany and Japan large, and the deficits of many countries in the developed world, such as Italy, France and the U.K., would also be smaller.
In Figure 4 we show the evolution of the current account for three of the largest
economies that have played a big role in the generation of the pattern of global imbalances.
7 Note that Thailand, Korea, Canada and Indonesia are surplus countries in terms of actual surpluses but deficit
countries when it comes to the corrected surpluses in Table 2. Similarly, the deficit countries Italy and France turn out to be surplus countries after the correction.
8 In particular, in terms of 2005-2009 averages, about 7.8% of the population fall into the 65+ group for China,
9
Table 2. Actual and corrected current account surpluses 2005-2009 (% of GDP)
Correction Correction
Saudi Arabia 22.78 -3.05 Saudi Arabia 19.74 Iceland -19.54 -0.41 Iceland -19.96
Singapore 20.36 -7.17 Malaysia 14.88 Bulgaria -17.32 0.73 Bulgaria -16.59
Malaysia 16.37 -1.48 Norway 14.81 Latvia -12.42 2.43 Latvia -9.99
Norway 14.33 0.47 Singapore 13.19 Greece -11.73 1.8 Romania -9.94
Hong Kong 11.61 -5.73 Sweden 11.12 Portugal -10.93 1.21 Greece -9.93
Switzerland 10.2 -0.08 Switzerland 10.13 Romania -9.65 -0.29 Portugal -9.72
Luxembourg 8.71 -1.24 Germany 9.32 Estonia -9.45 2.41 Slovak Rep. -9.50
Sweden 8.05 3.06 Japan 7.60 Spain -8.23 -0.31 Spain -8.54
China 7.8 -4.45 Luxembourg 7.48 Lithuania -8.15 1.51 New Zeal. -7.21
Russia 7.36 -1.43 Russia 5.93 New Zeal. -7.14 -0.06 Estonia -7.04
Netherlands 6.4 -0.69 Hong Kong 5.87 Croatia -6.63 1.48 Turkey -6.95
Germany 6.18 3.14 Netherlands 5.71 Slovak Rep. -6.29 -3.21 Lithuania -6.64
Philippines 3.74 1.33 Philippines 5.07 Hungary -5.95 -0.1 Hungary -6.05
Japan 3.69 3.91 Israel 4.83 South Africa -5.39 -0.65 South Africa -6.04
Finland 3.23 1.27 Finland 4.50 Australia -5.16 -0.48 Poland -6.03
Austria 3.21 0.8 Austria 4.01 Turkey -4.9 -2.05 Ireland -6.00
Israel 3.02 1.81 Argentina 3.95 U.S. -4.88 -0.51 Australia -5.64
Denmark 2.96 0.64 Denmark 3.60 Pakistan -4.86 3.36 United States -5.39
Thailand 2.45 -4.09 China 3.35 Poland -4.61 -1.42 Croatia -5.15
Argentina 2.36 1.59 Belgium 2.51 Ireland -4.18 -1.82 Czech Rep. -4.95
Korea 2.01 -5.22 France 1.41 Slovenia -3.44 -1.02 Slovenia -4.45
Chile 1.81 -1.65 Italy 0.91 Czech Rep. -2.41 -2.54 Colombia -3.42
Indonesia 1.38 -2.18 Peru 0.90 U.K. -2.23 1.89 Korea -3.21
Belgium 0.43 2.08 Chile 0.16 Colombia -2.21 -1.22 Brazil -1.84
Peru 0.37 0.53 Ukraine -2.16 0.83 India -1.83
Canada 0.3 -1.73 Italy -1.71 2.62 Morocco -1.71
India -1.51 -0.32 Thailand -1.64
Morocco -1.36 -0.35 Pakistan -1.50
France -1.06 2.47 Canada -1.43
Mexico -0.81 -0.14 Ukraine -1.33
Brazil -0.05 -1.79 Mexico -0.96
Indonesia -0.80
U.K. -0.34
De ficit countrie s
Actual surpluses Correctedsurpluses Actual surpluses Corrected surpluses
10
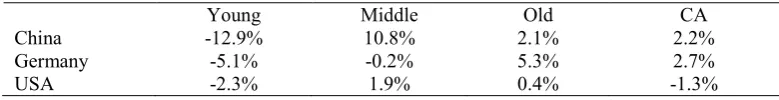
We note that the current account surplus of China after 1995 appears to a significant extent to be created by changes in the age structure of the population. The current account surplus would be reduced to almost nothing in 2009 were it not for a rising share of the working-age population and a falling share of the youngest population group. In contrast, the current account of Germany would be in a bigger surplus were it not for the rising share of the oldest cohort. Finally, the current account deficit of the United States would be slightly larger were it not for the fall in the share of the youngest cohort.9
We conclude that the imbalances of Germany appear to be created by factors other than the age structure of the population. In contrast, the adjusted imbalances of China are
significantly diminished once the adjustment has taken place, while the deficit of the USA increases, although only slightly.
6.
Conclusions
We have found that differences in age structure across countries help explain the global imbalances that emerged in the first decade of this century. We can now answer the questions posed at the beginning of this paper.
More than a half of the Chinese surpluses can be explained by the age structure of the nation. While the proportion of the youngest age group (0-24 years) fell by 12.9% and the proportion of the old (65+) increased by 2.1% between 1990 and 2009, the proportion of the middle group (25-64) increased by 10.8%. Similarly, the current account surpluses of
Singapore, Hong Kong, Korea, Thailand, Indonesia and Malaysia are much diminished when the age structure is taken into account. In contrast, the age-adjusted surpluses of Germany are higher than the actual ones since although the share of the young in Germany has been
decreasing, the share of the old has been increasing. Hence the German surpluses can possibly be traced to policies, such as membership of the Euro zone, which may have increased
competitiveness. The same applies to Japan; its age-adjusted surplus is more than twice the size of the observed one.
While the ranking of the surplus countries is much changed due to the age adjustment, this does not happen for the deficit countries and the top deficit countries remain the same as before the adjustment. In spite of a downward revision for some countries, such as Italy, France and the U.K., other big deficit countries such as Spain and the U.S. remain big deficit countries after the age adjustment.
11
Figure 4. Actual and age-adjusted current account of China, Germany and the U. S.
-4 -2 0 2 4 6 8 10 12
China CA
China CA adjusted
-4 -2 0 2 4 6 8 10 12
Germany CA
Germany CA adjusted
-8 -6 -4 -2 0 2 4
USA CA
12
Table A1. Changes in population shares and the current account (calculated as the difference between the last value and the first)
1990-2009
Young Middle Old CA
China -12.9% 10.8% 2.1% 2.2%
Germany -5.1% -0.2% 5.3% 2.7%
USA -2.3% 1.9% 0.4% -1.3%
2000-2009
Young Middle Old CA
China -4.1% 3.0% 1.0% 3.5%
Germany -1.9% -1.9% 3.9% 7.4%
USA -1.2% 0.7% 0.5% 1.5%
References
Adams, Nassasu A. (1971), Dependency Rates and Savings Rates: Comment,” American Economic Review, 61 (3), 472-475.
Aksoy, Y, Grasl, T. and R.P. Smith (2012), “The Economic Impact of Demographic Structure in OECD countries,” Birkbeck College, Discussion Paper #1212.
Ando, Albert and Franco Modigliani (1963), “The ´Life-Cycle´Hypothesis of Saving: Aggregate Implications and Tests,” American Economic Review, 53, 55-84.
Bloom, D. E. and Jeffrey G. Williamson (1998), “Demographic Transitions and Economic Miracles in Emerging Asia,” World Bank Economic Review, 12 (3), 419-455.
Bloom, D., D. Canning, and G. Fink (2010), “Implications of Population Ageing for Economic Growth,” Oxford Review of Economic Policy, 26 (4), 583-612.
Coale, A. and E. Hoover (1958), Population Growth and Economic Development in Low-income Countries, Princeton University Press.
Fry, M. and A. Mason (1982), “The Variable Rate-of-Growth Effect in the Life-Cycle Model,” Economic Inquiry, 20, 232-233.
Goldberger, Arthur S. (1973), “Dependency Rates and Savings Rates: Further Comment,”
American Economic Review, 63 (1973), 232-233.
Graham, J.W. (1987), International Differences in Savings Rates and the Life Cycle Hypothesis. European Economic Review 31, 1509–1529.
Gruber, J.W. and S.B. Kamin (2007), “Explaining the Global Pattern of Current Account Imbalances,” Journal of International Money and Finance, 26, 500-522.
Herbertsson, T. T., Zoega, G., 1999. Trade surpluses and Life-Cycle Saving Behavior.
Economics Letters, 65, 227-237.
Higgins, M. (1998), “Demography, National Savings, and International Capital Flows,”
13
International Monetary Fund, “World Economic Outlook (WEO)”, http://www.imf.org/external/pubs/ft/weo/2012/02/weodata/index.aspx.
Lane, Philip R. and Gian Maria Milesi-Ferretti (2012), “External Adjustment and the Global Crisis,” Journal of International Economics, 88, 252- 265.
Leff, N.H. (1969), “Dependency Rates and Saving Rates,” American Economic Review , 59 (5), 886–896.
Lindh, T. (1999), “Age Structure and Economic Policy: The case of saving and growth,”
Population Research and Policy Review, 18, 261-277.
Mason, A. (1987), “National Savings Rates and Population Growth: A New Model and New Evidence,” in D. Johnson and R. Lee, eds., Population Growth and Economic Development: Issues and Evidence , Wisconsin University Press, 523-560.
Mason, A (1988), “Saving, Economic Growth and Demographic Change,” Population and Development Review, 14, 113-144.
Masson, P., Bayoumi, T. Samiei, H., (1996), “International Evidence on the Determinants of Private Saving,” CEPR, Discussion Paper No. 1368.
Masson, P.R., Tryoin, R.W., (1990), “Macroeconomic Effects of Projected Population Aging in Industrial Countries” IMF Staff Papers 37, 453–485.
Miles, D. (1999), “Modelling the Impact of Demographic Change upon the Economy,” The Economic Journal 109 (452), 1-36.
Modigliani, F., (1975), “The Life-Cycle Hypothesis of Saving Twenty Years Later.” In: Parkin, M. (Ed.), Contemporary Issues in Economics, Manchester University Press.
Modigliani, F., Sterling, A., (1983), “Determinants of private saving with special reference to the role of social security-cross country tests.” In: Modigliani, F., Hemming, R. (Eds.), The Determinants of National Saving and Wealth, St. Martin’s Press, New York.
Poterba, J., (1994), International Comparisons of Household Saving, Chicago University Press, Chicago.
Taylor, A. M. (1995), “Debt, Dependence and the Demographic Transition: Latin America into the Next Century,” World Development 23, 869-879.
Taylor, A. and J. Williamson (1994), “Capital Flows to the New World as an Intergenerational Transfer,” Journal of Political Economy, 102, 348-369.