DEC-JAN, 2017, VOL. 4/19 www.srjis.com Page 4276 SOCIAL ADJUSTMENT OF HIGHER SECONDARY STUDENTS – AN ANALYSIS
P. Jayachandran
The research study focussed on the social adjustment of higher secondary students in the residential school. Survey method is employed to collect the data through questionnaire by adopting random sampling technique. The sample size of the study is 132. The main objectives of the study are, to assess the level of social adjustment among higher secondary school students, to find out the relationship between the dimensions of social adjustment. The major findings of the study show that higher secondary students in residential schools have low level of social adjustment. There is a significant positive correlation between the dimensions of social adjustment.
Introduction
Social adjustment has been considered as one of the major contributing psychological
factor in characterising the individuals. The learners have to develop the adjustmental ability
which in turn will make the individuals to grow as responsible citizens of the society. The
residential school students should have adjustment behaviour as they are aloof from the
family. If the students lacking in their behaviour the institution has to take necessary
measures to develop and acquire the skills of adjustment behaviour.
Need and Significance of the study
The primary goal of the research is to establish the different types of adjustment
behaviour among higher secondary school students. Social adjustment on the part of
Juveniles and also adolescents is considered to be one of the most leading public concerns. It
is the responsibility of the educationists, parents and the care takers to imbibe social – values
among juveniles. The victims of crime and delinquency often suffer high physical and
psychological pain as well as financial loss. Where crime and delinquency rates are high, fear
and distrust may rule roost. Given the diversity and gravity of these problems, there is an
urgent need for strategies to combat such a complex social phenomena such as social
adjustment.
R4Z Scholarly Research Journal's is licensed Based on a work at www.srjis.com
DEC-JAN, 2017, VOL. 4/19 www.srjis.com Page 4277 Operational Definition
Social adjustment
Social adjustmentin humans results from interactions between persons and their
environment that are perceived as straining or exceeding their adaptive capacities and
threatening their well–being. Anxiety is an unpleasant state of inner turmoil, often
accompanied by nervous behaviour.
In the present investigation, the social adjustment is assessed by the scores obtained from the
residential school students using Social adjustment rating scale constructed by Karplus
(2011).
Objectives of the study
1. To assess the level of social adjustment among residential school students.
2. To find out the relationship between the dimensions of social adjustment.
Hypotheses of the Study
There is a significant relationship between the dimensions of social adjustment.
Methodology and Area of Investigation
Survey method is employed to collect the data by adopting random sampling
technique. The sample of the study is 132. The area of study is around 3 districts of Tamil
Nadu. It was considered that this approach to the collection of data would render the results
of study more realistic and in tune with ground realities.
Sample for the main study
After obtaining the prior permission from “The Directorate of Social Defence”, Government of Tamil Nadu, the data for the study was collected. A sample of about 132
Residential school students of age group between 15 – 18 years from 3 different districts in
Tamil Nadu as scheduled by ‘The Directorate of Social Defence’ were considered to be the
sample for the present study.
Description of tool
To verify the framed hypotheses the following tool has been used in the present study,
Social adjustment Inventory
Social adjustment Inventory was constructed and standardized by the Investigator
under the guidance of Research Supervisor. The questionnaire comprising of 68 items under
DEC-JAN, 2017, VOL. 4/19 www.srjis.com Page 4278
S.No Dimensions Items
1 Conduct disorder 1 – 21
2 Personality disorder 22 – 44
3 Attention deficit hyperactive disorder 45 – 68
Every items in the inventory is being evaluated over three choices that are shown with the
options ‘Usually’, ‘Sometimes’, ‘Never’. Scoring for this 3 point scale is assigned a
weightage ranging from 3 to 1 as given in the tool. The maximum score is 204 and minimum
score is 68.
Pilot Study
A random sample of 60 Residential school students was selected for the pilot study to
establish reliability and validity. The reliability of the Social adjustment Inventory was found
to be 0.77 using Karl Pearson product correlation method. Validity of the tool was found to
be 0.87.
Hypothesis 1
The level of social adjustment among residential school students is moderate in
[image:3.595.132.457.534.670.2]nature.
Table 1 Level of social adjustment among residential school students
Variable category Frequency Percent Cumulative
percent
Social adjustment
Low 38 3.5 3.5
Moderate 40 6.1 9.6
High 54 90.4 100.0
Total 132 100.0
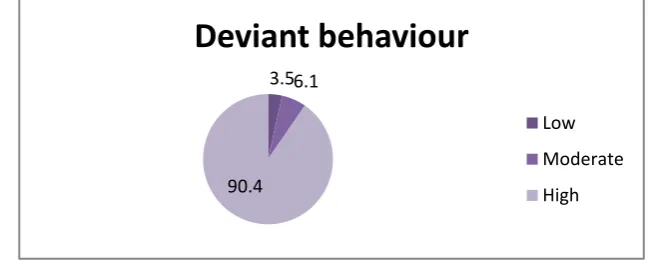
From the above table, it is inferred that 90.4% of Residential school students have high social
adjustment. 6.1% and 3.5% of Residential school students have average and low level of
social adjustment. Hence the null hypothesis is rejected.
Hypothesis 2
There is no significant difference of social adjustment based on father Occupation 3.56.1
90.4
Deviant behaviour
Low
Moderate
DEC-JAN, 2017, VOL. 4/19 www.srjis.com Page 4279 Table 2 Comparison of Social adjustment– Father Occupation
Variable
Source of Variance
Sum of
Squares df
Mean
Square F-value
Level of Significance
Social adjustment
Between
Groups 94,916.205 20 31,638.735
171.572 0.01
Within
Groups 84,088.743 112 184.405
Total 179,004.948 132
The calculated F-ratio (171.572) which is greater than the table value at 0.01 level of
significance, it is concluded that there exist a significant difference of Social adjustment
based on father Occupation. Hence the null hypothesis is rejected. The table has been
analyzed further among the groups using ‘t’ test.
Table 2.1 Mean, SD, „t‟-values of Social adjustment among Residential school students based on Father occupation
Father
Occupation Samples Mean S.D „t‟- Value
Level of Significance
Unemployed 16 111.59 20.592
12.97 0.01
Cooly 40 59.74 6.437
Unemployed 16 111.59 20.592
15.25 0.01
Business 53 173.46 11.635
Unemployed 16 111.59 20.592
14.47 0.01
Professional 23 172.43 14.000
Cooly 40 59.74 6.437
112.17 0.01
Business 53 173.46 11.635
Cooly 40 59.74 6.437
75.51 0.01
Professional 23 172.43 14.000
Business 53 173.46 11.635
0.62 N.S
Professional 23 172.43 14.000
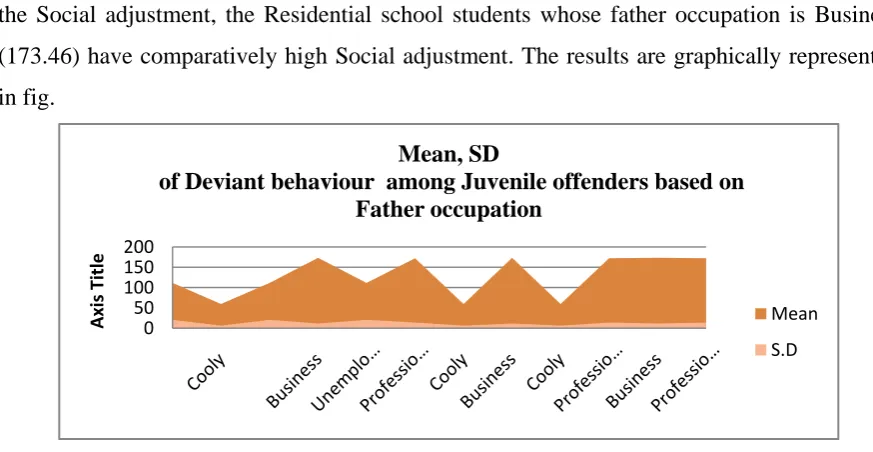
Analysis of mean difference between the father occupation was tested which reveals that in
the Social adjustment, the Residential school students whose father occupation is Business
(173.46) have comparatively high Social adjustment. The results are graphically represented
in fig.
0 50 100 150 200
Axis
Title
Mean, SD
of Deviant behaviour among Juvenile offenders based on Father occupation
Mean
[image:4.595.73.510.531.757.2]DEC-JAN, 2017, VOL. 4/19 www.srjis.com Page 4280 Hypothesis 3
[image:5.595.137.459.378.593.2]There is no significant difference of Social adjustment based on Father Qualification.
Table 3 Comparison of Social adjustment - Father Qualification
Variable
Source of Variance
Sum of
Squares df
Mean Square
F-value
Level of Significance
Social adjustment
Between
Groups 7,544.295 3 2,514.765
48.114 0.01
Within
Groups 23,833.566 129 52.267
Total 31,377.861 132
The calculated F-ratio (48.114) which is greater than the table value at 0.01 level of
significance, it is concluded that there exist a significant difference in Social adjustment
based on Father Qualification. Hence the null hypothesis is rejected. The table has been
analyzed further among the groups using‘t’ test.
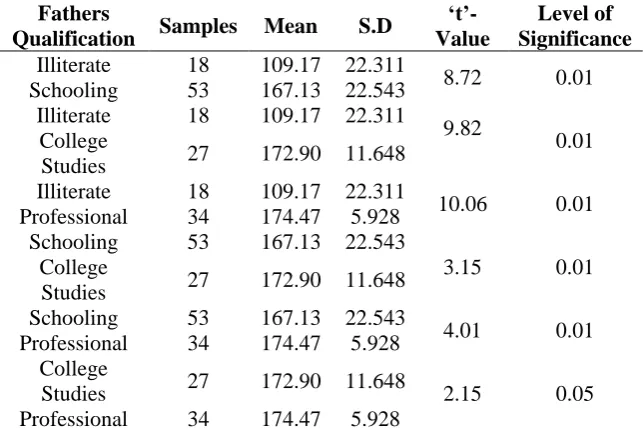
Table 3.1 Mean, SD, „t‟-values of Social adjustment among Residential school students based on fathers qualification
Fathers
Qualification Samples Mean S.D
„t‟- Value
Level of Significance
Illiterate 18 109.17 22.311
8.72 0.01
Schooling 53 167.13 22.543
Illiterate 18 109.17 22.311
9.82
0.01 College
Studies 27 172.90 11.648
Illiterate 18 109.17 22.311
10.06 0.01
Professional 34 174.47 5.928
Schooling 53 167.13 22.543
3.15 0.01
College
Studies 27 172.90 11.648
Schooling 53 167.13 22.543
4.01 0.01
Professional 34 174.47 5.928
College
Studies 27 172.90 11.648 2.15 0.05
Professional 34 174.47 5.928
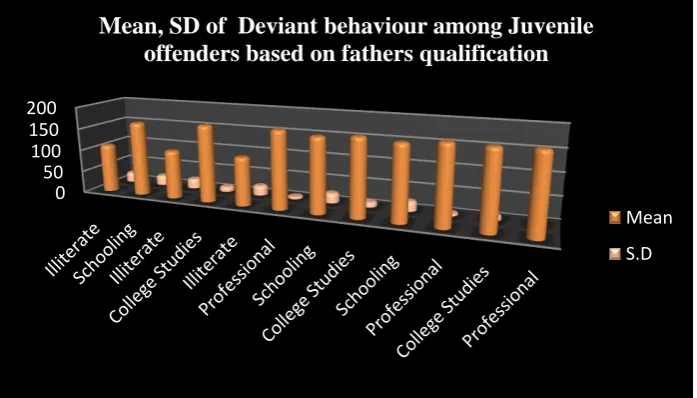
Analysis of mean difference between the fathers qualification was tested which reveals that in
the Social adjustment, the Residential school students whose father qualification is
Professional (174.47) have comparatively high Social adjustment. The results are graphically
DEC-JAN, 2017, VOL. 4/19 www.srjis.com Page 4281 Hypothesis 4
There is no significant difference of Social adjustment based on Location of residence.
Table 4 Comparison of Social adjustment – Location of residence
Variable
Source of Variance
Sum of
Squares df
Mean Square
F-value
Level of Significance
Social adjustment
Between
Groups 2,319.159 3 1,159.579
2.999 0.05
Within
Groups 176,685.789 129 386.621
Total 179,004.948 132
The calculated F-ratio (2.999) which is greater than the table value at 0.05 level of
significance, it is concluded that there exist a significant difference in Social adjustment
based on Location of residence. Hence the null hypothesis is rejected. The table has been
[image:6.595.125.474.74.273.2]analyzed further among the groups using‘t’ test.
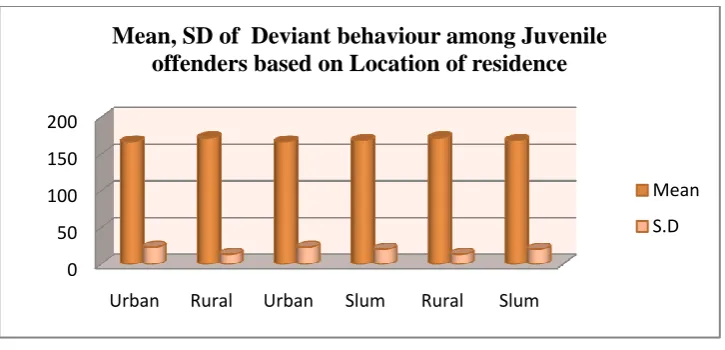
Table 4.1 Mean, SD, „t‟-values of Social adjustment among Residential school students based on Location of residence
Location Samples Mean S.D „t‟-
Value
Level of Significance
Urban 64 172.59 23.141
2.50 0.05
Rural 15 166.26 13.625
Urban 64 172.59 23.141
0.79 N.S
Slum 53 168.54 20.539
Rural 15 166.26 13.625
1.98 0.05
Slum 53 168.54 20.539
Analysis of mean difference between the Location of residence was tested which reveals
that, in the Social adjustment the Residential school students belonging to urban (172.59)
have comparatively high Social adjustment. The results are graphically represented in fig. 0
50 100 150 200
Mean, SD of Deviant behaviour among Juvenile offenders based on fathers qualification
Mean
DEC-JAN, 2017, VOL. 4/19 www.srjis.com Page 4282 Hypothesis 5
[image:7.595.118.481.69.244.2]There is no significant difference of social adjustment based on family Configuration
Table 5 Comparison of Social adjustment – Family Configuration
Variable Source of
Variance
Sum of
Squares df
Mean Square
F-value
Level of Significance
Social adjustment
Between
Groups 105.135 3 35.045
2.768 0.05
Within
Groups 5,773.961 129 12.662
Total 5,879.096 132
The calculated F-ratio (2.768) which is greater than the table value at 0.05 level of
significance, it is concluded that there exist a significant difference in social adjustment based
on family Configuration. Hence the null hypothesis is rejected. The table has been analyzed
[image:7.595.113.484.544.727.2]further among the groups using‘t’ test.
Table 5.1 Mean, SD,„t‟-values of social adjustment among Residential school students based on family configuration
Family
Configuration Samples Mean S.D „t‟- Value
Level of Significance
Joint Family 18 9.51 3.317
0.94 N.S
Nuclear Family 37 11.98 3.454
Joint Family 18 9.51 3.317 1.66
N.S
Extruded Family 46 11.61 3.573
Joint Family 18 9.51 3.317 2.63
0.01
Broken Family 31 10.90 3.782
Nuclear Family 37 11.98 3.454 0.92
N.S
Extruded Family 46 11.61 3.573
Nuclear Family 37 11.98 3.454
2.20 0.05
Broken Family 31 10.90 3.782
Extruded Family 46 11.61 3.573
1.52 N.S
Broken Family 31 10.90 3.782
0 50 100 150 200
Urban Rural Urban Slum Rural Slum
Mean, SD of Deviant behaviour among Juvenile offenders based on Location of residence
Mean
DEC-JAN, 2017, VOL. 4/19 www.srjis.com Page 4283 Analysis of mean difference between the family configuration was tested which reveals that,
the Residential school students belonging to nuclear family (11.98) have comparatively high
social adjustment. The results are graphically represented in fig.
Major findings of the study
The study shows that Residential school students have high social adjustment. There is a significant difference of Social adjustment based on father
Occupation. The Residential school students whose father occupation is Business
have comparatively high Social adjustment.
There is a significant difference in Social adjustment based on Fathers’ Qualification. The Residential school students whose fathers’ qualification is
Professional have comparatively high Social adjustment.
There is a significant difference in Social adjustment based on Location of
residence. The Residential school students belonging to urban have comparatively
high Social adjustment.
There is a significant difference in social adjustment based on family Configuration. The Residential school students belonging to nuclear family have
comparatively high social adjustment. Educational qualification
Given the diversity and gravity of these problems, there is an urgent need for
strategies to combat such a complex social phenomenon such as social adjustment. But
formulating effective strategies demands a solid understanding of social adjustment its causes
and prevention. The educational institutions must introduce the various coping strategies to
overcome the social adjustment. Social values and other behavioural modification techniques 0
2 4 6 8 10 12
Mean, SD of deviant behaviour among Juvenile offenders based on family configuration
Mean
DEC-JAN, 2017, VOL. 4/19 www.srjis.com Page 4284 have to be introduced with in the schools which help them to meet the emerging needs of the
society.
Conclusion
The study expounds the various social adjustment of Residential school students and
the importance of intervening the offenders with various remedial and intervention procedure
to over come the risk factors and to reduce the rate of victimization.
Bibliography
Platt, A.M. 1991. The child servers: The invention of delinquency, 2nd ed.chicago: university of Chicago press.
Oldenettel, D., and M.wordes. 2000. The community assessment centre concept. Juvenile Justice Bulletin.washington, DC: office of Juvenile Justice and delinquency Prevention.
Menard, S., and D.S.Elliott.1990. Longitudinal and cross sectional collection and analysis in the study of crime and delinquency. Justice Quarterly 7(1):11-15.