Journal of Chemical and Pharmaceutical Research, 2013, 5(12):745-749
Research Article
CODEN(USA) : JCPRC5
ISSN : 0975-7384
K-means algorithm in the optimal initial centroids based on dissimilarity
Wang Shunye, Cui Yeqin, Jin Zuotao and Liu Xinyuan
Department of Computer Science and Technology, Langfang Teachers University, China
_____________________________________________________________________________________________
ABSTRACT
K-means clustering algorithm is one of the most popular clustering algorithms and has been applied in many fields. A major problem of the basic k-means clustering algorithm is that the cluster result heavily depends on the initial centroids which are chosen at random. At the same time, it is not suitable for the sparse spatial datasets which use space distance as the similarity measurement on the algorithm. In this paper, an improved k-means clustering algorithm in the optimal initial centroids based on dissimilarity is proposed. It adopts the dissimilarity to reflect the degree of correlation between data objects, and then uses Huffman tree to find the initial centroids. Many experiments confirm that the proposed algorithm is an efficient algorithm with better clustering accuracy on the same mainly time complexity.
Key words: k-means, initial centroids, Huffman tree, dissimilarity
_____________________________________________________________________________________________
INTRODUCTION
These days many datasets are produced from variety of scientific disciplines and reality life, and data generation, collection and analysis is becoming the main role in research. The data is gathered by whenever, wherever and whatever, and should take value in different fields. Data mining is the process of finding useful information in large data warehouse. Many data mining techniques are used to discover the important patterns from datasets and predict the capabilities in future.
Cluster analysis is the most important unsupervised-learning method. The main purpose is to find a structure in a collection of unlabelled data. Totally the clustering involves partitioning a given dataset into some groups of data whose members are similar in some way. Clustering analysis has been widely used in data recovery, text and web mining, pattern recognition, image segmentation and software reverse engineering [1].
K-means clustering is a popular clustering algorithm. It is partitioning a dataset into k groups in the vicinity of its initialization such that the similar data objects are grouped in the same cluster while dissimilar data objects are in different clusters. However, k- means clustering algorithm also has some limitations. (1), k, the number of clusters is user-parameter, it needs many professional knowledge, and a good clustering with smaller k can have a lower SSE (Sum of the Squared Error) than a poor clustering with higher k [2]. (2), the algorithm heavily depends on the initial conditions, and it is sensitive to the sequence of input, it even often makes converge to local rather than global optimum. (3), it has many problems with outliers, how to detect and mine them is also important. (4), some clustering may produce new problems on high–dimensional and sparse characteristics of dataset, for example the disaster of dimension. (5), it also may make empty clusters. (6), it has problems when clusters are of differing sizes, densities or non-globular shapes.
through combining density of data distribution and the kd-tree. Hang Lingbo[5] improved the initial centroids through the density of data and the average distance. Tong Xuejiao[6] constructed k clusters, then decided each data object belonging to the cluster whether or not depending on the threshold. Zhang Jing [7] presented a method to improve the initial centroids through individual silhouette coefficient.
The high quality clustering is to obtain high intra-cluster similarity and low inter-cluster similarity. How to measure the similarity influences the results of the clustering. Many similarity measurements are chosen to meet different applications or data types. Most algorithms adopt traditional similarity based on spatial distance to describe the relationship between data objects. It includes Euclidean, Manhattan, Minkowsky [8] and Chebychev, especially the Euclidean. They are good at low dimensional data space but failing in dealing with high-dimensional dataset. There are characteristics of sparse, empty space phenomena, the traditional methods in the high-dimensional space are greatly decreased, and the results become unstable [9]. And many papers use similarity to measure the relationship between data objects [10].
In this paper, an improved k-means clustering algorithm based on dissimilarity to optimize initial centroids is proposed. It draws the lessons from the Huffman tree in Wu Xiaorong[11]. Dissimilarity is adopted instead of the space distance method. And it uses the dimension contribution rate to reflect the importance of different attitude to clustering results. So it also can be used in dimension reduction in order to improve efficiency. IRIS, Wine, Balance-scale datasets in UCI [12] are chosen to be trained. Experiments show that the proposed algorithm is good at accuracy rate, especially at high-dimensional space.
K-MEANS CLUSTERING ALGORITHM
The k-means clustering algorithm is one of the top ten data mining algorithms [13]. A description of the basic algorithm follows.
The data set D={x1, x2,…, xm} is assumed. The first k data objects are chosen at random as the initial centroids. The k is user-parameter that the number of clusters desired. Each data object is then assigned to the nearest initial centroid. The idea is to choose random cluster centroids, one for each cluster. The centroid of each cluster is then updated based on means of each group which assign as a new centroids. Then the assignment is repeated and centroids are updated until no data object changes. It means no object navigates from each cluster to another or equivalently, each centroid remains the same comparing with the previous iteration.
Algorithm 1: the basic k-means clustering algorithm Choose k objects as the initial centroids at random Repeat
Assign each object to the nearest cluster center Recompute the cluster centers of each cluster Until convergence criterion is met
The time complexity of the basic k-means cluster algorithm is O ( k*l*m*d ), k represents the number of clusters, l is the number of iterations in order to meet the convergence criterion, m is the size of dataset, d is the number of attributes. So the number k, l, m and d all influence the efficiency of the algorithm.
IMPROVED K-MEANS CLUSTERING ALGORITHM Formal definition
In order to explain the algorithm proposed in this paper, relative definitions are introduced as follows.
Definition 1: The dataset D is defines as D={x1,x2,…,xm}, the size is m, and each object has many attributes, the number is d.
Definition 2: Attribute dissimilarity ad. A dataset D, xi∈D, xj∈D, n represents any attribute, the attribute dissimilarity of xi and xj on the attribute n is:
n n
jn in n
ij
x
x
x
x
ad
min
max
(1)
Because dimensionally homogeneous is exist in huge dataset, the value range of each attribute is absolutely different. Data reprocessing which converts raw data into suitable information is very important. It normalizes the dataset in order to avoid the influence on the data of different dimension.
Definition 3: Object dissimilarity od. The object dissimilarity of xi and xj in dataset D is:
d
ad
w
j
i
od
d n n ij n
1)
,
(
(2)
The wn is dimension contribution rate to weight the difference influence of each attribute in the clustering procedure. It ranges from 0 to 1, and can get from different expressions and also can get from experts in practical application. The wn in [9] is adopted in this paper.
Definition 4: Dissimilarity matrix dm (m*m). The dissimilarity matrix of the given dataset D is:
)
,
(
...
)
2
,
(
)
1
.
(
...
...
...
)
2
,
2
(
)
1
,
2
(
)
1
,
1
(
m
m
od
m
od
m
od
od
od
od
dm
(3)
The optimal initial centroids based on dissimilarity
Formula (1) is used to calculate the dissimilarity between each data object in each attitude. Formula (2) is used to calculate the dissimilarity between each data object including every attitude. The value of the od(i,j) reflects the degree of correlation between xi and xj. The smaller the value, the closer, and it is the greater of possibility to partition in the same cluster. And formula (3) is used to create the dissimilarity matrix dm. It is a symmetric matrix.
Huffman tree (Huffman) is a kind of weighted length of the shortest path tree. Huffman tree is used to calculate the initial centroids. Dissimilarity that defined ahead is adopted to measure the difference between each data objects, and using the dissimilarity matrix to store all the values. Selecting the smallest value in the initial dissimilarity matrix, it means that the most possibility the two objects will be in the same cluster. We compute the average value of the two objects not the sum as a new object, delete the two objects from the dataset, recompute the od(i,j) and get a new dissimilarity matrix dm(m-1,m-1), circle the procedure until getting one object using the Huffman algorithm. According the Huffman tree and the k value, k-1 nodes will be found from the root to leaf nodes. When deleting them, k sub-trees are left. The values of each sub-trees are the initial centroids which will use in the basic k-means clustering algorithm.
The description of the improved algorithm
The improved algorithm uses the initial centroids which come from the Huffman tree. It bases on the dissimilarity to describe the degree of correlation. The rest procedure is as the same as the basic k-means clustering algorithm. The improved algorithm is described as follow.
Algorithm 2: the improved k-means clustering algorithm
Input the dataset D with m objects, each object with d attributes, and k the number of clusters Calculate the ad, od, and get the dissimilarity matrix dm
Construct the Huffman tree according the dissimilarity matrix dm
Delete the k-1 node from the Huffman tree, left k sub-trees, get each the k sub-trees node value as the initial centroids
Repeat
Assign each object to the nearest cluster center Recompute the cluster centers of each cluster Until convergence criterion is met
consumption mainly depends on the basic k-means clustering algorithm. The mainly time complexity is O (m*k*l*d). The data size, the number of iteration and the number of attributes are the main factors in clustering. It also diminishes the iteration through the Huffman tree. So it drops the time consumption. At the same time the clustering result is stable and less depends on the initial centroids.
RESULTS AND DISCUSSION
[image:4.595.234.380.218.270.2]In order to evaluate the improved k-means clustering algorithm, the standard datasets IRIS, Wine, Balance-scale are chosen from the UCI machine learning repository. They all have 3 clusters and the number of data objects in each cluster is shown in Table 1.
Table 1: The number of data objects in each cluster
Cluster IRIS Wine Balance-scale first cluster 50 59 49 second cluster 50 71 288 third cluster 50 48 288 sum 150 178 625
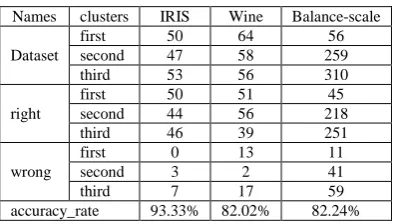
[image:4.595.208.405.341.453.2]Table 2 describes the accuracy rate which is defined in [14] of the improved algorithm in this paper. It shows that the accuracy rate is all above the value of the algorithm which is based on distance in [14] especially in the big dataset and the high-dimensional dataset.
Table 2: Accuracy rate of improved algorithm
Names clusters IRIS Wine Balance-scale Dataset
first 50 64 56 second 47 58 259 third 53 56 310 right
first 50 51 45 second 44 56 218 third 46 39 251 wrong
first 0 13 11 second 3 2 41 third 7 17 59 accuracy_rate 93.33% 82.02% 82.24%
Table 3 describe the final cluster centers which defines in [14]at IRIS dataset in each algorithm ( center1 symbols the standard, center2 symbols the basic k-means, center3 symbols the clustering algorithm using Huffman based on distance, center4 symbols the improved algorithm in this paper). As is seen from table 3, the improved algorithm in this paper is most close to the standard cluster centers. It is better than the algorithm using Huffman tree based on distance. The Wine and Balance-scale datasets also have the same results. It means the dissimilarity including the dimension contribution rate is more suitable for the big dataset with high-dimensional.
Table 3: The final cluster centers in IRIS
Clusters Center1 Center2 Center3 Center4 first cluster 5.006 3.418
1.464 0.244
5.830 3.511 1.476 0.250
5.006 3.418 1.464 0.224
5.006 3.418 1.464 0.244 second cluster 5.936 2.770
4.260 1.326
5.756 2.716 4.026 1.118
5.901 2.748 4.394 1.434
5.905 2.779 4.278 1.354 third cluster 6.588 2.970 5.552 2.026 6.315 2.895 5.125 1.803 6.850 3.073 5.742 2.071 6.628 2.927 5.635 2.051
CONCLUSION
dimension contribution rate in different fields and datasets, and how to improve the algorithm's efficiency to reduce the number of attributes d through principle component analysis based on the dimension contribution rate.
Acknowledgement
This work was supported in part by the Natural Science Foundation of Langfang Teachers University in 2013(LSZY201306).
REFERENCES
[1]Elham Karoussi, Data mining k –clustering problem, University of Agder, 2012
[2]Tan, Steinbach, Kumar, The k-means cluster, http://www.cs.uvm.edu/~xwu/kdd/Slides/ Kmeans-ICDM06.pdf, 2006
[3]J. C. Bezdek, Fuzzy Mathematics in Pattern Classification, Cornell University, Ithaca, NY. 1973 [4]Redmond S J, Heneghan C, Pattern recognition Letters, 2007, 28(8):965-973.
[5]Han Lingbo, Wang Qiang, Jiang Zhengfeng, Computer engineering and application, 2010, 46 (17): 150-152. [6]Fu Desheng, Zhou Chen, Journal of computer applications, 2011,31 (2):432-434
[7]Zhang Jing, Duan Fu, Computer engineering and design, May 2013(5): 1691-1694.
[8]B. Shanmugapriya, M. Punithavalli, International journal of computer application, April 2012(8):26-32.
[9]Wang Xiaoyang, Zhang Hongyuan, Shen Liangzhong, Chi Wanle, Computer technology and development, May 2013(23): 30-33.
[10]Huang Maida, Chen Qimai, Microcomputer information, 2009(27):187-188,198.
[11]Wu Xiaorong, Research on problems related to the initial center selection in k-means clustering algorithm, Hunan University, May 2008.
[12]UCI machine learning repository, http://archiv.ic.uci.edu/ml/.
[13]Tan P N, Steinbach M, Kumar V, Introduction to data mining, MA, USA: Addison-Wesley Longman Publishing Co., Inc. Boston, 2010.