Physics and Astronomy Dissertations Department of Physics and Astronomy
8-6-2007
Dust within the Central Regions of Seyfert
Galaxies
Rajesh Deo
Follow this and additional works at:https://scholarworks.gsu.edu/phy_astr_diss
Part of theAstrophysics and Astronomy Commons, and thePhysics Commons
This Dissertation is brought to you for free and open access by the Department of Physics and Astronomy at ScholarWorks @ Georgia State University. It has been accepted for inclusion in Physics and Astronomy Dissertations by an authorized administrator of ScholarWorks @ Georgia State University. For more information, please [email protected].
Recommended Citation
by Rajesh Deo
Under the Direction of D. Michael Crenshaw
ABSTRACT
We present a detailed study of mid-infrared spectroscopy and optical imaging
of Seyfert galaxies with the goal of understanding the properties of
astronom-ical dust around the central supermassive black hole and the accretion disk.
Specifically, we have studied Spitzer Space Telescope mid-infrared spectra of 12 Seyfert 1.8-1.9s and 58 Seyfert 1s and 2s available in the Spitzer public archive, and the nuclear dust morphology in the central 500 pc of 91 narrow
and broad-line Seyfert 1s using optical images from the Hubble Space Tele-scope. We have also developed visualization software to aid the understanding of the geometry of the central engine. Based on these studies, we conclude
that the nuclear regions of Seyfert galaxies are fueled by dusty spirals driven
by the large-scale stellar bars in the host galaxy. The accumulation of dusty
gas in the central kiloparsec leads to enhanced star formation. In this case,
the circumnuclear starburst and the central engine compete for dominance in
the heating of the circumnuclear dust. Emission from the heated dust is most
clearly seen in the mid-infrared. We find that the spectra of Seyfert 2s show
contri-of T ∼ 170 K. We also find that the mid-IR continua of Seyfert 1.8/1.9
galaxies are more like those of starburst-dominated Seyfert 2s than Seyfert
1s, contrary to expectations. We discuss the implications of these findings in
the context of the Unified Model of AGN and the secular evolution of Seyfert
nuclei.
Seyfert Galaxies
by
Rajesh Deo
A DISSERTATION
Presented in Partial Fulfillment of the Requirements for
the Degree of
Doctor of Philosophy
in the
College of Arts and Sciences
Georgia State University
Seyfert Galaxies
by
Rajesh Deo
Major Professor: Prof. D. Michael Crenshaw Committee: Prof. Douglas R. Gies
Prof. Steven B. Kraemer Prof. H. Richard Miller Prof. William H. Nelson Prof. Paul J. Wiita Electronic version approved:
This dissertation has benefited from a number of people at the Department of Physics and Astronomy at Georgia State University (GSU). First and fore-most of all, I would like to thank my dissertation adviser, Prof. D. Michael Crenshaw for accepting me to work with him, bearing my shortcomings, teaching me important lessons and believing in me in the time of my need. I sincerely admire his ability to be critical without being overbearing, to believe in simple common-sense explanation first before invoking more complicated approaches and to strip a problem down to its bare essentials. I hope I can reproduce such simplicity in my future work. I would like to greatly thank Prof. S. B. Kraemer; he generously provided us with his Spitzer data on Seyfert 1.8/1.9s and without his good criticism of my research, there would not have been the important results that I present in this dissertation.
I sincerely thank all the astronomy faculty at GSU who have instructed me. I would particularly like to thank Prof. Douglas Gies, who helped by contacting Prof. Ron Buta at the University of Alabama in regard to my questions about Hubble classification of galaxies. I would like to thank Prof. Buta for providing us access to the “De Vaucouleur’s Atlas of Galaxies” in its electronic form, as the Georgia State Library does not have a copy of the Third Revised Catalog of Galaxies. Prof. Hal McAlister kindly sent me for the Michelson Summer School during the summer of 2003 where I was introduced to the new field of optical interferometry, and I am very thankful to him for that. Prof. Paul Wiita has been a source of encouragement
to a generation of graduate students of Indian origin, and his expertise in astrophysics was the main reason I chose to come to GSU over other schools; he has been helpful in many ways since then. I would like to thank Prof. Bill Bagnuolo, for the occasional discussions about image processing algorithms and Fourier transforms. I would also like to thank our department chair, Prof. H. Richard Miller, for decreasing my lab teaching duties while I took care of the departmental cluster of Linux machines. I am greatly indebted to him, as he personally helped me in finding accommodation when I first came to Atlanta from India. I am also very grateful to Prof. Todd Henry for his excellent planetary system class.
I would like to thank the previous senior graduate students and system managers, John McFarland and Dave Berger. I would like to thank John McFarland in particular for the large number of scripts and utility tools he wrote to manage the network of Linux machines. These tools were of great help when the task of maintaining systems was given to me. I would also like to thank our department systems administrator, Duke Windsor, for letting me maintain the Astronomy cluster of Linux machines and pursuing our requests for new hardware as quickly as possible when needed. Foremost of all, I would like to thank the entire Astronomy community at GSU for bearing with my approach to systems administration.
Abstract
Acknowledgments v
List of Tables xi
List of Figures xiv
Abbreviations xv
1 Introduction to Active Galaxies 1
1.1 Active Galaxies . . . 2
1.1.1 Anatomy of an Active Nucleus . . . 3
1.1.2 Taxonomy of AGN . . . 6
1.1.3 AGNs studied in this dissertation . . . 13
1.1.4 The Unified Model of AGN . . . 18
1.1.5 Astronomical dust and its properties . . . 25
1.2 Overview of this dissertation . . . 32
1.2.1 Geometrical modeling of NLR orientation . . . 32
1.2.2 HST Imaging of Nuclear Spirals in NLS1s . . . 34
1.2.3 Spitzer Spectroscopy of Seyfert 1.8-1.9s . . . 37
2 Geometry of the Narrow-Line Region 39 2.1 Previous Studies . . . 40
2.2 The Design of the Program . . . 43
2.3 Applications of the Program . . . 47
3 HST Imaging of Nuclear Spirals in NLS1s 52 3.1 Secondary bars and nuclear spirals . . . 52
3.1.1 Secondary/Nuclear bars . . . 54
3.1.2 Nuclear Spirals . . . 56
3.2 Narrow-line Seyfert 1s and AGN fueling . . . 58
3.3 Sample Selection . . . 61
3.4 Image Analysis and Classification . . . 69
3.4.1 Nuclear Morphology Classification . . . 71
3.5 Results . . . 73
3.6 Implications . . . 78
3.7 Summary . . . 81
4 Mid-IR Spectroscopy of Seyfert Galaxies 94 4.1 Early Infrared Studies . . . 94
4.2 The Infrared Continuum . . . 96
4.3 ISO Spectroscopy . . . 98
4.3.1 IR Continua . . . 99
4.3.2 Spectral Features . . . 101
4.3.3 PAH Features . . . 101
4.3.4 Fine Structure Lines . . . 103
4.3.5 Silicate Features . . . 104
4.3.6 Molecular Features . . . 104
4.4 Ionization/Obscuration in the Mid-IR . . . 105
4.5 Diagnostic Diagrams in the Mid-IR . . . 107
5 Spitzer/IRS Instrument and Data Analysis 111 5.1 Spitzer Space Telescope . . . 111
5.3 Notes on IRS Data Reductions . . . 115
5.4 Data reduction process . . . 117
6 Mid-IR Spectra of Seyfert 1.8/1.9s 119 6.1 Spectra of Seyfert 1.8/1.9s . . . 124
6.2 Spectra of Type 1 and Type 2 Seyferts . . . 124
7 Spectral Diagnostics from Mid-IR Spectra 141 7.1 Spitzer Studies of Seyfert Galaxies . . . 141
7.2 Measurements and Data Tables . . . 144
7.3 Diagnostics with Spitzer/IRS . . . 154
7.4 Implications . . . 158
8 Conclusions 167 8.1 Orientation Geometry of the NLR . . . 167
8.2 NLS1s and Nuclear Dust Spirals . . . 169
8.3 Mid-IR spectroscopy of Seyfert 1.8/1.9s . . . 170
8.4 Future Directions . . . 174
8.4.1 Decomposition of Mid-IR Spectra . . . 174
8.4.2 Type variability of Seyfert 1.8/1.9s and NLS1s . . . 181
A Using the Seyfert Visualization Tool 182 A.1 Advanced usage . . . 183
A.2 NLR geometry of 12 Seyfert galaxies . . . 185
B Nuclear Morphology of NLS1s and BLS1s. 191
C Data Reduction Tutorial for Spitzer Spectra 221
D Archival Spitzer Spectra 226
1.1 A Simple Unification Scheme . . . 20
2.1 Visualization parameters for NGC 4151, NGC 1068 and Mrk 3 50
3.1 Nuclear Morphology and Host Galaxy Parameters. . . 63 3.2 Host Galaxy Properties of the Sample. . . 67 3.3 Frequency of Primary Nuclear Dust Structures . . . 74 3.4 Frequency of Nuclear Dust Spirals and Starburst Rings . . . . 75
5.1 Instrument Properties of the Infrared Spectrograph. . . 113
6.1 Sample of Seyfert 1.8 and 1.9 galaxies. . . 121 6.2 Spitzer Archival Datasets: Galaxy properties. . . 122 7.1 Continuum flux values (in Fλ units) from mid-IR spectra. . . . 146
7.2 Equivalent Widths of PAH and SiO Features . . . 149 7.3 Integrated PAH and Line Fluxes. . . 152
A.1 Geometrical Model Parameters for 12 Seyfert Galaxies. . . 183
B.1 The Revised Hubble Classification of Galaxies from RC3. . . . 220
1.1 Structure of an active nucleus . . . 4
1.2 The BPT Diagram . . . 10
1.3 Average quasar spectrum . . . 11
1.4 FR-I and FR-II morphology . . . 12
1.5 Example NLS1 spectrum . . . 17
1.6 Extinction Curve from Mathis (1976) . . . 29
2.1 Geometrical Model of NLR . . . 46
2.2 Program GUI and Model of NGC 4151 . . . 48
2.3 NLR Models for Mrk 3, NGC 4151 and NGC 1068 . . . 49
2.4 Extinction gradient within NLR of Mrk 3 . . . 51
3.1 Lindblad Resonances . . . 55
3.2 Nuclear Dust Spirals . . . 57
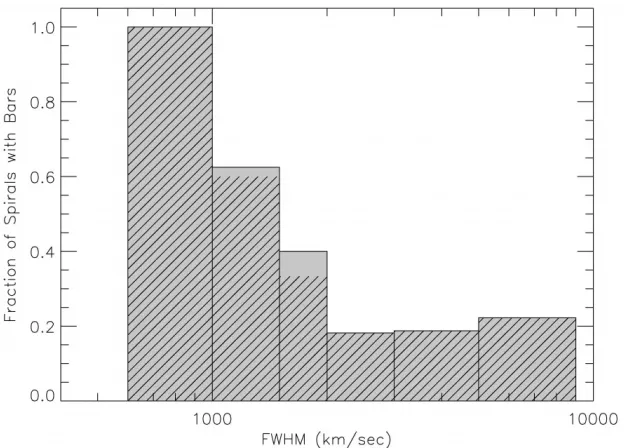
3.3 Bar fraction in Seyfert 1s as a function of FWHM of broad Hβ 60 3.4 Host Galaxy Properties of the NLS1 and BLS1 Sample . . . . 68
3.5 IC 1816: Grand-design dust spiral (GD) . . . 74
3.5 NGC 6212: Flocculent dust spiral (FL) . . . 83
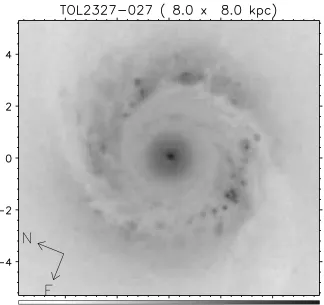
3.5 TOL 2327-027: Tightly-wound spiral (GD/TW) . . . 84
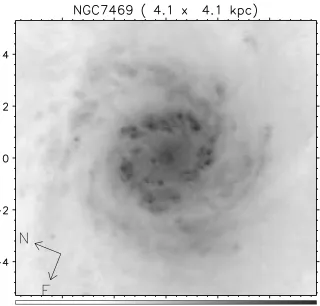
3.5 NGC 7469: Multi-arm spiral with starburst ring . . . 85
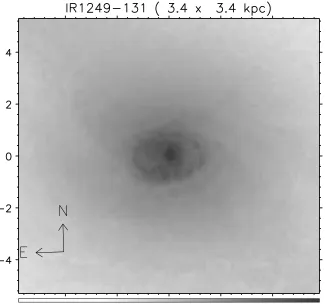
3.6 IR 1249-131: Nuclear ring (NR) . . . 86
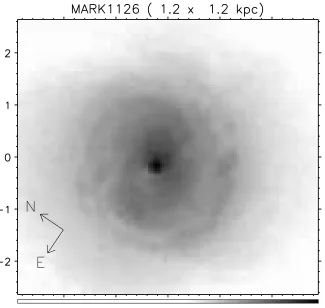
3.6 Mrk 1126: Grand design and Nuclear ring (NR) . . . 87
3.6 Mrk 915: Dust lane (DL) . . . 88
3.6 Mrk 10: No circumnuclear dust (ND) . . . 89
3.7 Primary Nuclear Dust Structures: NLS1s vs. BLS1s . . . 90
3.8 Nuclear dust spirals: NLS1s vs. BLS1s . . . 91
3.9 Primary nuclear dust structure: barred vs. unbarred spirals . . 92
3.10 Nuclear dust spirals: barredvs. unbarred spirals . . . 93
4.1 Far-IR Turnover in NGC 1068 . . . 95
4.2 ISO Spectra of Active Galaxies . . . 102
4.3 A Simple Mixing Model for AGN Fraction . . . 108
4.4 Diagnostic Diagrams from Sturm et al. (2002) . . . 109
5.1 Spitzer Space Telescope . . . 112
5.2 Spectrum on IRS Detectors . . . 114
6.1 Spitzer mid-IR spectrum of Mrk 471 . . . 125
6.1 Spitzer mid-IR spectrum of Mrk 622 . . . 126
6.1 Spitzer mid-IR spectrum of Mrk 883 . . . 127
6.1 Spitzer mid-IR spectrum of NGC 2622 . . . 128
6.1 Spitzer mid-IR spectrum of Mrk 334 . . . 129
6.1 Spitzer mid-IR spectrum of UGC 7064 . . . 130
6.1 Spitzer mid-IR spectrum of Mrk 609 . . . 131
6.1 Spitzer mid-IR spectrum of NGC 7603 . . . 132
6.1 Spitzer mid-IR spectrum of UM 146 . . . 133
6.1 Spitzer mid-IR spectrum of UGC 12138 . . . 134
6.1 Spitzer mid-IR spectrum of NGC 2639 . . . 135
6.1 Spitzer mid-IR spectrum of NGC 3786 . . . 136
6.2 Variety in Seyfert mid-IR spectra . . . 139
7.1 Plot of α6–15 µmvs. α20–30µm . . . 162
7.2 Plot of Silicate EW vs.α20–30µm . . . 163
7.3 6.2µm PAH vs. α20–30 µm plot . . . 164
7.5 Line ratios [OIV]/[NeII] vs.[NeV]/[NeII] . . . 166
8.1 Seyfert 1.8/1.9 HST WFPC2 structure maps . . . 172
8.2 Seyfert 1.8/1.9 HST WFPC2 structure maps: continued . . . . 173
8.3 Starburst template from Brandl et al. (2006). . . 175
8.4 A Seyfert 1 Mid-IR Template . . . 176
8.5 Starburst Subtraction from Seyfert 1.8/1.9 Spectra . . . 177
8.6 Starburst subtraction: continued . . . 179
8.7 Decomposition of NGC 2622 . . . 180
A.1 Screen captures for Seyfert Geometry Visualization software. . 186
A.2 NLR Orientations of 12 Seyfert Galaxies . . . 187
A.3 NLR Geometries of 12 Seyfert Galaxies: continued . . . 188
A.4 NLR Geometries of 12 Seyfert Galaxies: continued . . . 189
A.5 NLR Geometries of 12 Seyfert Galaxies: continued . . . 190
B.1 Structure Maps of Seyfert 1s from Malkan et al. (1998) . . . . 193
B.2 Structure Maps of Seyfert 1s continued. . . 194
B.3 Structure Maps of Seyfert 1s continued. . . 195
B.4 Structure Maps of Seyfert 1s continued. . . 196
B.5 Structure Maps of Seyfert 1s continued. . . 197
B.6 Structure Maps of Seyfert 1s continued. . . 198
B.7 Structure Maps of Seyfert 1s continued. . . 199
B.8 Structure Maps of Seyfert 1s continued. . . 200
B.9 Structure Maps of Seyfert 1s continued. . . 201
B.10 Structure Maps of Seyfert 1s continued. . . 202
B.11 Structure Maps of Seyfert 1s continued. . . 203
B.12 Structure Maps of Seyfert 1s continued. . . 204
B.13 Structure Maps of Seyfert 1s continued. . . 205
B.14 Structure Maps of Seyfert 1s continued. . . 206
D.1 Spitzer spectra of Seyfert 1s . . . 227
D.2 Spitzer spectra of Seyfert 1s: continued . . . 228
D.3 Spitzer spectra of Seyfert 1s: continued . . . 229
D.4 Spitzer spectra of Seyfert 2 galaxies. . . 230
D.5 Spitzer spectra of Seyfert 2 galaxies: continued . . . 231
D.6 Spitzer spectra of Seyfert 2 galaxies: continued . . . 232
D.7 Spitzer spectra of Seyfert 2 galaxies: continued . . . 233
D.8 Spitzer spectra of Seyfert 2 galaxies: continued . . . 234
D.9 Spitzer spectra of Seyfert 2 galaxies: continued . . . 235
AGN . . . Active Galactic Nuclei
BBB . . . Big Blue Bump
BCD . . . Blue Compact Dwarf
BLR . . . Broad-Line Region
BLRG . . . Broad-Line Radio Galaxy
BPT . . . Baldwin, Phillip, and Terlevich Diagram
BQS . . . Bright Quasar Survey
DISM . . . Diffuse Inter-Stellar Medium
DS . . . Dust Spiral
ENLR . . . Extended Narrow-Line Region
EP . . . Excitation Potential
EW . . . Equivalent Width
FHWM . . . Full Width at Half Maximum
FR . . . Fanaroff-Riley Class
GD . . . Grand-Design
GO . . . General Observer
GTO . . . Guaranteed Time Observer
HST . . . Hubble Space Telescope
IDL . . . Interactive Data Language
ILR . . . Intermediate Line Region
IP . . . Ionization Potential
IRAC . . . InfraRed Array Camera
IRS . . . InfraRed Spectrograph
ISM . . . Inter-Stellar Medium
ISO . . . Infrared Space Observatory
LOS . . . Line of Sight
MBH . . . Massive Black Hole
MIPS . . . Multi-band Infrared Photometer for Spitzer
NED . . . NASA Extragalactic Database
NLR . . . Narrow-Line Region
NLRG . . . Narrow-Line Radio Galaxy
NLS1 . . . Narrow-line Seyfert 1
PA . . . Position Angle
PAH . . . Poly-cyclic Aromatic Hydrocarbons
PDR . . . Photo-dissociation Region
PSF . . . .Point Spread Function
QSO . . . Quasi-Stellar Object
Quasar . . . Quasi-Stellar Radio Source
SED . . . Spectral Energy Distribution
SMART . . . Spectral Modeling, Analysis and Reduction Tool
SMBH . . . Super-Massive Black Hole
UIB . . . Unidentified Infrared Bands
VSG . . . Very Small Grain
Introduction to Active Galaxies
This dissertation deals with active galaxies and the properties of dust in their nuclear environments. Generally, most astronomers may think “why study dust?” It extincts1 and reddens the light coming from the
astronom-ical object of interest, thus making the task of interpreting the data more difficult. But dust in astronomical scenarios is indeed very useful and can be a great probe of the nebulosity. Dust in astronomical settings is in the form of minute micron-size or smaller particles as well as inorganic and or-ganic molecules. These particles effectively absorb short-wavelength (opti-cal/ultraviolet) radiation and emit that energy in the infrared band. This process makes astronomical dust particles great probes of physical conditions within the nebula. It has been known for a long time that dusty molecular clouds are the birthplaces of the future generations of stars. These stel-lar nurseries are the places where the physics of the astronomical dust has been studied the most. Mostly dust particles are thought to originate in the atmospheres of evolved red giant or supergiant stars.
In this dissertation, we shall focus on the location, geometry and physical nature of the dust in the central 500 pc of active galaxies. In particular,
1
we will look at (1) the geometry of the dust distribution with respect to the narrow-line region (NLR) and host galaxy, (2) the phenomenon of dusty nuclear spirals and nuclear stellar bars, and (3) the study of the elusive dusty torus using infrared spectroscopy. These three research themes are distinct, and I shall elaborate on their connections as we go along through this dissertation. The dissertation is divided into three parts, each one dealing with one of the three themes mentioned above.
We begin with this chapter, where I shall introduce the basic properties of active galaxies as they are known. We shall see the anatomy of an ac-tive nucleus, review the various classes of AGN and look at some historical perspectives on active galaxies. I will pay particular attention to Seyfert galaxies and describe the important results for this class of AGN from the literature. I will end this chapter with a brief description of the three main themes mentioned above. I will describe the goals of each effort and then provide a brief summary of results from these efforts.
1.1
Active Galaxies
The words “active galactic nuclei” (AGN) are used to describe the nuclear regions of active galaxies. The key word here is “active”, meaning that there are tremendous amounts of astrophysical activity going on in the nuclear regions of some galaxies. The activity includes an extremely bright (∼1042–
1047 erg s−1) point-like source of radiation, large-scale (up to 700 pc) mass
at the components of an active nucleus as based on the current body of research, and then we will look at their properties in different wavebands that lead to various classes.
1.1.1
Anatomy of an Active Nucleus
The basic model of an active nucleus is quite simple. The key component or the “engine” of the system is a supermassive black hole (SMBH) with a swirling flattened disk of matter around it. This “accretion” disk radiates strongly in all wavebands except radio. This accretion disk–black hole system is responsible for converting the incoming matter to energy. As the matter falls closer and closer to the black hole, friction and dissipative forces heat up the inflow and the resulting radiation escapes from the surfaces of the disk. The SMBH is humongous in size and mass, compared to its stellar cousins (Cygnus X-1 binary system hosts a black hole of 8.5 M⊙). It is typically as
massive as 106–109.5 M
⊙. The gas and dust from the nearby regions (a few
models are subject to a number of physical parameters, such as the viscosity of the matter, but the simplest scaling is provided by relating the actual matter accretion rate ( ˙M = dM/dt) to the Eddington rate for spherical accretion ( ˙ME).
Figure 1.1: A schematic diagram (Peterson 1997) showing the various struc-tural components in a low mass active nucleus.
1.1.2
Taxonomy of AGN
Since the pioneering work by Carl Seyfert (Seyfert 1943), a number of AGN types have been classified. Sometimes classifications differ because of the type of detection method employed to put a given galaxy into a specific class. Thus it is possible for a galaxy to be classified in more than one way and have different labels for its type. There are two main approaches used: optical spectral classification and photometric/morphological classification using radio emission from AGN. AGN are also put into different boxes based on the characteristics of their variable emission in the optical or the radio regime. A large part of the discussion here is taken from Peterson (1997), Kembhavi & Narlikar (1999) and Binney & Merrifield (1998). We will dis-cuss the following classes:
• Seyfert galaxies
• Liners
• Quasars and QSOs
• Broad-line and Narrow-line Radio Galaxies
• BL Lac Objects and Optically Violent Variables
Seyfert Galaxies
Seyfert galaxies are the most common type of intermediate luminosity (MB>
−21.5 + 5 logh0)2 active galaxies in the nearby Universe. The classification
of Seyfert galaxies is based on their optical spectra. Khachikian & Weedman (1974) divided the Seyfert nuclei into two main classes: Seyfert 1s and Seyfert 2s. Type 1 Seyferts show broad permitted emission lines arising in the BLR close to the SMBH. Type 1 Seyferts also show permitted and forbidden nar-row emission lines, which arise in the NLR much farther away from the
2
SMBH. Type 2 Seyferts only show the permitted and forbidden narrow lines; the broad component is absent in unpolarized light. In all sub-classes of Seyfert galaxies, the narrow-lines typically show widths of ∼ 500 km s−1,
much higher than emission-line width in non-AGN galaxies, while the broad-lines show widths of >
∼1000 km s−1.
Osterbrock (1981) further divided type 1 Seyferts into 1.5, 1.8 and 1.9s, based on the strength of the broad-line components in their optical spectra. In Seyfert 1.5 spectra, the broad and narrow components of the Balmer-lines can be easily distinguished, with the narrow core on top of the broad wings from the BLR. Seyfert 1.8s show weak broad wings on the permitted Hαand Hβ lines. Seyfert 1.9s on the other hand show broad wings only on the Hα
lines. The absence of broad emission lines in type 2 Seyferts indicates that the broad line emission is extincted or diminished, possibly by an intervening dust screen. Seyfert nuclei of both types tend to show strong and variable hard X-ray emission and also emit strongly in the infrared.
Morphologically, Seyfert galaxies are almost always early Hubble type (Sa, SBa, SBb) gas-rich spiral disk galaxies (Adams 1977). Seyfert 2 galax-ies tend to show more disturbed morphology than Seyfert 1s (Adams 1977; Hunt & Malkan 2004). Large-scale stellar bars induced by merger/interactions with smaller dwarf satellites have been suggested (Simkin et al. 1980) to pro-vide efficient fueling of Seyfert nuclei. Morphological surveys (De Robertis et al. 1998) do not find an excess of large-scale interactions among large Seyfert galaxies. About 1% of all spiral galaxies are Seyferts, thus making them the second most common of all active galaxies in the local Universe after LINERS.
deconvolution is needed to remove the host galaxy spectrum. Confusion due to stellar continua in spectra of Seyfert 1.8/1.9s may make them appear as Seyfert 2s; hence great caution must be taken when classifying Seyfert 2 spectra.
Another source of confusion can arise from comparison with LINER galax-ies (see the next subsection). The spectra of Seyfert 2s and Liners appear similar, but there are important differences, which if overlooked can result in misclassification. Most LINER spectra are dominated by low-ionization species such as [N II] λλ6716,6731, [S II] λλ6548,6583, [O II] λ3727 and [O I] λ6300. Further, the [O III] λ5007/Hβ ratio is much greater in Seyfert 2s than in LINER galaxies.
Another important observation is that some galaxies show strongly vari-able broad-lines in their spectra. The Seyfert type of these objects changes over a span of a few years (Tohline & Osterbrock 1976). For example, when a Seyfert 1 nucleus is in a very faint state, the broad bases on the Balmer-lines will almost disappear. If there is an additional strong stellar component in the spectrum, the spectrum will appear similar to a Seyfert 2 spectrum. However, close examination of spectra almost always shows that the broad wings never completely go away (Peterson 1997). This indicates the pres-ence of common physical properties associated with the standard model in all Seyfert 1s and Seyfert 2s. These broad-line and continuum variability properties of Seyfert galaxies have been used to great effect to study the properties of the BLR (Peterson 1993; Peterson et al. 2004).
Liners
half of all spiral galaxies. It was suggested that LINER-like activity in the nuclei of galaxies could be due to extensive star formation and ionization of gas due to O-B associations. Baldwin et al. (1981) showed that it is possible to separate HII region galaxies, planetary nebulae, and nuclei photo-ionized by a featureless continuum, based on intensity ratios of two pairs of lines. The ratio of line intensities for a pair of nearby lines is sensitive to the shape of the ionizing continuum and thus can be used a diagnostic of whether the photo-ionization is due to a collection of blackbodies or a power-law ionizing spectrum. Veilleux & Osterbrock (1987) applied this method while choosing pairs of lines close to each other in wavelength, thus reducing the effects of reddening. This “Baldwin, Phillips, and Terlevich (BPT)” diagram is shown in Figure 1.2.
In the optical, it is possible to distinguish Liners from Seyfert 2s by their low values of [O III] λ5007/Hβ relative to [N II]λ6583/Hα, while they have larger values of [N II]λ6583/Hαthan most HII region galaxies. Furthermore, the presence of strong [O I] λ6300 is considered an indication that the photo-ionization in LINER nuclei occurs due to a flat power-law spectrum.
In a large survey, Ho (1996) showed that Liners are extremely common in the present epoch, comprising approximately 1/3 of all galaxies with BT ≤
12.5 mag. He suggests that if most Liners are non-stellar in origin then they are the dominant constituents of the AGN population. He also showed that a substantial fraction of Liners contain BLRs, yielding direct evidence, at least in these objects, of a physical link between Liners and classical Seyfert 1 nuclei and QSOs.
Quasars/QSOs
Figure 1.2: The BPT diagram from Veilleux & Osterbrock (1987), the sym-bols are filled circles: Seyferts, filled squares: NLRGs, filled triangles: Liners, asterisks: NELGs, open circles: HII regions, open circle with dot: nuclear HII region, open triangle: starburst galaxy, open square: HII galaxy. The dashed lines shows HII region photo-ionization models, and the solid line separates AGNs from HII regions.
Figure 1.3: Average quasar spectrum from Peterson (1997, Fig 2.2)
Advances in radio interferometry in early 1970s led to sub-arcsec reso-lution, enabling detailed maps of radio emission to be made. This allowed classification of the radio morphology of quasars and radio galaxies. The mor-phology is often described broadly in terms of two components, ‘extended’ (i.e., spatially resolved) and ‘compact’ (i.e., unresolved at∼1′′). Sometimes,
the terms ‘lobe-dominated’ and ‘core-dominated’ are used. The defining char-acteristic of a quasar/QSO is its broad spectral energy distribution (SED). In the radio, the SED is crudely described in terms of a power-law, often writ-ten as Fν ∝ν−α. Lobe-dominated sources tend to show steep radio spectra,
Figure 1.4: Fanaroff-Riley Classes: FR I – 3C 272, FR II – 3C 47; Source:
http://www.jb.man.ac.uk/atlas/dragns.html
The more luminous class II (FR II) sources are limb-brightened (i.e., lobe-dominated) at the edges of the radio structures. All radio-loud quasars are FR II sources. Examples of these two classes are shown in Figure 1.4. A radio luminosity division between these classes is given by Bridle & Perley (1984) at Lν(1.4GHz) = 1032 erg s−1 Hz−1.
Broad-Line and Narrow-Line Radio Galaxies
Apart from the presence of strong radio emission in quasars, there are two types of strong radio galaxies which show spectra similar to those of Seyfert galaxies. These are called broad-line radio galaxies (BLRGs) and narrow-line radio galaxies (NLRGs). They are the ‘radio-loud’ counterparts of Seyfert 1s and Seyfert 2s, respectively. One important difference from ‘radio-quiet’ Seyferts is that they tend to occur in elliptical galaxies rather than spirals.
Blazars: BL Lac Objects and OVVs
All AGN show continuum variability from X-ray to radio wavelengths, but some show extreme continuum variability. BL Lacertae is the prototype of such extreme variability behavior. BL Lac was first discovered as an extremely variable “star” in optical photometric monitoring. The typical changes are ∆m >
are termed “Blazars”, which are divided into BL Lac objects and Optically Violent Variables (OVVs). All known blazars are radio sources and tend to have high polarizations that vary both in magnitude and position. Urry et al. (1991) showed that BL Lacs are relativistically beamed FR I sources and the OVVs are beamed FR II sources.
1.1.3
AGNs studied in this dissertation
Having seen the varied classes of AGN in the last section, we will focus on the properties of two special categories of Seyfert galaxies: the Seyfert 1.8/1.9s and the narrow-line Seyfert 1s (NLS1s).
Seyfert 1.8/1.9s
In § 1.1.2, we saw that Osterbrock (1981) broke the Seyfert 1 class into sub-classes 1.2, 1.5, 1.8 and 1.9. This sub-classification of Seyfert 1s is based on the strength of the narrow-components of the Balmer permitted lines as compared to the strength of the broad-components. As we progress from type 1 to 1.5 the narrow-component becomes more and more clearly separated from the broad wings. Seyfert 1.8s show weak broad wings on the permitted Hα and Hβ lines, while Seyfert 1.9s show broad wings only on the Hα lines. Osterbrock in his original 1981 paper proposed that the BLRs in these systems suffer strong extinction due to dust, which leads to steep Balmer decrements 3 in these systems. Goodrich & Osterbrock (1983) studied Mrk 704 and Mrk 1066, and suggested that the BLR might be seen edge-on in these objects. Osterbrock & Dahari (1983) expanded the sample of Seyfert 1.8/1.9s with further identifications. Lawrence & Elvis (1982) studied the soft and hard X-ray emission from different classes of Seyferts to understand if there is a continuum of Seyfert types and suggested that obscuration of
3
the BLR plays a big role. They found that X-ray selected Seyfert galax-ies were more edge-on than optically selected Seyfert galaxgalax-ies from Keel (1980). They also suggested that more attention should be paid to spec-troscopic classifications of Seyfert galaxies with weak broad Hα. To test the obscuration hypothesis of Lawrence & Elvis (1982), Rudy & Willner (1983) measured the Paschen-α line for a Seyfert 1.9 galaxy V Zwicky 317 in the near-IR and determined that the line was too weak to suffer the modest ex-tinctions (E(B −V) ≈ 1) derived from the Hα/Hβ ratio. They suggested radiative transfer effects in the BLR as an alternative and that the BLR in Seyfert 1.8/1.9s may have lower densities, temperatures and optical depths than those of Seyfert 1s, hence hypothesizing that the BLRs in these systems can be strong Lyα emitters. Further efforts by Rudy, Cohen and collabo-rators (Rudy et al. 1985, 1988), revealed a few intermediate Seyfert galaxies that could be explained by these radiation transfer effects. However, they also noticed intermediate Seyferts which could be explained by reddening alone, thus leaving this issue unresolved. Early infrared photometry (e.g.,
Rudy & Rodriguez-Espinosa 1985) of Seyfert 1.8/1.9s revealed the presence of a strong contribution from starlight and weaker overall infrared contribu-tion due to the non-stellar core as compared to Seyfert 1s.
Further, in a literature compilation of Balmer decrements, [O III] strengths, infrared fluxes and polarizations, Rudy (1984) suggested that dust in the NLR plays a major role in the infrared emission at 10 µm. This was based on a correlation betweenL(10 µm)/L(Hα)vs. [OIII]/Hβ. He also notes that the sample used is biased against edge-on galaxies as in Keel (1980), thus the observed variations in parameters he compiled must be due to dust close to the active nucleus. A further study of host galaxy axial ratio (b/a) and Balmer decrement from narrow and broad components by de Zotti & Gaskell (1985) highlighted the importance of extinction due to the host disk.
spectropolarime-try of Seyfert 1.8/1.9s and the broad-line variability in NGC 2622, NGC 7603, and Mrk 1018. Goodrich concluded that the variations in the broad lines were due to changes in the line of sight optical depth of the obscuring dust. Goodrich (1990) further tried to distinguish between competing theories men-tioned above to explain the weak broad lines in Seyfert 1.8/1.9s by using Pa−α measurements. However he concluded that while some are consistent with dust reddening, others are consistent with the optical-depth/ionization-parameter explanation (Rudy & Willner 1983). Quillen et al. (2000) reported 1.6 µm variability timescales of a few hours to a few weeks in Seyfert 1.5-2 systems and suggested that the variability of near-infrared continuum at 1.6µm in Seyfert 1.8/1.9s implied dust sublimation radii of∼1 pc (Barvainis 1987).
Goodrich (1995) presented a spectral survey of Seyfert 1.8/1.9 galaxies and compared the spectra with previous studies of emission-line variability. He concluded that NGC 7603, Mrk 993, and Mrk 1018 show variability con-sistent with changes in the reddening to the BLR. However, Goodrich notes that NGC 2622 (Mrk 1218), which showed variability consistent with red-dening changes in earlier studies, has declined in brightness, but has done so in a manner inconsistent with a simple change in reddening. He also notes that the variability in Mrk 883 and UGC 7064 is inconsistent with reddening changes, and may to due to real changes in the ionizing flux in the BLR.
from the accretion disk.
Narrow-Line Seyfert 1s
Another sub-class of Seyfert 1s that we study in this dissertation is narrow-line Seyfert 1s (NLS1s). This sub-classification is based on the following optical spectral properties:
• The narrow permitted lines are only slightly broader than the forbidden lines from the NLR;
• The [OIII]/Hβ ratio is generally smaller than 3;
• Fe II emission complexes, expected to come from a high-density region, are observed, in contrast with Seyfert 2s;
• However, full width at half maximum (FWHM) of Hβ is less than 2000 km s−1, in contrast to broad-line Seyfert 1s;
The first three of these criteria were defined in Osterbrock & Pogge (1985), while the last criterion is due to Goodrich (1989b). The presence of an un-obscured high-density region, in particular, places these AGN firmly in the Seyfert 1 category.
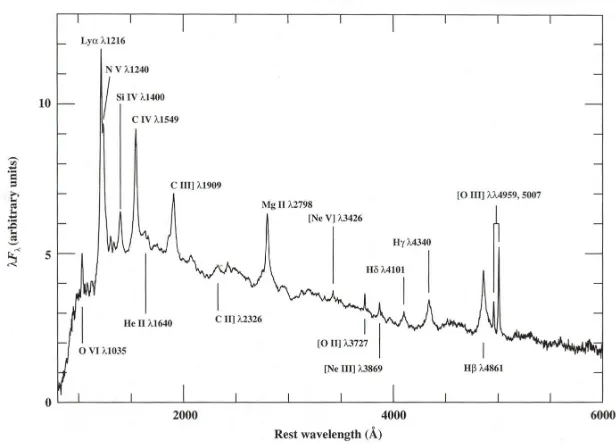
The NLS1s were first recognized by Osterbrock & Dahari (1983) as pe-culiar objects due to their very narrow Balmer lines like some Seyfert 2s and their strong Fe II emission blends like broad-line Seyfert 1s (BLS1). An ex-ample of the optical spectrum of an NLS1 (Mrk 42) is shown in Figure 1.5. As can be noted in the figure, the Hβ line is narrow, but stronger than [O III]. The Fe II blends are notable in the NLS1 spectra. The weakness of the Fe II blends and the weak broad bases are a source of confusion in low S/N optical spectral classification of Seyfert 1s.
Figure 1.5: Example Seyfert Spectra from Pogge (2000): NLS1 (Mrk 42), Seyfert 1 (NGC 3516), Seyfert 2 (Mrk 1066)
that ∼50% of the soft-X-ray selected AGN from the ROSAT All Sky Survey are NLS1s. A further study by Boller et al. (1996) confirmed that NLS1s are strong soft X-ray emitters and are highly variable in the soft X-ray regime. The X-ray photon index4 (Γ) for NLS1s is ∼ 2.19 whereas most Seyfert 1s
show a value of∼1.73. Boller et al. (1996) suggested that NLS1 nuclei could be analogous to strong-soft states of galactic black holes (Pounds et al. 1995). They also suggested that NLS1s nuclei may be viewed mostly pole-on, or they could have smaller black hole masses and/or more distant BLRs that could lead to the narrow-permitted lines observed. Mason et al. (1996) studied NLS1 RE-J1034+396 and noted that the narrow (FWHM ∼ 1000 km s−1)
Hβ has a weak broad component (FWHM ∼ 2500 km s−1) and suggested
that the observed narrow permitted lines may arise from an intermediate
4
region between the BLR and the NLR. The signature of the BLR in NLS1 systems could remain hidden due to low S/N spectra and/or host galaxy contamination.
The strong interest in researching NLS1s is driven in part by the need to find the physical driver for the existence of the Boroson-Green eigenvec-tor 1 (Boroson & Green 1992) for AGN, which was derived using principal component analysis (PCA). The eigenvector is a result of the anti-correlation between line strengths of Fe II and [O III], and the correlation between the FWHM of Hβ and the peak of [O III]. The PCA analysis confirms that strong Fe II, weak [O III] and narrow Hβ lines are the defining characteristics of the NLS1 class. Mathur (2000) proposed that the high accretion rates estimated for NLS1s (Pounds et al. 1995) could be due to smaller black hole masses in NLS1s. An alternative to this picture is proposed by Murayama et al. (2001), where the BLR is flattened in NLS1s and is viewed preferentially pole-on, leading to enhanced soft X-ray variability due to beaming and narrow Hβ
components.
Thus, we see that NLS1s offer many puzzles about the nature of AGN. If these are indeed young AGN with high accretion rates, perhaps the host galaxy environment of NLS1s may be conductive to formation and growth of SMBHs. This is the topic researched in Chapter 3 of this dissertation.
1.1.4
The Unified Model of AGN
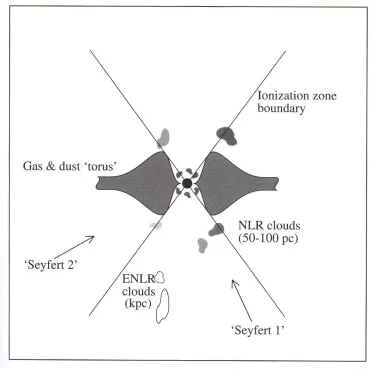
will be a few basic parameters that govern the nature and appearance of all AGN. Two such parameters recognized are the bolometric luminosity of the AGN and the orientation of the line-of-sight (LOS) of the observer to the symmetry axis of the AGN. It is recognized that AGN appear to have axial rather than spherical symmetry and the inclination angle at which we look at the system govern the observed properties of the system to a certain degree. There is also strong evidence that basic physical properties of an active nu-cleus, such as the mass of the central SMBH and the matter accretion rate, governs the emergent continuum spectrum and related properties. Thus it is likely that a pragmatic ‘unified model’ will incorporate real physical diversity through changes in a few basic parameters coupled with observer-dependent parameters such as orientation, resolution and perhaps other limitations of the observing process. On the size scale of the NLR (tens to hundreds of parsecs), there is clear evidence for an axial symmetry, in the form of bi-conical NLR outflow. However there is considerable uncertainty about the geometry of the dusty obscuration in the equatorial plane at the apex of the NLR outflows. In this dissertation, we are mainly concerned with estimation of constraints on this dusty geometry.
Simple Unification
Table 1.1: A Simple Unification Scheme Radio Orientation
Properties Face-On Edge-On Radio Quiet Seyfert 1s Seyfert 2s
QSO 1s QSO 2s/ULIRGs ? Radio Loud BL Lac FR I
BLRG NLRG OVV FR II
the orientation of the obscuring torus (or for that matter the orientation of the radio jet) to the LOS. This simple scheme shown in Peterson (1997) is presented in Table 1.1 (see also Figure 1.1).
Optical spectroscopy shows that observationally there are two main types of Seyfert galaxies. Due to the relatively similar nature of narrow line profiles in both type of Seyferts, and the variability of broad-lines in some Seyfert 1s, it was expected that the lack of broad-lines in Seyfert 2s is due to dust attenuation along the LOS to the central source in Seyfert 2s. The problems with this concept are: (1) the featureless continuum in Seyfert 2s is still more or less a power-law, which it should not be if the power-law continuum from the central source is heavily reddened; (2) Seyfert 2 galaxies are only about one magnitude fainter than Seyfert 1 galaxies, implying that the continua in Seyfert 2s are only a magnitude fainter or so than in Seyfert 1s, but the broad emission lines are completely extinguished. Even in Seyfert 1.8/1.9s, whose spectra appear like those of Seyfert 2s and show variability in their broad-line fluxes, use of high signal-to-noise spectra and careful subtraction of the host galaxy spectrum show that the broad bases on permitted emission lines never completely vanish. This implies that Seyfert 2s may not just be Seyfert 1s in faint states.
nearby type 2 Seyferts like NGC 1068 (Antonucci & Miller 1985) showed that the broad emission lines can be observed using polarized light from the source. The polarization is assumed to be due to a scattering region filled with high energy electrons above the torus. This important discovery was used to put forth the torus hypothesis, hinting at the fact that there is underlying uniformity to the central engine of an AGN and any observed changes are the effect of looking at the central engine from different lines of sight. This scattering region is the key component of the torus model, without which the continuum in Seyfert 2s will not appear like a power-law. This basic idea lead to the formation of the Unified Model of AGN (Antonucci 1993). The model posits that the dichotomy for each class of AGN is a result of strong obscuration by dust in the equatorial plane. Specifically, the dust is arranged in a torus-like structure around the central engine and shields the BLR for lines of sight close to the equatorial plane of the system. The viewing angle to the BLR and the central source, defines the optical spectral type of the AGN being observed. In this framework (see Figure 1.1), Seyfert 1s are observed mostly pole-on, thus allowing “seeing of the BLR”, while Seyfert 2s are observed mostly edge-on, thus allowing us to view only the NLR.
In NGC 1068, the continuum polarization is∼16% after removal of sig-nificant starlight contribution to the spectrum. This polarization can occur via scattering, either due to dust or due to free electrons. Code et al. (1993) showed that the continuum polarization in NGC 1068 stayed constant at
to ask whether this behavior is present in all Seyfert 2s and whether or not all of them host an obscured BLR.
Tests of Unification
It should be possible to test for various concepts (or parameters) of unification in a robust way using large samples of AGN, if and only if, all the AGN are derived from the same parent population. Since the radiation from AGN is strongly anisotropic, it is clear that orientation plays a role. In a true parent population of AGN, these orientations will be truly random. There are a couple of general ways in which one may build such tests:
• We can count the total number of each type of AGN in a volume-limited sample. The properties of the dominant type will then highlight the properties of the parent population and hint towards properties that lead to unification. A problem with this approach is defining the volume that samples the parent population properly and avoiding selection effects.
• Another approach is to use a property that is, due to its physical na-ture, independent of observer’s orientation with respect to the central source. Various possibilities include: extended radio emission, hard X-ray emission, far-infrared emission of host galaxies and emission from the NLR. Each of this approaches have their difficulties, but probably the most promising ones are hard X-ray observations and emission from the NLR.
• Yet another approach is to compare the total infrared luminosity from the central source to its total hard X-ray luminosity (see, Lutz et al. 2004, for a recent attempt), since the total IR luminosity of the torus should be equal to the total high-energy luminosity that it intercepts. Recent studies with Spitzer (Buchanan et al. 2006) have shown that the emission due to the torus is anisotropic until about ≈ 20µm, but this result may be subject to other selection effects such as presence of dominant circumnuclear star formation within the galaxy sample.
Over the last two decades a number of tests have been done using such ideas. It is generally agreed that there are two main types of AGN, the radio-quiet (Seyfert 2s, Seyfert 1s and QSOs) and the radio-loud (FR Is, BL Lacs, FR IIs and Quasars). Within these two classes, the arguments in favor of Seyfert Unification are:
• Some Seyfert 2s can be shown observationally to be obscured Seyfert 1s, via spectropolarimetry (Antonucci 1993).
On the other hand, there is also some evidence against it:
• The continua of Seyfert 2 galaxies are in generalnotpolarized (Cohen et al. 2000) and the polarization seems to be concentrated within the NLR knots (e.g., see Kishimoto et al. 2002).
• Miller & Goodrich (1990) showed that for a torus opening angle of 30o, and for NLR bicones lying in the plane of sky, continuum
po-larizations should reach 50% in edge-on tori. However this is clearly not seen; the maximum polarization noted in NGC 1068 is about 16% (Antonucci & Miller 1985).
not observable in hard X-rays with Chandra (i.e., they are Compton-thick) provides strong support for unification models of radio-quiet AGN. However the properties of these postulated radio-quiet QSO 2s sources are not clear. For example, recent mid-IR spectra of some QSO 2s (Sturm et al. 2006) actually appear similar to spectra of type 1 PG quasars in the 5−12µm range. Further, there are several speculative possibilities such as the obscuring tori are more flattened and/or they ‘recede’, in high-luminosity sources, because of the more intense radi-ation field that destroys dust close to the central source. The Spitzer
spectra at least appear to have ruled out the possibility that these ob-scured sources are ULIRGs as they do not show evidence for silicate or ice absorption features commonly seen in ULIRG sources.
The radio-loud objects are primarily composed of two components, a steep-spectrum extended source (radio lobes) and a highly beamed flat-spectrum core. In VLBI measurements, the flat-flat-spectrum cores get resolved into linear jet-like structures which are, for the most part, one-sided due to relativistic beaming effects. Observations of radio-loud sources and their description via this simple two-component idea are contradictory and need unification via orientation effects to explain them.
Thus overall, some basic connections between certain broad classes of AGN have been made:
• The primary difference between a Seyfert nucleus and a quasar nucleus is the luminosity of the central source.
• There is dust obscuration in the equatorial region of AGN and this is most convincingly shown in case of Seyfert 1s and Seyfert 2s, suggesting that Seyfert 2s harbor hidden Seyfert 1 nuclei. A similar situation is possible for NLRGs and BLRGs.
• Blazars are radio-loud AGNs in which our line of sight is close to the radio jet, leading to relativistic beaming effects.
Apart from these ideas, the study of other basic parameters such as the radio power, the mass of the SMBH and the relative accretion rate will provide directions to a common unified model for all AGN. It is however amply clear that two types of effects dominate the observed properties; (1) the intrinsic physical properties of the source and (2) orientation of the observer’s line of sight.
1.1.5
Astronomical dust and its properties
In this section we take a bit of a diversion and look at the basic properties of astronomical dust. This is essential, as further ahead we will work with the fundamental quantities we define here.
out of their envelopes. Dust particles condense out of this gas as it travels farther away from the surface of the star. The realization by Trumpler in the 1920s that dust prevents a clear view of our Galaxy was one of the great milestones in astronomy. The key to his realization was the fact that dust not only scatters visible radiation, but it absorbs radiation with wavelengths smaller than the size of the dust particles and in the process gets heated and re-emits this energy as infrared radiation. The scattering of light by dust particles is evident in reflection nebulae, where the spectrum of the reflection nebulae actually shows features in the spectrum of the star illuminating the nebula.
Dust grains are effective absorbers of photons whose wavelengths are com-parable to, or smaller than, the size of the dust grains. Dust grains are typ-ically larger than about 100 nm. Due to this, dust effectively absorbs UV radiation. Most of the energy emitted by hot stars is in the optical and UV region, and hence effectively heats the dust grains. Moreover, the massive young stars born in star forming regions burn their fuel quickly and barely come out of their dusty cocoons. The overall effect of these processes is that dust absorbs most of the stellar radiation, converting it to infrared. This process makes most galaxies strong emitters in the far-IR. The absorption of ambient star light warms the dust grains to about ∼ 10 K in the diffuse ISM.
Extinction and Reddening
The scattering and absorption processes dim the light from distant stars. This dimming is termed ‘extinction’. The extinction (AX) in some waveband
X is given as:
AX =m(X)−m0(X) (1.1)
where, m(X) is the observed magnitude with extinction and m0(X) is the
The ‘reddening’ or color excess,E(X−Y) in some colorX−Y is defined to be the difference between the observed colorm(X)−m(Y) and the intrinsic color m0(X)−m0(Y), thus:
E(X−Y) = [m(X)−m(Y)]−[m0(X)−m0(Y)] =AX −AY (1.2)
Since color is generally defined such that shorter wavelengths are on the left and the strength of the interstellar extinction generally decreases from short to long wavelengths,E(X−Y) will be a positive number. The most common type of extinction cited isAV and the most common type of reddening cited is E(B−V). It is customary to convertAλ toAV for a givenλwhen reporting
extinction values.
If the distance to a star is known independently, it is possible to obtain
AX by estimating the absolute magnitude of the star from its MK spectral
class, by using the formula for distance modulus.
mX −MX =AX + 5 logd−5 (1.3)
Thus, measurements of stars of known MK class, and therefore, known in-trinsic colors in two wavebands, yields E(B−V).
The Extinction Curve
The amount of extinction and reddening depends on the column density of dust along the line of sight and it is very different for different lines of sight. The naive assumption that the dust particles are the same in all regions, though not entirely correct in realistic situations, is a good first start. If we assume that the type of the dust particle is the same in the regions of interest, then the ratio of the extinctions at any two wavelengths is the same for any lines of sight to that region. The variation of this ratio for a given line of sight over the wavelength region of interest is called the extinction curve.
The extinction curve peaks in the UV and falls off to both infrared and X-ray regimes. The curve shows three bumps or features, one at 217 nm, and other two at 9.7µm and 18µm. The feature at 217 nm in the UV is possibly due to tiny graphite grains of the size of ∼50 atoms. The latter features are due to Si–O bonds in silicate grains. In the optical, the extinction curve does not rise as sharply as it does in the UV. This is attributed to the presence of very small dust grains along lines of sight giving rise to the extinction curve in the UV. The slope of the extinction curve is quantified by the parameter:
RV = AV AB−AV
= AV
E(B−V) (1.4)
For a steeply rising curve,RV ≃3, and RV ≃5 for a slowly-rising curve.
For the Galaxy, classical studies of extinction derived RV ≃ 3.1. However,
it is very likely that RV is very different for different lines of sight. In AGN
environments, typically RV ∼> 3.1 and the extinction curve rises sharply in
the UV, indicating presence of very small grains (Savage & Mathis 1979).
Radiation by Dust
struc-Figure 1.6: Extinction Curve from Mathis (1990), as plotted in Binney & Merrifield (1998, Fig 3.17), the solid curve shows the expected form for lines of sight that pass through the diffuse ISM, while the dashed line shows a line of sight through a thick molecular cloud.
tures. Very good examples of such environments are reflection nebulae, the diffuse interstellar medium (DISM) and dust within AGN. The key to under-standing dust re-radiation is Kirchhoff’s law. Kirchhoff’s law states that if a body of temperature T absorbs a fraction Qν of the radiation of frequency ν, then the emissivity at its surface is QνBν(T), where Bν(T) is the Planck
function. In the context of a radiative transfer framework, this leads to:
where τν is the optical depth at frequency ν, Ka(ν) is the absorption
cross-section of the dust grains and Ks is the emission cross-section due to
scat-tering in a specified direction. The extinction at frequency ν is then given as,
Aν =−2.5 log10
Iν(τν) Iν(0)
= 1.086(1 +Ks/Ka)τν (1.6)
This simple relationship between Aν and τν leads to the use of τV as an
effective measure of amount of extinction involved. However, the actual extinction AV may not be related as simply to the actual optical depth due
to the contribution from scattering. Alternatively, E(B −V) = AV/RV is
often used.
The above relation holds for dust which does not emit significantly at a given ν. This will be the case in the visual band for cold dust at T ∼10 K. In the case when dust emits strongly at the frequency of interest (e.g., in the infrared), the extinction estimated from measurements of τν will be greater.
The Dust-to-Gas Ratio
Bohlin et al. (1978) showed empirically that the column density of Hydrogen
N(Htot), in all its forms (atomic or molecular), is linearly related to the line
of sight reddening, E(B−V).
N(Htot) = 5.8×1025E(B−V) m−2 mag−1 (1.7)
N(Htot) = 1.9×1025AV m−2 mag−1, forRV ≃3.1 (1.8)
Based on IUE spectra, Shull & van Steenberg (1985) updated the value of
N(HI) to 5.1×1025E(B−V) m−2 mag−1. To the first approximation then,
this implies that a given mass of gas contains a characteristic mass of dust, independent of whether it is molecular or atomic. Thus the value of E(B−
Dust Grain Sizes and PAH
Extinction is caused by a combination of absorption and scattering of radia-tion by dust. The fracradia-tion of extincradia-tion which is caused by the scattering is called albedo. Dust grains do not scatter radiation isotropically and small-angle forward scattering dominates. In the B-band the albedo is expected to be ∼0.6. Grains much smaller than 500 nm do not scatter light as much and tend to do it isotropically. Grains that are a fraction of a micron in size radiate fairly efficiently and tend to stay at a temperature of aboutT ≃20 K in the diffuse ISM. This emission peaks in the submm-regime near 150 µm, as is evident in many galaxies that have a peak in their SED in this region.
IRAS observed the infrared sky in four bands centered on 12µm, 25µm, 60 µm, and 100 µm. IRAS made the important observation that even in the mid-infrared band at 12µm and 25 µm, there was considerable emission from diffuse interstellar dust. This observation led to radical changes in the models of interstellar dust grains. It is now accepted that the interstellar medium (ISM) includes extremely small grains, containing <
∼100 atoms, in
addition to ‘classical’ dust grains,∼0.1µm in size and containing >
∼10,000
(Leger & Puget 1984). These molecules are considered to be linked benzene rings to which other species of atoms have attached themselves, forming a variety of configurations.
A detailed analysis of the diffuse interstellar emission has been done by Draine & Li (2001) and Li & Draine (2001). The most recent models of interstellar dust (Draine & Li 2007) have a combination of silicate, graphite and PAH grains.
1.2
Overview of this dissertation
We will now look at the three main themes of this dissertation: (1) Geomet-rical modeling of NLR orientations with respect to their dusty host-galaxy disks; (2) HST/WFPC2 optical imaging of dusty nuclear spirals in Seyfert galaxies; (3) Spitzer/IRS mid-infrared spectroscopy of Seyfert galaxies. The motivations of these research themes, and the ensuing main results are cov-ered in this section, as an early overview of the complete dissertation. Each part is further described in detail in individual chapters ahead. The major aspect of this dissertation is understanding the nature of dust obscuration in Seyfert galaxies. Since it is readily evident that dust plays an important role in how we see type 1 and type 2 sources, a detailed understanding of properties of nuclear dust distributions is necessary.
1.2.1
Geometrical modeling of NLR orientation
The first project was to use the Interactive Data Language5 (IDL) to build
a program that can simulate the geometry of the NLR outflows with respect to the host galaxy disk.
The motivation for the development of this software tool was the results presented by Clarke et al. (1998). Clarke et al. had developed a statistical
5
approach to estimating the angle between the axis of the radio jet and the normal to the host galaxy plane. Naively one might expect that the central accretion disk, the radio outflow/jet, and the host galaxy disk share the same axis of symmetry, and are aligned preferentially in the same direction. Further, the Unified model suggests that the dichotomy between type 1 and type 2 sources is dependent on the inclination angle the line of sight of the observer makes with the direction of the radio jet. Smaller angles lead to type 1 like properties, while larger angles lead to type 2 like properties.
Our software simulates the geometrical system with constraints as de-fined in Clarke et al. (1998). The tool is interactive, so that a user can view the model as projected on the sky and then freely move the model in three dimensions to visualize the geometry. The important differentiator in our efforts here are that we are using the symmetry axis of the NLR outflow instead of the symmetry axis of the radio jet. The NLR outflows are much more prominent in Seyfert galaxies than are radio jets. It is more probable that the opening angle of the biconical NLR outflow is constrained by the opening angle of the torus, as the torus encircles the central source. Thus, measuring the opening angle of the NLR outflow in a number of Seyfert galaxies will allow us to understand the interaction between the NLR out-flows and their host galaxies. Furthermore, we can actually determine the inclination angle of the NLR bicones from the outflow kinematics, thereby fully constraining the geometry of an individual source. A result of these efforts to model the geometry of 12 Seyfert NLR outflows was reported in Deo & Crenshaw (2003) where we used kinematic model constraints from J. Ruiz’s thesis (CUA) on slitless spectroscopy of NLRs in Seyferts. Das et al. (2005, 2006) further improved the kinematical method with high resolution long slit data for NGC 4151 and NGC 1068 and have used this program to model the NLR and the host disk geometry. We have also used this program to investigate the reddening of the NLR by a dusty disk in the plane of the host galaxy, as we will show later (see also Collins et al. 2005).
1.2.2
HST Imaging of Nuclear Spirals in NLS1s
The main motivation for this study is the phenomenon of narrow-line Seyfert 1s. These Seyfert galaxies are classified as type 1 Seyferts with the FWHM of broad Hβ line >
∼500 km s−1 but ∼< 2000 km s−1. It has
we seek to answer is, does the host morphology of narrow-line Seyfert galax-ies show any peculiarity suggestive of putative smaller black hole masses and higher Eddington ratios? (Simkin et al. 1980) suggested that merger-induced formation of large-scale stellar bars can fuel large amounts of gas and dust to the central regions of Seyfert galaxies. Crenshaw et al. (2003a) noted that the hosts of 19 NLS1s from a sample of Seyfert 1s by Malkan et al. (1998) and the HST archive showed a higher frequency of large-scale (> 1 kpc) stellar bars than that found in broad-line Seyfert 1s (BLS1s), suggesting that efficient fueling due to bars was plausible. We have used the sample from Crenshaw et al. (2003a) and have now studied the morphology of the nuclear regions (∼ 500 pc) of these HST images. The images are mostly optical WFPC/2 images in the wide band filter F606W, although some of the images are taken with the F547M filter. We reduced, calibrated and per-formed cosmic-ray rejection on the raw images. The resulting images were studied and classified according to the morphological type of the host galaxy. We used a technique called ‘structure mapping’ (Pogge & Martini 2002) to enhance the dusty structures in the image and then classified the nuclear morphology.
of the spirals support this picture.
We saw in the last section that the accretion disks of Seyfert galaxies are not necessarily aligned with the host galaxy disks as suggested by the orientation of the weak radio jets. This misalignment can be caused by a number of theoretical effects related to the structure of the accretion disk, the spin of the SMBH and the pattern of inflow of matter to the accretion disk. Suggestions that the NLR outflow is controlled by the dust obscuration in the central parts of a Seyfert galaxy imply that it is plausible that the pattern of inflow can affect the geometry of the NLR and hence classification of Seyfert galaxies into type 1s and type 2s. The presence of different nuclear dust morphologies in type 1 objects indicates that there could be an evolutionary scenario that converts a NLS1 to a BLS1. It is seen from our study and those of Martini et al. (2003b) that grand-design spirals tend to occur in barred galaxies, while tightly-wound multi-arm structures occur in galaxies without bars. From our study we find that BLS1s tend to show the tightly-wound type of nuclear spirals. One way for a NLS1 to convert to a BLS1 is to grow the stellar bulge of the galaxy along with the black hole mass. This would then lead to the dissolution of the large-scale bar, thus allowing the two-armed spiral in the central region of the NLS1 to wind more, finally producing a tightly-wound multi-arm structure.
The important point of this study is that the nuclear regions of Seyfert galaxies, whether Seyfert 1s or Seyfert 2s, host a large amount of gas and dust. In the case of high Eddington ratio systems like NLS1s, the inflow is clearly driven by the large-scale bars. The presence of such large quantities of dusty gas also provides the necessary material that can form the dusty obscuration in the very inner region ( <
∼10 pc) of the nucleus. The position angle of the
but it is possible that in the presence of a large enough concentration of matter or a external driving force like a stellar bar, they will affect the orientation of the active nucleus.
1.2.3
Spitzer Spectroscopy of Seyfert 1.8-1.9s
After the imaging project, I worked on the mid-infrared spectra of Seyfert 1.8/1.9 galaxies from Spitzer Space Telescope observations (S. Kraemer, PI) using the infrared spectrograph (IRS) in the wavelength range 5-38 µm. Goodrich (1995) had shown that some Seyfert 1.8/1.9s show variations in the flux of the broad Balmer line wings consistent with changes in the red-dening of the BLR. Thus, these objects are likely to be viewed at intermediate angles with respect to the torus axis, and since they do not fully extinguish the nucleus as in Seyfert 2s, provide a probe of the nature of the dust obscu-ration in the torus. The primary motivation to study Seyferts with Spitzer
spectroscopy is to understand the characteristics of the dusty torus and the surrounding dusty regions. We have supplemented this sample of 12 Seyfert 1.8/1.9s with publicly available Seyfert 1 and 2 spectra from the Spitzer
archives. Overall we have 69 Seyferts where mid-IR low resolution spectra have been studied.
Geometry of the Narrow-Line
Region
In this chapter, we will look at the study of the orientation of the NLR with respect to the inclination of the disk of the host galaxy. The primary goal of this study was to develop a computer program to visualize the geometry of the active nucleus in a given host galaxy.
which side of the NLR bicone is expected to be extincted by the dust in the host galaxy. Finally, the visualization serves as a good schematic of the geometry of the active nucleus. A direct application of such a tool is to constrain the nuclear geometry of large number of active galaxies and then estimate the distribution of inclination angles of the NLR. Such a distribution of inclination angles, estimated per AGN type, will test the limits of the hypothesis that the inclination of the LOS to the axis of symmetry of the nucleus strongly affects the classification of the active nucleus.
The geometry of the active nucleus is suspected to be strongly axially symmetric. The axis of the NLR outflow therefore likely defines the symme-try axis for the active nucleus. This is true only if the symmesymme-try axis of the obscuring torus at the base of the conical NLR matches the axis of symmetry of the accretion disk. Thus in the discussions that follow, we assume that the plane of the accretion disk lies in the equatorial plane of the torus and the biconical NLR is perpendicular to this plane and gets cut in half at the equatorial plane of the torus.
2.1
Previous Studies
and position angle (PA) of the radio jet and the inclination and position angle of the host galaxy disk. They attempted to determine the angle (called ‘β’) between the direction of the radio jet and the normal to the host galaxy plane. Although the inclination angle of the radio jet is not generally known, they were able to determine a minimumβ angle and look at the distribution of this angle over a large sample of Seyfert 1s and Seyfert 2s. They concluded that the radio jet directions were distributed randomly with respect to the normal to the host galaxy planes, confirming previous results of Schmitt et al. (1997). Thus they conclude that the accretion disks in Seyfert galaxies do not necessarily align with the planes of the host galaxies.
axis in Seyfert 1s agrees with results of Keel (1980) and Maiolino & Rieke (1995).
As mentioned above, Clarke et al. (1998) using the dataset gathered by Schmitt et al. (1997) showed that given the inclination i of the host galaxy, and the difference (δ) between P.A. of the radio jet and the P.A. of the major axis of the host galaxy disk, it is possible to estimate a minimum value of angle β. From this analysis, they concluded that the distribution of
β angles are different for Seyfert 1s and Seyfert 2s at a 96% confidence level, which contradicts the Unified model scenario. Seyfert 1s favor low values of β, while Seyfert 2s favor high values of β. However, Nagar & Wilson (1999) argue that a bias in the distribution of host galaxy inclination i can lead to apparent differences in β distributions of Seyfert 1s and Seyfert 2s. They further argue that there is no difference in β distributions of the two types. Kinney et al. (2000) selected a sample of Seyfert 1s and Seyfert 2s based on their 60 µm fluxes and warm infrared colors. They show that the distributions ofβ are the same for Seyfert 1s and Seyfert 2s, if it is assumed that a galaxy appears as a Seyfert 1 when the angle between the LOS and the radio jet is less than φc and that the galaxy inclinationi is smaller than
some angle ic. Thus they conclude that this orientation restriction on the
model to generate statistically acceptable fits indicates that at least to first order, orientation effects dominate the interpretation of AGN properties.