Document Version: Article
The aim of the Leeds Beckett Repository is to provide open access to our research, as required by funder policies and permitted by publishers and copyright law.
The Leeds Beckett repository holds a wide range of publications, each of which has been checked for copyright and the relevant embargo period has been applied by the Research Services team.
We operate on a standard take-down policy. If you are the author or publisher of an output and you would like it removed from the repository, please contact us and we will investigate on a case-by-case basis.
Deterministic and stochastic optimal inventory
control with logistic stock-dependent demand rate
A. Tsoularis
Business Rose Bowl,Leeds Metropolitan University, Portland Crescent,
Leeds LS1 3HB, UK
E-mail: [email protected]
Abstract: It has been suggested by many supply chain practitioners that in certain cases inventory can have a stimulating effect on the demand. In mathematical terms this amounts to the demand being a function of the inventory level alone. In this work we propose a logistic growth model for the inventory dependent demand rate and solve first the continuous time deterministic optimal control problem of maximising the present value of the total net profit over an infinite horizon. It is shown that under a strict condition there is a unique optimal stock level which the inventory planner should maintain in order to satisfy demand. The stochastic version of the optimal control problem is considered next. A bang-bang type of optimal control problem is formulated and the associated Hamilton-Jacobi-Bellman equation is solved. The inventory level that signifies a switch in the ordering strategy is worked out in the stochastic case.
Keywords: logistic growth; Euler-Lagrange equation; Legendre condition; Hamilton-Jacobi-Bellman equation; Wiener process; Itó conditions.
Reference to this paper should be made as follows: Tsoularis, A. (2014) ‘Deterministic and stochastic optimal inventory control with logistic stock-dependent demand rate’, Int. J. Mathematics in Operational Research, Vol. 6, No. 1, pp.41–69.
Biographical notes: A. Tsoularis obtained his BSc in Physics/Astrophysics (1982) and MSc in Operational Research (1984) from the University of London. He worked as an Engineer for the electricity industry in UK from 1989 to 1994 before obtaining his PhD in Cybernetics from Reading University in 1997. He moved to Massey University, New Zealand, in 1999 as a Senior Lecturer in Operational Research. In 2008, he returned to UK to join the Business School at Leeds Metropolitan University.
1 Literature review
2 The demand rate function
In this article we introduce an inventory-level-dependent function for the demand rate that is analogous to the logistic model for population growth used in population ecology (Tsoularis and Wallace, 2002). The logistic growth model has the form
1 ,
dx x
x
dt α ⎛ D
⎞ = ⎜ − ⎟
⎝ ⎠
where x is the current biological population and D is the carrying capacity which reflects the available environmental resources for sustaining the population. The growth rate is proportional to the difference between the available resources and the necessary resources for current sustenance. The factor α, is the intrinsic per capita growth rate.
In the context of modelling inventory dependent demand we put forward the idea that if the actual demand is a continuous function of time, y(t), its rate of growth, dy,
dt will evolve according to the current inventory, x(t), thus:
1
dy x
x
dt α ⎛ D
⎞ = ⎜ − ⎟
⎝ ⎠ (1)
Here D is the stock level where demand ceases to grow, reaching either a saturation point or is halted due to storage limitations. This imposes a limit on the growth in demand which can, for instance, be attributed to a saturating effect. As D is an arbitrary parameter, it can be large or small depending on the nature of the product being offered which is assumed to be replenished at a rate, u. The function, x 1 x ,
D
α ⎛⎜ − ⎞⎟
⎝ ⎠ is concave
and positive for all x (actual demand, y(t), is always increasing), and will be increasing (yx >0) for
2 D
x< and decreasing (yx <0) for , 2 D
x> always at a decreasing rate
(yxx<0). The maximum growth rate, 2
, 4 D
α
occurs at . 2 D
x= So for , 2 D x< the demand rate behaves like a Type II model, as 2 classified by Urban (2005). The essential feature of (1) is that it captures in sequence growth, saturation and decline in sales as inventory levels become increasingly abundant. Aoki and Yoshikawa (2002) highlight the utility of logistic growth in various industrial sectors. Similar modes of product demand are described in Nahmias (1997).
3 Problem formulation
We adopt the following notation: x(t) is the inventory level at time t x0∈ (0, D) is the initial inventory at time t = 0
1 x x
D
α ⎛⎜ − ⎞⎟
⎝ ⎠ is the inventory dependent demand rate
u(t) is the order (production) rate per unit time up to a maximum rate U p is the fixed revenue per unit item
h is the fixed inventory cost per unit item
c is the fixed order (production) cost per unit item (c < p) r is the fixed discount rate
α is the fixed coefficient regulating the demand rate per unit inventory item per unit time
D is the maximum stock level possible or demand saturation inducing inventory
x0 is the amount of inventory at the beginning of the planning period (t = 0). The problem is to maximise the present value of the total net profit:
( )
00
1
rt x
J x e p x hx cu dt
D
α ∞
− ⎛ ⎛ ⎞ ⎞
= ⎜ ⎜ − ⎟− − ⎟
⎝ ⎠
⎝ ⎠
∫
(2)subject to the following state equation and constraints:
0
( ) ( ) 1 ,
(0) , 0 ( ) .
x
x t u t x
D
x x
u t U
α ⎛ ⎞ = − ⎜ − ⎟
⎝ ⎠
=
≤ ≤
(3)
Starting from an initial inventory, x(0) = x0, an optimal production schedule, 0 ≤u*(t) ≤U, must be found for which the functional (2) attains its maximum value. The presence of the discount term, e−rt, in the integrand, and the boundedness of
1 x
p x hx cu
D
α ⎛⎜ − ⎞⎟− −
⎝ ⎠ ensures convergence for the integral in (2).
4 Derivation of the optimal control policy
* *
( )
( ) max 1 1
u t
x x dV
rV x p x hx cu u x
D D dx
α α
⎛⎛ ⎛ ⎞ ⎞ ⎛ ⎛ ⎞⎞ ⎞
= ⎜⎜⎜ ⎝⎜ − ⎟⎠− − ⎟ ⎜+ + ⎜⎝ − ⎠⎟⎟ ⎟⎟
⎝ ⎠ ⎝ ⎠
⎝ ⎠ (4)
where V*(x) is the optimal net current value profit when the current inventory is x(t). It follows from (4) that the optimal control policy depends on the algebraic sign of
* : dV
c dx −
*
* *
* if
( ) 0 if
0 if dV
U c
dx dV
u t c
dx dV
u U c
dx
⎧
> ⎪
⎪ ⎪
=⎨ <
⎪ ⎪
≤ ≤ =
⎪ ⎩
(5)
As long as the marginal inventory value, dV*,
dx exceeds the order cost, c, the optimal policy is to order at the maximum rate, U, otherwise no orders are placed. When
* ,
dV c
dx = the choice of u is formally undetermined; any order policy in the range [0, U] does not affect the solution of (4). There are then two subsets of the inventory state space, one in which dV* c,
dx > and another in which
* ,
dV c
dx < that are separated by a particular inventory value, x*, which is an accumulation point of the two subsets and at which the control may assume any arbitrary value. Once the inventory level exceeds x*, its marginal value drops below the order cost, c, and orders must cease until the inventory falls below x* and its marginal value begins to rise again by resuming orders. In order to establish the existence or otherwise of such threshold inventory level we turn to the calculus of variations. Since our problem is one-dimensional infinite horizon autonomous problem linear in u(t), we can eliminate u(t) from (3) and substitute the resulting expression in (2). Substitution for ( )u t x x 1 x
D
α ⎛ ⎞ = + ⎜ − ⎟
⎝ ⎠ in (2) yields:
( )
( )
(
)
0
0
,
( ) rt
rt
J e L x x dt
e M x N x x dt
∞ − ∞
− =
= +
∫
∫
(6)
subject to the constraints 0
(0) ,
1 1 ,
x x
x x
x x U x
α α
=
⎛ ⎞ ⎛ ⎞
where
( )
, ( ) ( )( ) ( ) 1 ,
( ) .
L x x M x N x x x
M x p c x hx
D
N x c
α
= +
⎛ ⎞
= − ⎜ − ⎟−
⎝ ⎠
= −
(8)
Application of the Euler-Lagrange equation, d e rt L e rt L,
dt x x
− ∂ − ∂ ⎛ ⎞ =
⎜ ∂ ⎟ ∂
⎝ ⎠ gives
2
(p c) 1 x h rc 0 D
α − ⎛⎜ − ⎞⎟− − =
⎝ ⎠ (9)
Equation (9) is an algebraic equation in a single variable, x, and has a unique stationary solution, x*, given by
* 1
2 ( )
D rc h
x
p c
α
⎛ + ⎞
= ⎜ − ⎟
−
⎝ ⎠ (10)
Since p >c, * . 2 D
x < The condition
rc h p c
α > +
− (11)
must be observed for x* to exist. (11) states that for an optimum inventory level to exist the intrinsic demand growth rate, α, must exceed the ratio, rc h,
p c
+
− that involves all the
monetary parameters of the problem and represents the fraction of the net income from selling a single item, p−c, that is absorbed by the accumulated interest on the order cost, rc, and the holding cost, h.
The Euler-Lagrange equation as well as the Legendre condition, e rt 22L 0, x
− ∂ = ∂
provide necessary but not sufficient conditions for optimality. The sufficiency condition is furnished by proving the concavity of the integrand, e L x x−rt ( , ). Since both conditions
2 2
2 2 2 ( ) 0,
rt L rt M rt
e e e p c
x x D
α
− ∂ = − ∂ = − − − <
∂ ∂
2
2 2 2
2 2 0,
rt L L L
e
x x x x
− ⎛⎜∂ ∂ −⎛⎜ ∂ ⎞⎟ ⎞⎟=
⎜∂ ∂ ⎝∂ ∂ ⎠ ⎟
⎝ ⎠
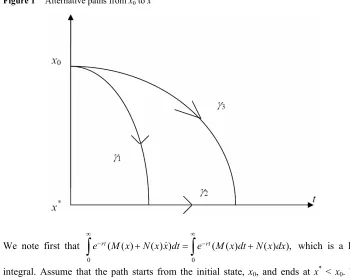
The optimal solution to the optimisation problem defined by (2) and (3) is to move from x0 to x* as quickly as possible and then remain at x* thereafter. This is the so-called most rapid approach path (MRAP) approach. Spence and Starrett (1975) provide a detailed analysis of this approach in the autonomous case whereas Hartl and Feichtinger (1987) derive the Euler equation in the non-autonomous case (M and N are functions of time, t, as well as state, x). We offer a brief graphical proof of the optimality of MRAP below.
[image:8.595.114.464.247.527.2]Figure 1 shows two alternative paths from x0 to x*. Figure 1 Alternative paths from x0 to x*
We note first that
0 0
( ( ) ( ) ) ( ( ) ( ) ),
rt rt
e M x N x x dt e M x dt N x dx
∞ ∞
− + = − +
∫
∫
which is a lineintegral. Assume that the path starts from the initial state, x0, and ends at x* < x0. We evaluate this line integral along two paths, γ1γ2 and γ3, that is,
1 2
( ( ) ( ) ) rt
γ γ
e− M x dt N x dx+
∫
and 3
( ( ) ( ) ). rt
γ
e− M x dt N x dx+
∫
Then we form the difference between these two line integrals:(
)
(
)
(
)
1 2 3
1 2 3
( ) ( ) ( ) ( )
( ) ( )
rt rt
γ γ γ
rt
γ γ γ
e M x dt N x dx e M x dt N x dx
e M x dt N x dx
− −
−
+ − +
= +
∫
∫
This is a line integral around the closed curve γ1γ2γ3 in the counterclockwise (positive) sense, which, by application of Green’s Theorem, can be written as a double integral:
(
)
(
) (
)
1 2 3
( ) ( )
( ) ( )
( )
rt rt
rt
γ γ γ
rt
e N x e M x
e M x dt N x dx dtdx
t x
dM
e rN x dtdx
dx
− −
− −
⎛∂ ∂ ⎞
⎜ ⎟
+ = ⎜ − ⎟
∂ ∂
⎝ ⎠
⎛ ⎞
= − ⎜ + ⎟
⎝ ⎠
∫
∫∫
∫∫
The double integral expresses the difference between the values of two functionals along two different paths. The path γ1γ2 is the path that approaches x* most rapidly and will be the optimal one if the integrand is negative, that is if,
( ) dM 0 rN x
dx
+ <
A similar argument applies when x0 < x*, provided that the reverse condition ( ) dM 0
rN x dx
+ >
now holds.
In our problem, dM rN x( ) (p c) 1 2x h rc
dx α D
⎛ ⎞
+ = − ⎜ − ⎟− −
⎝ ⎠ is positive if x0 < x
*, negative if x0 > x*, and 0 if x0 = x*. It is therefore optimal to get to x* from x0 at the maximum rate. If x0 > x*, the maximum rate can be realised by not placing any orders (u = 0) so that the inventory will decline at the rate, x 1 x .
D
α ⎛ ⎞
− ⎜ − ⎟
⎝ ⎠ If x0 < x
*, the maximum rate can be realised by placing orders at the maximum rate (u = U) so that the inventory will rise at the rate, U x 1 x .
D
− α ⎛⎜ − ⎞⎟
⎝ ⎠ In short, If x0 = x
*, x* must be maintained by placing orders at exactly the same rate the inventory changes, that is,
* * * 1 x .
u x
D
= α ⎛⎜ − ⎞⎟
⎝ ⎠
In accordance to the MRAP we have: *
*
* * *
0
* , 0
, 1
, x u
x
x x u x
D x u U
α
⎧ > =
⎪
⎛ ⎞
⎪
= =⎨ = ⎜ − ⎟
⎝ ⎠
⎪
⎪ < =
⎩
(12)
5 Analytical solutions to the state equation (3)
In this section, we derive general analytical solutions for the inventory variable for the two extreme values, 0 and U, of the control variable, u(t). However, the various solutions for u = U are only relevant for any initial inventory value, x0 < x*. Next we solve the differential equation (3) with u(t) = 0 and u(t) = U. Before we do so we are going to need the roots of the quadratic equation, u x 1 x 0 :
D
α ⎛ ⎞
− ⎜ − ⎟=
⎝ ⎠
2
1
2
2
4
2 4
2 uD
D D
x
uD
D D
x
α
α
+ −
=
− −
=
(13)
5.1 Solution for
4 αD U <
In this case the roots x1 and x2 are both real. The differential equation has the following solution:
(
)
2 0 1 2
1
0 2
0 1 2
0 2
4 exp
( )
4
1 exp
x x x u
x t
x x D
x t
x x u
t
x x D
α α
α α
⎛ ⎞
−
− − ⎜⎜ − ⎟⎟
⎝ ⎠
=
⎛ ⎞
−
− − ⎜⎜ − ⎟⎟
⎝ ⎠
(14)
Since
1 0
x x df dx =
⎛ ⎞ >
⎜ ⎟
⎝ ⎠ and 2
0,
x x df dx =
⎛ ⎞ <
⎜ ⎟
⎝ ⎠ x1 is an unstable equilibrium and x2 is an
asymptotically stable equilibrium. The solution (14) is well defined for all x0 ∈ (0, x2)∪ (x2, D). At x0 = x2, the inventory remains at this level for ever. For any other initial inventory value the inventory will eventually settle towards x2. The presence of the stable equilibrium, x2, places certain restrictions on the location of the initial inventory value, x0. We examine all possible cases in detail and to that effect we calculate the time, t*, needed to reach x* from (14):
(
)
(
)
(
)
(
)
*
1 0 2 *
*
2 0 1 2
1 ln
4
x x x x
t
x x x x
u D
α α
⎛ − − ⎞
⎜ ⎟
=
⎜ − − ⎟
⎝ ⎠
−
1 x2 < x0 < x*: the inventory can build up to x* level at time t*, where the optimal steady state order rate, u* x* 1 x* ,
D
= α ⎛⎜ − ⎞⎟
⎝ ⎠ can be exercised thereafter. Since x2 and U are
functionally dependent, U is subject to the following constraint: 2
4 4
D D rc h U
p c
α α
⎛ + ⎞
< − ⎜ ⎟
−
⎝ ⎠ (16)
2 x0 < x2 < x*: the inventory will be attracted asymptotically towards x2 before it gets to
x* and will remain at this level thereafter. In this case x* is unattainable, as it can also be seen from the non-existence of a real value for t* in (15).
3 x0 < x*≤x2: the inventory can eventually build up to the desired value, x*, at or before x2. The reverse condition to (16) holds in this case
2
4 4 4
D D rc h U D
p c
α α
α
⎛ + ⎞
− ⎜ ⎟ ≤ <
−
⎝ ⎠ (17)
5.2 Solution for
4 αD U <
When , 1 2 ,
4 2
D D
U <α x =x = and the solution is:
(
)
(
00)
2 ( )
2 2 2
D x D
D x t
D x t D
α
−
= +
− + (18)
The solution (18) is well defined in the time interval [0, ∞) for all 0 . 2 D x ∈⎜ ⎥⎛ ⎤
⎝ ⎦ For
0 ,
2 D x ∈⎜⎛ D⎞⎟
⎝ ⎠ the solution is defined on the time interval,
(
0)
20, .
2 D t
x D
α
⎡ ⎞
∈⎢ ⎟⎟
−
⎢⎣ ⎠ The
inventory level, 0 , 2 D
x = is an unstable equilibrium.
For an initial inventory value, *
0 ,
2 D
x ≤x < the time taken to reach x* is given by
(
)
*
0
2( ) 2
2
p c D
t
rc h α x D
−
= +
5.3 Solution for
4 αD U <
The roots are complex conjugates with positive real part, hence unstable. The solution to the differential equation in this case is:
0 2
( ) tan( ),
2
2
tan ,
4 D Dω
x t ωt
D
x U
ω
Dω D
φ α
α α φ =
α
= + +
−
= −
(20)
The solution (20) is periodic with period, π,
ω and is well defined for all x0∈ (0, D) in the
entire time interval, t∈ [0, ∞), except at the discrete time instants, (2 1)
2 , 0,1, 2,
n
π n
t n
ω
φ
+ −
= = …
For *
0 ,
2 D
x <x < the monotonicity of the tangent function guarantees that x* will be reached at time, t*, given by
* 1 arctan
2 ( ) rc h t
ω ωc p φ
⎛ ⎛ + ⎞ ⎞
= ⎜⎜ ⎜ − ⎟− ⎟⎟
⎝ ⎠
⎝ ⎠ (21)
5.4 Solution for u = 0
Finally, when u = 0, the solution is: 0
0 0
( ) Dx et t x t
x e D x
α α
− −
=
+ − (22)
In this case the inventory will asymptotically drop to the asymptotically stable value, x = 0, as t → ∞, from any initial value, x0∈ (0, D). From an initial inventory value,
x0 > x*, the time taken to reach, x*, is
(
)
(
0)(
)
*
0
( )
1ln
( )
x p c rc h
t
p c rc h D x
α
α α
⎛ − + + ⎞
= ⎜⎜ ⎟⎟
− − − −
6 Derivation of the optimal net profit
In Section 4, we stated the H-J-B equation:
* *
( )
( ) max 1 1
u t
x x dV
rV x p x hx cu u x
D D dx
α α
⎛⎛ ⎛ ⎞ ⎞ ⎛ ⎛ ⎞⎞ ⎞
= ⎜⎜⎜ ⎝⎜ − ⎟⎠− − ⎟ ⎜+ − ⎜⎝ − ⎠⎟⎟ ⎟⎟
⎝ ⎠ ⎝ ⎠
⎝ ⎠
This is a first order ordinary linear differential equation which is normally solved by solving for the maximising u* in terms of x and dV*
dx first, and subsequently substituting the result into the equation to obtain a modified differential equation that must be solved with an appropriate boundary condition. Since u is a linear term however, an analytical expression for u is not obtainable. As we have already established that u can assume its two extreme values, 0 and U, two differential equations must be solved instead:
* 1
* *
1
( )
( ) max 1 1 for
u t
x x dV
rV x p x hx cU U x x x
D D dx
α α
⎛⎛ ⎛ ⎞ ⎞ ⎛ ⎛ ⎞⎞ ⎞
= ⎜⎜⎜ ⎜ − ⎟− − ⎟ ⎜+ − ⎜ − ⎟⎟ ⎟⎟ <
⎝ ⎠ ⎝ ⎠
⎝ ⎠ ⎝ ⎠
⎝ ⎠ (24)
* 2
* *
2
( )
( ) max 1 1 for
u t
x x dV
rV x p x hx x x x
D D dx
α α
⎛⎛ ⎛ ⎞ ⎞ ⎛ ⎞ ⎞
= ⎜⎜⎜ ⎝⎜ − ⎟⎠− ⎟+ ⎜⎝ − ⎟⎠ ⎟⎟ <
⎝ ⎠
⎝ ⎠ (25)
To ensure the continuity of V(x*), it is sufficient that the condition,
* * * * * *
1( ) 2( ) ( ),
V x =V x =V x is satisfied, as well as the condition for switching the optimal policy,
* *
* * . ( )
x x
dV c V x
dx =
⎛ ⎞ = ⎜ ⎟
⎝ ⎠ is the current net optimal profit value when the current
inventory is x*, given by
( )
*
* *
* *
(p c x) 1 x hx D V x
r
α ⎛ ⎞
− ⎜ − ⎟−
⎝ ⎠
= (26)
From (26) it is straightforward to verify that
* *
.
x x dV
c dx =
⎛ ⎞
=
⎜ ⎟
⎝ ⎠ The present value of the
value function (26) is * * * ( ),
rt
e− V x where t* is the time the stock level, x*, is reached. The solutions to (24) and (25) are
*
1 1 1
1 1
( ) ( ) 1
( )
x
V x g x cU hx p x dx k
g x α D
⎛ ⎛ ⎛ ⎞⎞ ⎞
= ⎜⎜ ⎜ + − ⎜⎝ − ⎟⎠⎟ + ⎟⎟
⎝ ⎠
⎝
∫
⎠ (27)*
2( ) 1 2( ) 1 x 2
where k1, k2 are integration constants to be determined from the conditions
* *
* *
1 2
x x x x
dV dV c
dx = dx =
⎛ ⎞ ⎛ ⎞
= =
⎜ ⎟ ⎜ ⎟
⎝ ⎠ ⎝ ⎠ and
* * * * * *
1( ) 2( ) ( ),
V x =V x =V x the boundary, x*, and
1( ) exp
1 r
g x dx
x
U x
D
α
⎛ ⎞
⎜ ⎟
⎜ ⎟
= −
⎜ − ⎛ − ⎞ ⎟
⎜ ⎟
⎜ ⎝ ⎠ ⎟
⎝ ⎠
∫
(29)2( ) exp
1 r
g x dx
x x
D
α
⎛ ⎞
⎜ ⎟
⎜ ⎟
=
⎜ ⎛ − ⎞ ⎟
⎜ ⎟
⎜ ⎝ ⎠ ⎟
⎝ ⎠
∫
(30)are the integrating factors worked out explicitly in Section 5.
7 The stochastic inventory model demand growth function
We now allow the demand to possess a certain degree of randomness and assume that after a small time interval, dt, the replenished inventory will on average have changed by the anticipated amount, u x 1 x dt,
D
α
⎛ − ⎛ − ⎞⎞
⎜ ⎜⎝ ⎟⎠⎟
⎝ ⎠ with variance, σ
2x2dt, we can write down a
stochastic differential equation for the inventory dynamics
1 x
dx u x dt σxdw
D
α
⎛ ⎛ ⎞⎞
=⎜ − ⎜ − ⎟⎟ +
⎝ ⎠
⎝ ⎠ (31)
The parameter, σ, is the diffusion parameter and dw is the Wiener process, a normal random variable, N(0, dt). We have written (31) in a differential form as the derivative of dw is usually interpreted as white noise which cannot be formally integrated. A unique solution to (31) exists if both Itó conditions hold (Fleming and Rishel, 1975). The first is the linear growth condition
(
)
(
)
1 1 | |
| | 1 | | x
u x K x
D
σx K x
α ⎛ ⎞ − ⎜ − ⎟ ≤ +
⎝ ⎠
≤ +
and the other is the Lipschitz condition
(
)
1 2
1 2 1 2
1 2 1 2
1 x 1 x
x x L x x
D D
σ x x L x x
α ⎛ ⎞ α ⎛ ⎞
− ⎜ − ⎟+ ⎜ − ⎟ ≤ −
⎝ ⎠ ⎝ ⎠
for some independent constants, K and L. Both conditions are met for bounded α, σ and u. The solution to (31) is the stochastic integral equation
0 0
0 0
( ) 1 , (0) , (0) 0
t t
x
x t x u x dt σxdw x x D w
D
α
⎛ ⎛ ⎞⎞
= + ⎜ − ⎜ − ⎟⎟ + = =
⎝ ⎠
⎝ ⎠
∫
∫
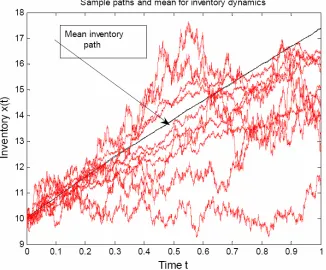
(32)Figure 2 shows ten sample paths and the mean inventory for x0 = 10, u = 10, α = 0.2,
[image:15.595.135.461.279.549.2]σ = 0.3, D = 400.
Figure 2 Simulated solution of stochastic integral equation (32) (see online version for colours)
8 The stochastic optimal control problem
problem with a discounted quadratic function designed to minimise the squared deviation from a desired inventory and production level. Fleming et al. (1987) considered an infinite horizon stochastic production planning problem with demand assumed to be a continuous-time Markov chain. Sethi et al. (1992) considered an infinite horizon stochastic production planning problem with capacity and demand assumed to be finite state Markov chains and established the existence of a threshold inventory level, or turnpike level, such that production takes place when below or at this level and no production above it. Dohi et al. (1995) dealt with an optimal production planning problem with the same objective as Bensoussan et al. (1984) but with demand assumed to be a mean-reverting Markovian diffusion process. A paper that is close to the spirit of the present work is the work of Berling and Martinez-de-Albéniz (2011). These authors considered the problem of exogenous stochastic demand following a Poisson distribution and a variable replenishment price evolving as a geometric Brownian motion or Ornstein-Uhlenbeck process and focused on determining the optimal stock level as a function of a series of threshold prices. It is worth noting that none of the aforementioned papers allow for inventory-dependent demand, which is what we present in this paper.
We consider the objective of maximising the expected net profit from selling a product with fixed price, p. Holding costs are incurred continuously at constant rate, h, per item and the fixed ordering cost per item is c. There is no backlogging and the lead times are zero. The retailer calculates the gross return, p x 1 x ,
D
α ⎛⎜ − ⎞⎟
⎝ ⎠ based on the
expected demand. The net undiscounted profit is then, p x 1 x hx cu. D
α ⎛⎜ − ⎞⎟− −
⎝ ⎠ Our
objective is to maximise the expected value of the net discounted profit with discount rate, r, over an infinite horizon:
( )
0 0( ) 0
max rt 1 (0)
u t
x
V x E e p x hx cu dt x x
D
α ∞
−
⎡ ⎛ ⎛ ⎞ ⎞ ⎤
⎢ ⎥
= ⎜ ⎜ − ⎟− − ⎟ =
⎢ ⎝ ⎝ ⎠ ⎠ ⎥
⎣
∫
⎦(33)
subject to the stochastic differential equation (32), shown again below:
0
1 x , (0) , , (0) 0
dx u x dt σxdw x x D w
D
α
⎛ ⎛ ⎞⎞
=⎜ − ⎜ − ⎟⎟ + = =
⎝ ⎠
⎝ ⎠ (34)
and the control constraint:
0 ≤ u ≤ U (35)
The second order derivative of the concave profit function is continuous and is therefore bounded by the polynomial growth condition, p x 1 x hx xu K(1 x u),
D
α ⎛⎜ − ⎞⎟− − ≤ + +
⎝ ⎠ for
some constant K (Fleming and Rishel, 1975). We assume that p h,
α
The H-J-B equation (Malliaris and Brock, 1982) for the stochastic control problem is a differential equation for the current value, V(x):
2 2 2
2 ( )
1
max 1 1
2 u t
x x dV d V
rV p x hx cu u x σ x
D D dx dx
α α
⎛⎛ ⎛ ⎞ ⎞ ⎛ ⎛ ⎞⎞ ⎞
= ⎜⎜⎜ ⎝⎜ − ⎠⎟− − ⎟ ⎜+ − ⎜⎝ − ⎟⎠⎟ + ⎟⎟
⎝ ⎠ ⎝ ⎠
⎝ ⎠ (36)
The second order linear differential equation (36) is linear in u. The optimal control decision, u*, will then depend on the sign of dV c:
dx −
*
0 if
[0, ] if
if dV
c dx
dV
u u U c
dx dV
U c
dx
⎧ <
⎪ ⎪ ⎪
=⎨ ∈ =
⎪
⎪ >
⎪⎩
(37)
The optimal control law (37) suggests that the set of inventory states is divided into two distinct regions separated by a boundary on which the marginal profit, dV,
dx equals the unit order cost, c, and where x attains a specific value, x*. The problem then is to determine the stock level, x*, at which
* . x x
dV c
dx =
⎛ ⎞ =
⎜ ⎟
⎝ ⎠ If the stock happens to exceed the
specific value, x*, the optimal policy is to place no orders (u* = 0) until the stock reaches
x*, whereas if the stock level has fallen below x*, the optimal ordering policy is to order the maximum possible quantity (u* = U) until the stock reaches x*. Once the stock level hits x*, any admissible ordering policy, u*∈[0, U] is acceptable since
* . x x dV
c dx =
⎛ ⎞ =
⎜ ⎟ ⎝ ⎠
Due to the random disturbance present in the system, the inventory will momentarily move away from x*, but the extreme order policy, u* = 0 or u* = U will kick in to restore the inventory level back to x*. Since the choice of control does not affect the solution of (36), the optimal control, u* x* 1 x* ,
D
α ⎛ ⎞
= ⎜ − ⎟
⎝ ⎠ could be used to eliminate the drift in the
stochastic differential equation (34). Excursions from x* would then be drift-free geometric Brownian motions of the form, ( ) *exp 2 ( )
2
σ t
x t =x ⎛⎜− +σw t ⎞⎟
⎝ ⎠ with expected
value [x(t)] = x* and zero variance.
for finite D. When the demand saturation level, D, is infinite, the term, x2, D
α
drops out from both the profit function and the diffusion process. The inventory dynamics is now
(
)
, (0) 0, (0) 0dx= u−αx dt+σxdw x =x w = (38)
and the profit functional is
( )
(
)
*
0 0
( ) 0
max rt (0)
u t
V x E e p x hx cu dt xα x
∞ −
⎡ ⎤
⎢ ⎥
= − − =
⎢ ⎥
⎣
∫
⎦(39)
The H-J-B second order differential equation is in this case given by
2 * *
2 2 *
1 2
1 ( ) ( )
2
d V dV
x u x rV h p x cu
dx dx
σ + −α − = − α + (40)
We produce two separate solutions to the H-J-B equation, one with solution, * 1( ),
V x
when u* = U and dV* c 0,
dx − > and another with solution,
* 2( ),
V x when u* = 0 and *
0. dV
c
dx − < Continuity and differentiability of the solution at the threshold value, x
*, requires that the boundary conditions
( )
( )
* *
* *
* * * *
1 2
* *
1 2
2 * 2 *
1 2
2 2
x x x x
x x x x
V x V x
dV dV
c
dx dx
d V d V
dx dx
= =
= =
=
⎛ ⎞ ⎛ ⎞
= =
⎜ ⎟ ⎜ ⎟
⎜ ⎟ ⎜ ⎟
⎝ ⎠ ⎝ ⎠
⎛ ⎞ ⎛ ⎞
=
⎜ ⎟ ⎜ ⎟
⎜ ⎟ ⎜ ⎟
⎝ ⎠ ⎝ ⎠
(41)
be met. These conditions will be exploited to provide analytical forms for the current value function at the threshold inventory level, x*.
9.1 The H-J-B equation for u* = U
The H-J-B equation is:
2 * *
2 2 1 1 *
1 2
1
( ) ( )
2
d V dV
x u x rV h p x cU
dx dx
σ + −α − = − α + (42)
x = 0 is an irregular singular point of the second order differential equation but every other point, x≠ 0, is an ordinary point. We can therefore use a Taylor series expansion,
* 1
0
( ) ( ) ,n n
n
V x a x ξ
∞ =
2 ( )2 2 ( ) 2,
( ) ( ),
( ) ( )( ) ( )
x x x
U x U x
h p x cU h p x cU h p
ξ ξ ξ ξ
α αξ α ξ
α α ξ ξ α
= − + − +
− = − − −
− + = − − + + −
Inserting the Taylor series into the differential equation we obtain:
(
)
2 2 2
2
1 2
0
1 0
( 1) ( 1) ( 1)( 2) ( )
2 2
( )( 1) ( )
( )( ) ( )
n
n n n
n
n
n n n
n
n n a n n a n n a x
U n a n a ra x
h p x cU h p
σ σ ξ σ ξ ξ
αξ α ξ
α ξ ξ α
∞ + + = ∞ + = ⎛ − ⎞ + + + + + − ⎜ ⎟ ⎜ ⎟ ⎝ ⎠ + − + − − − = − − + + −
∑
∑
Setting coefficients on both sides equal to 0, the first two inhomogeneous terms are: 2 2
2 1 0
0 : ( ) ( )
n= σ ξ a + U−αξ a −ra =cU+ξ h p− α
2 2 2
2 3 2 1 1
1: 3 2( )
n= σ ξa + σ ξ a + U−αξ a −αa −ra = −h pα
The two initial coefficients, a0 and a1, can in principle, be determined by the appropriate boundary conditions. From them we obtain the third and fourth coefficients, a2 and a3:
2 2 2 2 2 0 2 2 1
( ) ( )
cU h p t U
a ξ α a αξ a
σ ξ σ ξ σ ξ
+ − −
= + − (43)
2
3 2 2 2 2 1 2 2 2
( ) 2( )
3 3 2
h p r U
a α α a αξ σ ξ a
σ ξ σ ξ σ ξ
− + − +
= + − (44)
The remaining coefficients, an, are calculated from the following recursive relationship:
(
2)
(
2)
1
2 2 2
2 2 ( 1) 2( 1)
, 2 ( 1)( 2)
n n
n
n r n n a n n U a
a n
n n
α σ σ ξ αξ
σ ξ
+ +
+ − − − + + −
= ≥
+ + (45)
9.2 The H-J-B equation for u* = 0
In what follows the generic point ξ is replaced by x*. For u* = 0 the H-J-B equation is the inhomogeneous second order Euler equation:
2 * *
2 2 2 2 *
2 2
1
) ( )
2
d V dV
x x rV h p x
dx dx
σ −α − = − α (46)
This can be solved, by the standard method of variation of parameters to give:
(
)(
)
1 23 *
2 1 2
1 2
( )
( )
3 3
h p x
V x α k xρ k xρ
ρ ρ
−
= + +
where k1, k2 are integration constants to be determined from the appropriate boundary conditions, and the exponents, ρ1 and ρ2 are given by
(
)
(
)
2
2 2 2
1 2
2
2 2 2
2 2
2 2 8
1, 2
2 2 8
0 2
r
r
σ α σ α σ
ρ
σ
σ α σ α σ
ρ σ + + + + = > + + + + = < (48)
At x = 0, we impose the natural boundary condition, * 2(0) 0,
V = and consequently the term, k2, associated with the negative root, ρ2, must be forced to equal zero. We present two different solutions for *
2( ) :
V x
1 ρ1≠ 3:
(
)(
)
13 * 2 1 1 2 ( ) ( ) 3 3
h p x
V x α k xρ
ρ ρ
−
= +
− − (49)
There is only one unknown parameter, k1, to be determined in (49). To that effect we use the condition,
* 2 .
dV c
dx = We have then
( )
(
)(
)
( )
1* 2 * * 1 * 2 1 1 1 2 3( ) 3 3 x x
h p x
dV
c k x
dx ρ α ρ ρ ρ − = − ⎛ ⎞ = = + ⎜ ⎟ ⎜ ⎟ − −
⎝ ⎠ (50)
whence,
( )
1(
)(
( )
)
( )
12 *
1 3
* *
1
1 1 1 2
3( )
3 3
h p x
c
k x ρ α x ρ
ρ ρ ρ ρ
− − −
= −
− − (51)
Inserting (51) into (49) we obtain the final form of the value function
(
)(
)
(
)(
)
( )
1
3 * 3 3
* *
2 *
1 2 1 1 1 2
( ) 3( )
( )
3 3 3 3
h p x x cx p h x
V x x
x
ρ
α α
ρ ρ ρ ρ ρ ρ
⎛ ⎞
− ⎛ ⎞ −
= +⎜ ⎟ ⎜⎜ + ⎟⎟
− − ⎝ ⎠ ⎝ − − ⎠ (52)
Finally, we need to determine the threshold value, x*. We have
(
)(
)
(
)
( )
1
*
2 * * 2
* 2
2 1 1 1
2 1 2 6( ) 1 3 3 x x
d V h p x
a k x
dx
ρ
α ρ ρ
ρ ρ − = ⎛ ⎞ − = = + − ⎜ ⎟ ⎜ ⎟ − −
⎝ ⎠ (53)
However, by virtue of (53), a2 is also given by
( )
*( )
*2 2 * 2 * 2 2
(h p c) r
a V x
x x
α α
σ σ
− +
Equating (53) to (54) and solving the quadratic equation in x* we have
(
)
(
(
)
)
(
)
2 2 2
2 1 1
*
2 1 3
3 ( )
c p h c c rc
x
r p h
ρ σ ρ α α σ ρ
σ ρ α
− + − − − −
=
+ − (55)
x* exists if 2 2 2
1 ( ) 1 0.
cσ ρ + pα− −h αc c− σ ρ −rc> We prove that this is indeed so next. Since (pα − h) ρ1 > 0, it is sufficient to prove that the inequality,
2 2 2
1 ( ) 1 0,
cσ ρ − αc c+ σ ρ −rc> is also always valid. There are two roots to the quadratic equation, 2 2 2
1 ( ) 1 0,
cσ ρ − αc c+ σ ρ −rc= which are given by
2 2 2 2
2
( ) 4
. 2
r
σ α σ α σ
σ
+ ± + +
Since by definition, ρ1 > 0, only the positive root is
relevant for the proof, namely
2 2 2 2
1 2
( ) 4
. 2
r
σ α σ α σ ρ
σ
+ + + +
< It immediately follows then that the inequality, 2 2 2
1 ( ) 1 0,
cσ ρ − αc c+ σ ρ −rc> always holds. The existence of x* is therefore conclusively proved.
2 ρ1 = 3:
In this case, 2 3 r
σ = +α and 2 2 , 3 r r ρ α = −
+ and there is a different solution to the
inhomogeneous Euler equation given by
(
)
* 3
2 2 1
2 2
( ) ln
3 3
p h p h
V x x α k α x
ρ ρ ⎛ − − ⎞ ⎜ ⎟ = + − ⎜ − − ⎟ ⎝ ⎠ (56)
where the term, 2 2 ,
k xρ has been dropped again for the same reason as for the case
ρ1≠ 3. The term, x3 ln x→ 0 as x→ 0, according to L’Hospital’s rule, and presents no problem. We have again
( )
(
)
( )
*
* 2 2
* * * 2 2 1 2 2 2
( ) 3 3( ) ln
3 3
x x
dV c x p h k p h x x
dx
ρ α α
ρ ρ = ⎛ ⎞ ⎛ ⎞ ⎜ − ⎟ − = = + − ⎜ ⎟ ⎜ ⎟ ⎜ − ⎟ −
⎝ ⎠ ⎝ ⎠ (57)
whence,
( )
*(
2)
1 * 2
2 2
( )
ln
3 3 3
3
c p h
k x x ρ α ρ ρ ⎛ ⎞ − = + ⎜⎜ − ⎟⎟
− ⎝ − ⎠ (58)
We have then the current value function
( )
* 3
2 2 *
1
( ) c p h ln x
V x x α
ρ ⎛ ⎞ ⎛ ⎞ − ⎛ ⎞ ⎜ ⎟ = ⎜ + ⎜ − ⎜ ⎟⎟⎟
Finally, solving
( )
*2 * * *
2 2
2 2 * 2 * 2
( )
( )
, x x
d V c p h rV x
dx x x
α
σ σ
=
⎛ ⎞ − +
= +
⎜ ⎟
⎜ ⎟
⎝ ⎠ for x
*, we obtain
* ( 3 3 3 )(9 5 )
(3 )(9 4 )( )
cr p c h r
x
r r p h
α α α
α α α
+ + − +
=
+ + − (60)
The threshold inventory level, x*, varies inversely with the diffusion parameter, σ, exhibiting a hyperbolic relationship of the form, x*~ 1.
σ This indicates that large
[image:22.595.136.459.334.597.2]random perturbations in the interactive inventory-demand system call for a switch in the optimal ordering strategy when the stock falls considerably. Also higher ordering costs, c, lead to higher threshold inventory levels. Figure 3 displays an instance of this relationship for r = 0.03, p = 2.5, α = 0.2, h = 0.1, c = 0.25, for σ∈[0, 1].
Figure 3 Threshold inventory-diffusion inter-dependence (see online version for colours)
10 The solution to the H-J-B equation when D < ∞
Again in this section we solve the H-J-B equation twice, first for u* = U, and then for
10.1 Solution to the H-J-B equation for u* = U
The equation when u* = U is:
2 * *
1 1
2 2 *
1 2
1
1 1
2
d V x dV x
σ x U x rV hx p x cU
dx − α D dx α D
⎛ ⎛ ⎞⎞ ⎛ ⎞
+⎜ ⎜ − ⎟⎟ − = − ⎜ − ⎟+
⎝ ⎠ ⎝ ⎠
⎝ ⎠ (61)
x = 0 is an irregular singular point of the second order differential equation (61), but every other point, x ≠ 0, is an ordinary point. We can therefore use a Taylor series expansion, *
1
0
( ) ( ) ,n n
n
V x a x ξ
∞ =
=
∑
− for the solution around any non-zero inventory state,ξ ≠ 0. We transform powers of the variable, x, and rewrite the coefficients as Taylor series expansions thus:
2 2 2
2
2
( ) 2 ( ) ,
1
2
( ) 1 ( ) 1 , 1
2
( ) 1 ( ) 1
x x ξ ξ x ξ ξ
x
U x
D
ξ ξ x
x ξ x ξ U ξ hx p x cU
D D D D
p x ξ p ξ h x ξ hξ p ξ ξ cU
D D D
α
α α α α
α α α
= − + − +
⎛ ⎞
− ⎜ − ⎟
⎝ ⎠
⎛ ⎞ ⎛ ⎞ ⎛ ⎞
= − + ⎜ − ⎟ − + − ⎜ − ⎟ − ⎜ − ⎟+
⎝ ⎠ ⎝ ⎠ ⎝ ⎠
⎛ ⎛ ⎞ ⎞ ⎛ ⎞
= − +⎜ ⎜ − +⎟ ⎟ − + − ⎜ − ⎟+
⎝ ⎠ ⎝ ⎠
⎝ ⎠
Inserting the transformed coefficients into (61) and equating the coefficients of like powers on both sides we obtain for n = 0:
( )
*
2 2 0 2 *
2 *
(c p) 1 x h D r
a a
σ x σ x
α − ⎛⎜ − ⎞⎟+
⎝ ⎠
= + (62)
10.2 Solution to the H-J-B equation for u* = 0
For u* = 0 the equation becomes
2 * *
2 2
2 2 *
2 2
1
1 1
2
d V x dV x
σ x x rV hx p x
dx − α D dx α D
⎛ − ⎞ − = − ⎛ − ⎞
⎜ ⎟ ⎜ ⎟
⎝ ⎠ ⎝ ⎠ (63)
The solution to the homogeneous version of (63)
2 * *
2 2
2 2 *
2 2
1
1 0
2
d V x dV
σ x x rV
dx − α ⎛ D dx
⎞
− − =
⎜ ⎟
is found by substitution of the Frobenius series, * 2
0
( ) n,
n n V x ∞ a xβ+
=
=
∑
into (64), which yields the indicial equation:(
2)
0 ( 1) 2 2 0, 0 0
a σ β β− − αβ− r = a ≠
which has the same roots, ρ1, ρ2 as those given by (48).
There are two linearly independent solutions to the homogeneous equation (64):
(
)
(
)
1 1 2 1 1 2 2 2 1 2 1 2 1( ) 1
2 8 ! n n m ρ n n n m ρ m Dσ
x x x
σ rσ
n m σ α φ α ∞ = = = ⎛ ⎛ ⎞ ⎞ ⎜ ⎜ ⎟ ⎟ ⎛ ⎞ ⎜ ⎜ − + − ⎟ ⎟ ⎜ ⎟ ⎜ ⎜ ⎝ ⎠ ⎟ ⎟ ⎜ ⎜ ⎟ ⎟ = + ⎜ ⎜ ⎛ + + ⎞⎟ ⎟ ⎜ ⎜ ⎜ + ⎟⎟ ⎟ ⎜ ⎜ ⎜ ⎟⎟ ⎟ ⎜ ⎟ ⎜ ⎜ ⎝ ⎠⎟ ⎟ ⎝ ⎠ ⎝ ⎠
∏
∑
∏
(65)(
)
(
)
2 2 2 1 2 2 2 2 1 2 1 2 1( ) 1
2 8 ! n n m ρ n n n m ρ m Dσ
x x x
σ rσ
n m σ α φ α ∞ = = = ⎛ ⎛ ⎞ ⎞ ⎜ ⎜ ⎟ ⎟ ⎛ ⎞ ⎜ ⎜ − + − ⎟ ⎟ ⎜ ⎟ ⎜ ⎜ ⎝ ⎠ ⎟ ⎟ ⎜ ⎜ ⎟ ⎟ = + ⎜ ⎜ ⎛ + + ⎞⎟ ⎟ ⎜ ⎜ ⎜ − ⎟⎟ ⎟ ⎜ ⎜ ⎜ ⎟⎟ ⎟ ⎜ ⎟ ⎜ ⎜⎝ ⎝ ⎠⎟⎠ ⎟ ⎝ ⎠
∏
∑
∏
(66)To test the convergence of (65) and (66) we conduct the ratio test. For (65)
(
)
(
)
1 2 2 2 2 2 2 lim 0 2 8( 1) 1
n
ρ n x
Dσ σ rσ
n n σ α α →∞ + ⎛− ⎞ → ⎜ ⎟ ⎛ ⎞ ⎝ ⎠ + + ⎜ ⎟ + ⎜ + + ⎟ ⎜ ⎟ ⎝ ⎠
and for (66)
(
)
(
)
1 2 2 2 2 2 2 lim 0 2 8( 1) 1
n
ρ n x
Dσ σ rσ
Both φ1(x) and φ2(x) are therefore convergent.
The Wronskian, W(x), of the two linearly independent solutions is given by Abel’s formula
2 2
2 2
2 2
2 1
( ) exp
α α x σ Dσ
x
x αx
D
W x dx x e
σ x
′
⎛ ′ −⎛ ⎞ ⎞
⎜ ⎜⎝ ⎟⎠ ⎟
⎜ ′⎟
= =
′
⎜ ⎟
⎜ ⎟
⎝ ⎠
∫
which does not vanish anywhere except at x = 0.
The particular solution to the inhomogeneous equation (63) is then
1 1 2 2
( )x ψ ( ) ( )xφ x ψ ( ) ( )xφ x
Φ = +
where
( )
( )
( )
1
1 2
1 1
( ) , ( )
x x
x x
pαx hx hx pαx x
D D
ψ x dx ψ x dx
W x W x
φ
′ ′
⎛ ′⎛ − ⎞− ′⎞ ⎛ ′− ′⎛ − ⎞⎞ ′
⎜ ⎜⎝ ⎟⎠ ⎟ ⎜ ⎜⎝ ⎟⎠⎟
⎝ ⎠ ′ ⎝ ⎠ ′
= =
′ ′
∫
∫
(67)The functions ψ1(x) and ψ2(x) are power series expressions obtained by straightforward term by term integration.
The general solution to the inhomogeneous equation (63) is then *
2( ) 1 1( ) 2 2( ) ( ) V x =kφ x +kφ x + Φ x
where k1 and k2 are coefficients to be determined by the appropriate boundary conditions. We assume that the function *
2( )
V x coincides with its counterpart (49) for D →∞. It follows from this assumption that k = 0, hence
*
2( ) 1 1( ) ( ) V x =kφ x + Φ x At the threshold point,
* *
*, 2 ,
x x dV
x c
dx =
⎛ ⎞
=
⎜ ⎟
⎜ ⎟
⎝ ⎠ hence
( )
( )
*
1 *
1
c x
k
x
φ
′ − Φ =
′
Thus, the desired solution to the inhomogeneous equation (63) assumes its final form
( )
** c x φ
⎛ − Φ′ ⎞
⎜ ⎟
To ensure continuity of the function at x*, we use again the boundary conditions (41):
( )
( )
* 2 *
2
2 2
*
* * 2
2 2 *
2 *
( ) 1
x x d V
a dx
x
c p h
D r
V x
x x
α σ σ
=
⎛ ⎞
=
⎜ ⎟
⎜ ⎟
⎝ ⎠
⎛ ⎞
− ⎜ − ⎟+
⎝ ⎠
= +
(69)
Also
( )
( )
*2 * 2
2 2
*
1 * 1
( ) ( )
x x d V
a dx
c x
x x
x φ
φ =
⎛ ⎞
=
⎜ ⎟
⎜ ⎟
⎝ ⎠
⎛ − Φ′ ⎞
⎜ ⎟ ′′ ′′
=⎜ ⎟ + Φ
′
⎜ ⎟
⎝ ⎠
(70)
Equating (69) and (70) we obtain a single equation in one unknown, x*:
( )
( )
( )
( )
( )
( )
*
* *
1 2 1 2
* 2 * 2 *
1
*
2 *
( ) ( )
( ) 1
0
c x r r
x x x x
x x x
x
c p h
D x
φ φ
φ σ σ
α σ
⎛ ⎞
′
− Φ ⎜ ⎟
′′ − + Φ′′ − Φ
⎜ ⎟
′ ⎜ ⎟
⎝ ⎠
⎛ ⎞
− ⎜ − ⎟+
⎝ ⎠
− =
(71)
Solution of (71) through a root-finding scheme should furnish the strategy threshold point, x*, with any prescribed accuracy.
11 Discussion
optimum switch level in (10) by the amount . 2 ( )
Dc p c
θ
α − This is reasonable as
maintaining a lower stock makes up for the reduction in the net profit due to increased order rates.
The MRAP can be calculated when the holding cost function is of the form, h(x) = h0xγ, as in Berman and Perry (2006), or inventory deterioration is expressed as a non-linear function of the inventory, or when the demand rate is a generalised logistic, for instance, x 1 x ,
D
β
α ⎛⎜ − ⎞⎟
⎝ ⎠ but the resulting Euler-Lagrange is a transcendental equation in x
which may possess more than one real root. The optimal path would be the MRAP from the existing inventory level to one of the roots.
Another and perhaps the most interesting research avenue is the problem of pricing. We have used a fixed price, p, in our model but demand and price are traditionally interdependent. There are three ways the price variable can enter the model:
1 as an invertible function of demand rate alone, for instance, p=λF y( )
(Gallego and Van Ryzin, 1994), in which case the autonomy of the optimal control problem is maintained
2 as another decision variable with its own state equation evolving in time
3 as a control parameter directly affecting demand as in Jørgensen and Kort (2002). This paper also solves the stochastic optimal control problem of maximising the net profit from selling an item that is subject to stock-dependent demand and random perturbations due to variations in the inventory and/or demand. The associated H-J-B equation is formulated and solved in two different cases:
1 when the stock level, D, that imposes a zero rate on demand growth, is finite 2 when D is infinite.
Finally, it is worth pointing out that for very small noise values, σ, Fleming and Souganidis (1986) have proposed a power series for the form of the value function,
0
( ) n n( ).
n
V x σ v x
∞ =
=
∑
Substitution of this series into the H-J-B equation and collectingterms with the same orders of σ yields a series of differential equations, with v0(x) being the current value function for the unperturbed problem.
Subsequent equations are first-order linear differential equations in vn with coefficients depending on vn–1. The equations for vn can be then solved recursively.
The novel contribution of this work is the determination of an optimal inventory level modified by a stock-dependent demand rate of logistic nature, evolving either deterministically or stochastically. This is important in practice for planning inventory levels that maximise net profit, in the presence of possible uncertainty in demand. However, there are some key limitations in the existing model. The most important limitation is the assumption of a constant price. We focus on introducing price dynamics as an additional factor directly affecting demand in our future research.
References
Alfares, H.K. (2007) ‘Inventory model with stock-dependent demand rate and variable holding cost’, International Journal of Production Economics, Vol. 108, No. 1–2, pp.259–265.
Aoki, M. and Yoshikawa, H. (2002) ‘Demand saturation-creation and economic growth’, Journal of Economic Behavior and Organization, Vol. 48, No. 2, pp.127–154.
Baker, R.C. and Urban, T.L. (1988) ‘A deterministic inventory system with an inventory-level-dependent demand rate’, The Journal of the Operational Research Society, Vol. 39, No. 9, pp.823–831.
Balakrishnan, A., Pangburn, M.S. and Stavrulaki, E. (2004) ‘Stack them high, let’em fly”: lot-sizing policies when inventories stimulate demand’, Management Science, Vol. 50, No. 5, pp.630–644.
Bensoussan, A., Sethi, S.P., Vickson, R. and Derszko, N. (1984) ‘Stochastic production planning with production constraints’, SIAM Journal of Control and Optimization, Vol. 22, No. 6, pp.920–935.
Berling, P. and Martinez-de-Albéniz, V. (2011) ‘Optimal inventory policies when purchase price and demand are stochastic’, Operations Research, Vol. 59, No. 1, pp.109–124.
Berman, O. and Perry, D. (2006) ‘An EOQ model with state-dependent demand rate’, European Journal of Operational Research, Vol. 171, No. 1, pp.255–272.
Chen, Y., Lu, Y. and Xu, M. (2012) ‘Optimal inventory control policy for periodic-review inventory systems with inventory-level-dependent demand’, Naval Research Logistics, Vol.59, No. 6, pp.430–440.
Datta, T.K. and Paul, K. (2001) ‘An inventory system with stock-dependent, price-sensitive demand rate’, Production Planning and Control, Vol. 12, No. 1, pp.13–20.
Dohi, T., Kaio, N. and Osaki, S. (1995) ‘Optimal production planning under diffusion demand pattern’, Mathematical and Computer Modelling, Vol. 21, No. 11, pp.35–46.
Feichtinger, G. and Hartl, R. (1985) ‘Optimal pricing and production in an inventory model’, European Journal of Operational Research, Vol. 19, No. 1, pp.45–56.
Fleming, W.H and Rishel, R.W. (1975) Deterministic and Stochastic Optimal Control, Springer Verlag, New York.
Fleming, W.H., Sethi, S.P. and Soner, H.M. (1987) ‘An optimal stochastic production planning problem with randomly fluctuating demand’, SIAM Journal of Control and Optimization, Vol. 25, No. 6, pp.1494–1502.
Gallego, G. and Van Ryzin, G. (1994) ‘Optimal dynamic pricing of inventories with stochastic demand over finite horizons’, Management Science, Vol. 40, No. 8, pp.999–1020.
Giri, B.C., Pal, S., Goswami, A. and Chaudhuri, K.S. (1996) ‘An inventory model for deteriorating items with stock-dependent demand rate’, European Journal of Operational Research, Vol. 95, No. 3, pp.604–610.
Goh, M. (1992) ‘Some results for inventory models having inventory level dependent demand rate’, International Journal of Production Economics, Vol. 27, No. 2, pp.155–160.
Hartl, R. and Feichtinger, G. (1987) ‘A new sufficient condition for most rapid approach paths’, Journal of Optimization Theory and Applications, Vol. 54, No. 2, pp.403–411.
Jørgensen, S. and Kort, P.M. (2002) ‘Optimal pricing and inventory policies: centralized and decentralized decision making’, European Journal of Operational Research, Vol. 138, No. 3, pp.578–600.
Kamien, M. and Schwartz, N.L (2001) Dynamic Optimization the Calculus of Variations and Optimal Control in Economics and Management, North Holland.
Khmelnitsky, E. and Gerchak, Y. (2002) ‘Optimal control approach to production systems with inventory-level-dependent demand’, IEEE Transactions on Automatic Control, Vol. 47, No. 2, pp.289–292.
Levin, R.I., McLaughin, C.P., Lemone, R.P. and Kottas, J.F. (1972) Production/Operations Management: Contemporary Policy for Managing Operating Systems,