2018 International Conference on Computational, Modeling, Simulation and Mathematical Statistics (CMSMS 2018) ISBN: 978-1-60595-562-9
Reliability Analysis of Network Based on the Traffic Correlation
Mao-sen QIN
*, Rui WANG, Meng-qi JI, Hong-zhong DENG
and Ke-wei YANG
College of Systems Engineering, National University of Defense Technology, 410073 Changsha, China
*Corresponding author
Keywords: Sine wave, Correlation; traffic, Reliability, Queuing theory model.
Abstract. In order to analyze the influence of the traffic correlation parameter ‘r’ on the reliability of the complex network system, the characteristics of network traffic arrival is analyzed based on a sine wave with random phase, and a network packet loss rate analysis model is built based on the queuing theory to analyze the network system reliability. The results indicate the greater the traffic correlation parameter ‘r’ is, the lower the reliability of network system will be. To improve the reliability and resource utilization of network system, the effective balance of the relevant parameter ‘r’ should be achieved at the same time.
Introduction
The reliability and security issues of complex networks are getting more and more attention. The analysis of complex network reliability has become one of the hot and difficult issues at home and abroad. At present, the study of network reliability indicators can be summarized as the following three indicators: Invulnerability, Survivability, and Availability. They reflect the reliability of the network from different perspectives. The invulnerability and survivability of the network are to examine the reliability of the network from the perspective of graph theory or graph theory and probability theory. Network availability is a reliability indicator based on network service performance. Therefore, the effectiveness is considered to satisfy the network reliability under the conditions of the network service performance, and its measurement varies with the service involved [1] [2]. As a common phenomenon on the network, traffic also plays an important role in the analysis of network reliability. Traffic is often viewed as an inherent property of a network system to analyze the impact on network reliability, or to reflect the reliability of the network through changes in traffic. Therefore, it is of great practical significance to study the reliability of the network system from the perspective of traffic.
At present, scholars have done a lot of research on analysing the reliability of network systems from the perspective of traffic. Among them, the traffic correlation has a greater impact on network reliability. FA Lópezd et al. [3] studied the influence of network traffic autocorrelation on network reliability. Su F et al. [4] showed that road traffic data has obvious temporal and spatial characteristics. Su Fei et al. [5] expressed the degree of influence between the traffic conditions of the adjacent road sections and the adjacent road sections with different time delays by the space-time correlation function.
Model Construction and Data Simulation
This section is based on the queuing theory, starts from the single traffic model and multi-traffic model and builds a network system reliability model. Then the correlation coefficient is used to analyze the correlation of traffic arrival. Finally, the reliability analysis on the correlation of traffic is obtained through data simulation.
Single Traffic Mode
Based on queuing theory, nodes and arriving traffic in a communication network can be regarded as G/D/1/B/FIFO queuing models, as shown in Figure 1. Among them, G denotes that the arrival process obeys the general distribution, D denotes the constant distribution service (keeping in mind that its service rate is constant as μ, also known as the channel transmission rate.), 1 denotes that there is a waiter, and B is the system capacity (node cache size), satisfying First-in-first-out service rules. According to the introduction above, this paper equates the intensity λ with the arrival rate of traffic to describe the change of the network system traffic on the time scale.
Figure 1. Single traffic queuing theory model.
The model is based on the fluid model used in [6][7] and changes its continuous time parameters to discrete parameters: Random sequence {Xn}(n=0,1,2,…) represents the flow rate, and it's evaluated in finite state space {λ1,λ2,…,λM}. Among them, λ1<λ2<…<λL<μ<λL+1<…<λM. {Yn}(n=0, 1, 2,…) shows the time update process. X0 represents the flow rate at time Y0, and in turn, Xn represents the flow rate at the Yn moment. The traffic remains constant throughout the update cycle. The update interval is uniformly distributed, i.e., t=Yn+1-Yn, indicating the length of the nth update cycle.
The performance analysis is based on the packet loss rate Pl and average queuing delay dm. The former refers to the ratio of overflow data to total data due to limited buffering, and the latter refers to the average time it takes for data to queue in the forwarding queue. Where Qn denotes the queue length at Yn, t=Yn+1-Yn denotes the length of the nth update period, lostn denotes the traffic lost due to queue overflow during the nth update cycle, and dtn denotes the queue for the arrival of the nth update cycle Sum of time, Ln represents the total traffic reached during the nth update cycle, and λn corresponds to the traffic rate of the nth update cycle. The experiment starts with the initial queue length of 0 and begins to use the formula (1) for iteration calculation.
1 0, ,
n n n n
Q max min B Q T (1)
It is easy to know Ln=λn×Tn and
1 2
1 1
1 1
( )
2
n n n n n n n
dt T Q Q T Q
(2)
2
0,
( ( ) )
n n n
lost max T (3) Among them,
1
1 / )
( ) (
n n n n
T Q Q (if n,so Tn1Tn)Tn2TnTn1
Therefore, the packet loss rate and the average queuing delay are:
0 0
= n n
l i i
i i
P lost L
0 0 0
n n n
m i i i
i i i
d dt L lost
(5) Based on the packet loss rate and the average queuing delay, the network reliability is defined:
l m
R R R (6)
In the network system, when multiple arriving traffics converge into one buffer at the same time, a multi-traffic queuing theory model is obtained based on the single traffic queuing theory model in order to analyze the influence of the correlation between the traffic on the reliability of the network system. As shown in Figure 2.
Arrival rate
λ1(t)
Buffer B
Server
μ Packets departing
.
λn(t)
. .
Figure 2. Multi-traffic queuing theory model.
Assume that the arrival rate function is a sine wave with random phase [8], as shown in Figure 3. Now the two flows arrive, as shown in Figure 4. The superposed velocity is obtained by formula (7) [9]. The superposed flow rate curve is shown in Figure 5.
1 2
( )=t ( )+t ( )+t + n( )t
[image:3.612.168.400.332.450.2] (7)
Figure 3. The curve of the input/output traffic over time in the queuing system.
[image:3.612.211.398.500.724.2]Figure 3 shows the queuing system for input traffic λ(t)= λ0+λω sin(ωt+Φ) and output traffic μ(t)= μ0.
Reliability Model of Network System
Traffic is an important factor in network reliability analysis, so the correlation of traffic has a significant impact on the reliability of the network. The availability of the network considers the network reliability under the condition of network service performance. It regards the nodes in the network and the arriving information traffic as a queuing system. Then it uses the knowledge of queuing theory to analyze the average queuing delay, packet loss rate, throughput, delay variation, and other performance indicators of the information in the entire network or at the node, and it also analyzes the network conditions under different queuing disciplines and different physical parameters [10]. Users are more concerned with the integrity and time of information during network communications, this paper selects the packet loss rate and average queuing delay as the service performance index for analysis. When network congestion is serious, packet loss may occur on the network system.
The reliability based on packet loss rate (LR) model based on the packet loss rate of the network system is obtained:
, 0 l l l l l l l l
F P P F F R P F
, (8) Fl is the packet loss rate threshold of the network. This threshold describes the basic requirement of network packet loss rate. The meaning of this indicator is to measure the packet loss rate of the network to meet the network packet loss rate threshold.
The reliability based on average queuing delay (DR) model based on the average queuing delay of the network system is obtained:
, 0 m m m m m m m m
F d d F
F R d F
, (9) Fm is the average queuing delay threshold of the network. This threshold describes the basic requirement of network average queuing delay. The meaning of this indicator is to measure the average queuing delay of the network to meet the network average queuing delay threshold.
Analysis on the Traffic Correlation
In order to analyze the influence of the correlation of traffic arrival on the reliability of the network system, the correlation of the two flows can be obtained by the correlation coefficient, ie. formula (10).
1 1 2 2 1
12
2 2
1 1 2 2
1 1 ( )( ) ( ) ( ) n t t t n n t t t t
λ λ λ λ r
λ λ λ λ
(10) The correlation coefficient is used as an indicator of the degree of traffic correlation in the network system. λ1t, λ2t respectively represent the traffic values of two traffics at time t, andλ1、λ2 respectively represent the respective traffic averages over a period of time. The correlation coefficient r12 is in the range of [-1, 1]. r>0 is a positive correlation, r<0 is a negative correlation, and r=0 is irrelevant. The greater the absolute value of r, the higher the degree of correlation.
Reliability Analysis on the Correlation of Traffic
Now analyze the impact of the correlation of the two flows arrival on the reliability of the network system, and the arrival rate of both traffics follows a normal distribution. The arrival rate function of one flow is:
1( )=900+900 sin( )t t
The arrival rate function of another flow is:
2( )=900+990 sin (t t a)
(12)
Initial phase a in λ2 (t) are given by 0、-0.157、-0.314、-0.471、-0.628、-0.785、-0.942、
-1.099、-1.256、-1.413、-1.57、-1.727、-1.884、-2.041、-2.198、-2.355、-2.512、-2.669、
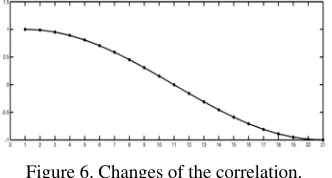
[image:5.612.224.390.177.266.2]-2.826、-2.983 and -3.14 in order to obtain 21 arrival rate curves [λ2(t)]1~[λ2(t)]21. Get 21 groups of arrival traffic with λ1 (t) respectively.
Figure 6. Changes of the correlation.
In Figure 7, the abscissas from 1 to 21 correspond to the correlation coefficient between the intensity curve λ1 (t) and the intensity curve [λ2 (t)]1~[λ2(t)]21, respectively, showing the change of the decreasing correlation.
[image:5.612.127.524.297.648.2]Relevant parameters are substituted into the model and simulation is performed using Matlab. The reliability simulation results are shown in Figure 6, 7, 8.
Figure 7. Change of reliability based on the packet loss rate.
Figure 8. Change of reliability based on the average queuing delay.
Figure 9. Change of reliability.
From the analysis of Figure 7 and Figure 8, it can be seen that as the correlation between the two flows decreases, the number of lost data packet and average queuing delay decrease gradually, and the reliability of the network system gradually increases until it does not change. So we can get total reliability changes in Figure 9.
correlation coefficient means a higher idle rate of network system resources. In the same time, no more traffic can be delivered. Therefore, it is necessary to control the traffic correlation parameter ‘r’ to ensure the effective balance between reliability and resource utilization in the network system.
Conclusion
Based on the queuing theory model, the packet loss rate analysis model of the network system and the influence of the traffic correlation on the reliability of the network system are analyzed. In this paper, the sine wave with random phase is used to analyze the arrival rate of network traffic. Then the packet loss rate model is obtained based on the queuing theory model, and based on the impact of the packet loss rate on the performance of the network system to analyze the system reliability. Finally, the influence of the correlation between the arrival traffic rate on the reliability of the network system is analyzed with the help of the correlation coefficient. It is concluded that in order to ensure an effective balance between the reliability of the network system and the utilization of the network system resources, it is necessary to control the correlation parameter ‘r’ between the traffic. The effective adjustment of traffic arrival through the correlation parameter ‘r’ is realized to avoid the network system's serious congestion phenomenon, and at the same time ensure the network system's high resource utilization rate.
Acknowledgment
The work was supported by the National Natural Science Foundation of China [grant numbers 71771214]; and the Research Project of National University of Defense Technology [grant number JCKY2016203A017].
References
[1] Lars Thylen, Wosinska L, Holmstrom R P. Large-Capacity Strictly Nonblocking Optical Cross-Connects Based on Microelectrooptomechanical Systems (MEOMS) Switch Matrices: Reliability Performance Analysis[J]. Journal of Lightwave Technology, 2001, 19(8): 1065-1075.
[2] Hayashi M, Ohara K, Tanaka H, et al. Highly Reliable Optical Bidirectional Path Switched Ring Networks Applicable to Photonic IP Networks [J]. Lightwave Technology Journal of, 2003, 21(2): 356-364.
[3] López F.A., Páez A., Carrasco J.A., et al. Vulnerability of nodes under controlled network topology and flow autocorrelation conditions [J]. Journal of Transport Geography, 2017, 59 :77-87. [4] Su F., Dong H., Jia L., et al. Space–time correlation analysis of traffic flow on road network [J]. International Journal of Modern Physics B, 2016, 31(5): 1750027-.
[5] Fei S.U., Dong H.H., Jia L.M., et al. Identification of Critical Section in Urban Traffic Road Network Based on Space-time Correlation [J]. Journal of Transportation Systems Engineering & Information Technology, 2017.
[6] Song L.H., Ming C., Qiu X.F. Simulation & Comparison of Impact of Traffic Characteristics on Queuing Performance [J]. Acta Simulata Systematica Sinica, 2005, 8(4): 1-11.
[7] Grossglauser M., Bolot J.C. On the relevance of long-range dependence in network traffic [C]// Conference proceedings on Applications, technologies, architectures, and protocols for computer communications. ACM, 1996: 15-24.
[8] Xiao-Ming H.E., Chu Q.X., Zhu M.Y., et al. Analysis of Network Performance for a New Self-similar Traffic Model [J]. Science Technology & Engineering, 2007.
[9] Na, F. Study of generalized Poisson process and its sum, Chongqing Normal University, Chongqing, 2012. [in Chinese ].